PUMA AG Rudolf Dassler Sport - About PUMA
PUMA AG Rudolf Dassler Sport - About PUMA
PUMA AG Rudolf Dassler Sport - About PUMA

Create successful ePaper yourself
Turn your PDF publications into a flip-book with our unique Google optimized e-Paper software.
<strong>PUMA</strong> <strong>AG</strong> <strong>Rudolf</strong> <strong>Dassler</strong> <strong>Sport</strong><br />
FINANCIAL REPORT<br />
January - June of 2009
CONTENT<br />
Financial Highlights 3<br />
Management Report<br />
- General Economic Conditions 4<br />
- Strategy 4<br />
- Sales and Earnings Development 5 - 7<br />
- Net Assets and Financial Position 8<br />
- Regional Development 9<br />
- Outlook 10<br />
Consolidated Financial Statements<br />
- Balance Sheet 11<br />
- Income Statements 12<br />
- Cashflow Statement 13<br />
- Changes in Equity 14<br />
- Segment Data 15<br />
- Notes to the Financial Report 16 – 20<br />
Board of Management/Supervisory Board 21<br />
Financial Calendar 22<br />
rebased<br />
120<br />
100<br />
80<br />
60<br />
40<br />
20<br />
0<br />
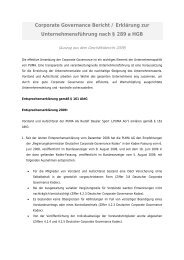
Development of the <strong>PUMA</strong> Share<br />
Rebased Development incl. Trading Volume (Xetra)<br />
July Aug Sep Oct Nov Dec Jan Feb Mar Apr May June<br />
Xetra Trading Volume <strong>PUMA</strong> Share MDAX Index<br />
140<br />
120<br />
100<br />
80<br />
60<br />
40<br />
20<br />
0<br />
Trading Volume (in Tsd. Shares)<br />
-2-
Financial Highlights 1-6/2009 1-6/2008 Devi-<br />
€ million € million ation<br />
Brand Sales 1.374,1 1.370,0 0,3%<br />
Consolidated net sales 1.297,7 1.250,1 3,8%<br />
Gross profit in % 51,1% 53,0%<br />
Operating result before special items 177,1 188,1 -5,9%<br />
Special items -110,0 0,0<br />
Net earnings 44,0 135,7 -67,5%<br />
- in % 3,4% 10,9%<br />
Total assets 2.047,8 1.780,8 15,0%<br />
Equity ratio in % 56,6% 60,7%<br />
Working capital 540,6 552,1 -2,1%<br />
Cashflow - gross 203,5 222,0 -8,4%<br />
Free cashflow (before acquisition) 45,1 -23,6 -291,3%<br />
Earnings per share before special items (in €) 8,51 8,74 -2,6%<br />
Earnings per share (in €) 2,92 8,74 -66,6%<br />
Cashflow - gross per share (in €) 13,49 14,30 -5,7%<br />
Free cashflow per share (in €) (before acquisition) 2,99 -1,52 -296,9%<br />
Share price at end of the period 155,97 213,16 -26,8%<br />
Market capitalization at end of the period 2.352,4 3.268,3 -28,0%<br />
Investments in tangible and intangible assets (without goodwill) 24,6 50,6 -51,4%<br />
2005<br />
2006<br />
2007<br />
2008<br />
2009<br />
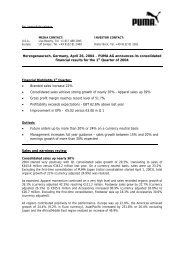
Brand Sales Jan. - June (€ million)<br />
0 500 1.000 1.500<br />
2005<br />
2006<br />
2007<br />
2008<br />
2009<br />
Net Sales Jan. - June (€ million)<br />
0 200 400 600 800 1.000 1.200 1.400<br />
Jochen Zeitz, CEO:<br />
-3-<br />
“Despite an ongoing challenging market environment<br />
and the global economic recession, <strong>PUMA</strong> achieved a<br />
solid performance in the first half of 2009. The<br />
restructuring and reengineering program has already<br />
shown first effects and we will continue to strictly<br />
proceed while focusing on efficient measures to<br />
strengthen the brand and its products in the coming<br />
quarters.”<br />
2005<br />
2006<br />
2007<br />
2008<br />
2009<br />
Earnings per Share Jan. - Juni (€)<br />
(2009 before special items)<br />
0,00 2,00 4,00 6,00 8,00 10,00
Management Report<br />
General Economic Conditions<br />
According to an expert opinion published by the Institute<br />
for the World Economy (”Institut für Weltwirtschaft“) in<br />
Kiel on March 12, 2009, following the massive fall in<br />
world economic activity observed in autumn in the wake<br />
of the outburst of the global financial crisis, output<br />
continued to decline steeply in the first quarter of 2009<br />
both in the industrial countries and in most emerging<br />
economies.<br />
A number of indicators suggest that the pace of decline<br />
in the global economy has been moderating in recent<br />
months. World trade has been stabilizing after January,<br />
with foreign trade in emerging countries even slightly<br />
rising. At the same time commodity prices have started<br />
to recover. Industrial production has shown increasing<br />
signs of bottoming out, and economic sentiment<br />
indicators, while still at very low levels, have started to<br />
improve.<br />
Strategy<br />
-4-<br />
<strong>PUMA</strong>’s goal is to be “The Most Desirable <strong>Sport</strong>lifestyle<br />
Company”. Along its charted course <strong>PUMA</strong> makes use of<br />
the opportunities offered by the sportlifestyle market to<br />
strengthen its position in all categories and regions as<br />
one of the few multi-category brands. Selected<br />
categories and divisions are being developed with a view<br />
to achieving permanent value increases through unique<br />
brand positioning. <strong>PUMA</strong> is a sportlifestyle brand where<br />
product categories originate in <strong>Sport</strong> before being<br />
continued in Lifestyle and on through to Fashion.<br />
A detailed description of the strategic goal and its<br />
potential can be found in the annual financial statements<br />
(Annual Report) for 2008.
Sales and Earnings Development<br />
Global branded sales<br />
Sales under the <strong>PUMA</strong> brand, which include consolidated<br />
and license sales, reached € 636.5 million during the<br />
second quarter, a currency-adjusted decrease of 2.6%<br />
and an increase of 1.2% in Euro terms. Altogether, the<br />
quarter marked a solid performance in a globally<br />
challenging environment.<br />
During the first six months, branded sales declined<br />
currency-neutral 2.9%. In Euro terms, sales increased<br />
0.3% reaching € 1,374.1 million. On a currency-neutral<br />
basis, Footwear sales were down by 1.1% to € 745.6<br />
million and Apparel 7.0% to € 460.9 million. Accessories<br />
increased by 1.3% to € 167.7 million.<br />
800<br />
600<br />
400<br />
200<br />
0<br />
Consolidated Net Sales (€ million)<br />
Q1 Q2 Q3 Q4<br />
2008 2009<br />
Licensed business<br />
The licensed business decreased in the second quarter by<br />
32.2% currency-adjusted to € 36.2 million and by 37.5%<br />
to € 76.4 million for the first half due to the take-over of<br />
a licensee.<br />
Based on licensed sales, the company realized a royalty<br />
and commission income of € 5.2 million in the second<br />
quarter versus € 6.4 million in the previous year’s quarter<br />
and € 10.2 million versus € 13.4 million year-to-date.<br />
Footwear<br />
Apparel<br />
Acces s ories<br />
Consolidated Net Sales Jan. - June (€ million)<br />
0 200 400 600 800<br />
2008 2009<br />
-5-<br />
Consolidated sales<br />
Currency-adjusted consolidated sales were flat<br />
compared to last year but increased in Euro terms a<br />
solid 4.1% to € 600.3 million. On a currency-neutral<br />
basis, Footwear was down 2.0% reaching € 330.0<br />
million, and Apparel decreased 5.7% to € 203.8 million.<br />
Accessories improved by a strong 41.2% to € 66.4<br />
million, which is mainly due to first time consolidations.<br />
After six months, consolidated sales were up 0.4% on a<br />
currency-neutral basis and 3.8% in Euro terms to €<br />
1,297.7 million. In spite of a challenging market<br />
environment, sales in the Americas region increased<br />
whereas EMEA and Asia/Pacific were below last year’s<br />
level. In total, Footwear sales were € 727.1 million,<br />
representing a currency-neutral decrease of 1.4% and<br />
Apparel sales decreased 7.0% to € 426.3 million due to<br />
high comparables, which resulted from replica sales<br />
relating to the Football Euro Cup last year. Accessories<br />
were up a strong 49.1% to € 144.3 million.
Gross profit remains above 51%<br />
The overall market environment paired with a change in<br />
the regional sales mix caused the reduction in gross<br />
profit margin in the second quarter from last year’s<br />
52.5% to 50.0%. After six months, a gross profit margin<br />
of 51.1% was achieved compared to 53.0%. Footwear<br />
reported 49.7% versus 53.4%, Apparel 52.3%<br />
compared to 52.5% and Accessories increased to 54.9%<br />
versus 52.1% last year.<br />
56%<br />
52%<br />
48%<br />
44%<br />
40%<br />
Gross Profit Margin (in %)<br />
Q1 Q2 Q3 Q4<br />
2008 2009<br />
Operating expenses<br />
Due to first effects from the reengineering and<br />
restructuring program, operating expenses decreased in<br />
the second quarter by 1.8% to € 242.2 million or from<br />
42.8% to 40.3% of sales. During the first half, operating<br />
expenses increased only 1.8% to € 496.2 million,<br />
representing a cost ratio of 38.2% versus last year’s<br />
39.0%.<br />
Marketing/Retail expenses decreased 3.6% to € 253.1<br />
million as last year’s Olympic Games and Euro Cup<br />
required a higher spending level. As a result, the cost<br />
ratio declined from 21.0% to 19.5% of sales. Other<br />
selling expenses increased by 14.4% to € 158.9 million,<br />
or from 11.1% to 12.2% of sales, mainly due to first<br />
time consolidations and currency impacts. Expenses for<br />
product development and design were up 14.7% to €<br />
28.9 million, or as a percentage of sales from 2.0% to<br />
2.2%.<br />
-6-<br />
Other general and administration expenses were down a<br />
strong 9.3% and totaled € 55.3 million, representing<br />
4.3% of sales versus 4.9% last year. Depreciation which<br />
is included in operating expenses increased by 16.3% to<br />
€ 31.0 million due to full year effects from last year’s<br />
retail expansion.
Operational result before special items<br />
<strong>PUMA</strong> achieved a solid operating result of € 63.1 million<br />
in the second quarter versus € 62.3 million last year. As<br />
a percentage of sales this relates to a margin of 10.5%<br />
compared to 10.8%.<br />
After six months the operating result was down 5.9%<br />
from € 188.1 million to € 177.1 million. The operating<br />
margin stood at 13.6% compared to 15.0% last year.<br />
Special Items – Restructuring charge<br />
The reengineering and restructuring program that led to<br />
a one-time charge of 110 million in the first quarter will,<br />
for the most part, be finalized at the end of 2010. The<br />
program should provide for a more efficient business<br />
platform aligned to an expectedly challenging<br />
environment in the upcoming quarters.<br />
Taking the special items into account, EBIT after six<br />
months amounted to € 67.1 million compared to € 188.1<br />
million last year.<br />
160<br />
120<br />
80<br />
40<br />
0<br />
EBIT (€ million)<br />
(2009 before special items)<br />
Q1 Q2 Q3 Q4<br />
2008 2009<br />
Financial result<br />
The financial result reflects negative € 2.1 million for the<br />
second quarter versus an income of € 0.1 million last<br />
year. Negative € 3.7 million impacted the first half, while<br />
last year showed an income of € 1.0 million. Significantly<br />
lower interest rates and the accumulation of interest on<br />
purchase price liabilities led to this negative impact on<br />
the financial result.<br />
Earnings<br />
The company’s pre-tax profit (EBT) accounts for € 61.0<br />
million in the second quarter versus € 62.4 million last<br />
year. Net earnings totaled € 38.5 million versus € 45.6<br />
million, a decline of 15.6%. This results in earnings per<br />
share of € 2.55 compared to € 2.98 in the quarter.<br />
Before restructuring costs, EBT accounts for € 173.4<br />
million versus € 189.2 million for the first half and net<br />
earnings for € 128.4 million versus € 135.7 million, a<br />
decline of 5.4%. As a consequence, earnings per share<br />
were at € 8.51 compared to € 8.74. The operational tax<br />
ratio was calculated at 26.5% versus last year’s 28.5%.<br />
10,07<br />
5,04<br />
0,00<br />
Earnings per Share (in €)<br />
(2009 before special items)<br />
Q1 Q2 Q3 Q4<br />
2008 2009<br />
-7-<br />
Taking into account the restructuring costs, EBT was at<br />
€ 63.4 million and net earnings at € 44.0 million in the<br />
first half of the year. Earnings per share were at € 2.92<br />
versus € 8.74 last year.
Net Assets and Financial Position<br />
Equity<br />
As of June 30, 2009, total assets climbed by 15.0% to €<br />
2,047.8 million. Due to the higher balance sheet total, the<br />
equity ratio stood at 56.6% after 60.7% in the previous<br />
year.<br />
Working capital<br />
In reporting terms, inventories grew 3.0% to € 432.1<br />
million. Inventories were down 0.7% on a comparable<br />
basis, showing a strong improvement versus end of Q1.<br />
Accounts receivables were up 6.2% (3.1% on a<br />
comparable basis), reaching € 502.8 million. Working<br />
capital totaled € 540.6 million (ex acquisition € 524.9<br />
million) compared to € 552.1 million last year,<br />
manifesting a strong improvement in this area from the<br />
first quarter.<br />
Capex/Cashflow<br />
For Capex, the company spent € 24.6 million in the first<br />
half versus € 50.6 million last year. Due to the reduced<br />
capital expenditure as well as a solid improvement in<br />
working capital, <strong>PUMA</strong>’s free cashflow reached € 45.1<br />
million compared to an outflow of € 23.6 million in last<br />
year’s comparison, representing a strong improvement<br />
over last year.<br />
An outflow of € 61.0 million (last year: € 19.7 million) is<br />
related to acquisition cost. Taking the acquisition cost<br />
into account, the free cashflow was € -15.8 million<br />
compared to € -43.3 million last year.<br />
-8-<br />
Cash position<br />
Total cash end of June stood at € 302.7 versus € 288.2<br />
million last year. Bank debts were down from € 65.6<br />
million to € 44.8 million. As a result, the net cash<br />
position increased from € 222.6 million to € 257.9 million<br />
year over year, underlying <strong>PUMA</strong>’s strong focus on<br />
efficient cash management.
Regional Development<br />
Sales in the EMEA region reached € 288.3 million in the<br />
second quarter, a currency-adjusted decrease of 1.4%.<br />
Year-to-date, sales were down by 2.3% to € 654.4<br />
million, representing 50.4% of consolidated sales. Gross<br />
profit margin was at a strong 53.5% compared to 54.5%<br />
last year.<br />
Second quarter sales in the Americas were up 6.9%<br />
currency-adjusted, reaching € 168.6 million. First half<br />
sales increased 9.2% to € 346.7 million. The region now<br />
accounts for 26.7% of consolidated sales. Gross profit<br />
margin stood at 47.1% compared to 48.9% last year.<br />
In the US market, sales increased by 4.8% to $ 132.7<br />
million in the second quarter and by 4.1% to $ 271.4<br />
million after six months.<br />
E M E A<br />
Am ericas<br />
Asia/Pacific<br />
Sales by Region (Jan. - June) (€ million)<br />
0 200 400 600 800<br />
2008 2009<br />
Sales in the Asia/Pacific region decreased in the<br />
second quarter by 4.5% currency-adjusted to € 143.4<br />
million and 2.8% after six months reaching € 296.7<br />
million. The total region accounts for 22.9% of sales.<br />
Gross profit margin reached 50.5% versus 53.6% last<br />
year.<br />
-9-<br />
Growth Rates Sales<br />
Q2/2009 1-6/2009<br />
Euro<br />
currency<br />
adjusted<br />
Euro<br />
currency<br />
adjusted<br />
% % % %<br />
Breakdown by regions<br />
EMEA -3,8 -1,4 -5,3 -2,3<br />
Americas 14,9 6,9 17,3 9,2<br />
Asia/Pacific 9,9 -4,5 12,4 -2,8<br />
Total 4,1 0,0 3,8 0,4<br />
Breakdown by product segments<br />
Footwear 1,5 -2,0 1,1 -1,4<br />
Apparel -1,2 -5,7 -2,7 -7,0<br />
Accessories 46,2 41,2 55,7 49,1<br />
Total 4,1 0,0 3,8 0,4
Outlook 2009<br />
Global Economy<br />
According to an expert opinion published by the Institute<br />
for the World Economy (”Institut für Weltwirtschaft“) in<br />
Kiel on June 11, 2009, strong economic policy stimulus<br />
and gradual improvement of the situation in the financial<br />
sector lead to expect an end of the decline of global<br />
production in the course of the summer semester 2009.<br />
However, the subsequent recovery will be modest. A<br />
strong recovery, as has often been observed after deep<br />
recessions, is unlikely.<br />
Production should be near its bottom, but strong<br />
recovery is not in sight<br />
Market environment remains challenging<br />
A solid first half performance and a pro-active<br />
restructuring and reengineering program, which has<br />
achieved improvements in operating expenses, working<br />
capital and free cashflow, have enabled <strong>PUMA</strong> to protect<br />
its industry leading key-financial parameters. Further<br />
improvements should be realized over the next 18<br />
months as the program continues to yield additional<br />
efficiencies and cost savings.<br />
However, we remain highly cautious and anticipate a<br />
continued challenging and volatile retail industry due to<br />
the decline of private consumption as a result of the<br />
weakness in the global economy, which may negatively<br />
impact sales in second half.<br />
After 14 years of consecutive growth, the year 2009 will<br />
be taken as a year of consolidation with a clear focus on<br />
adjusting the cost basis in alignment to the current<br />
business environment. First positive signs are not<br />
expected before 2010, the year that is highlighted by<br />
the upcoming Football World Cup in South Africa, where<br />
<strong>PUMA</strong> will once again be one of the most dominant<br />
brands. It currently outfits eleven African Football<br />
Federations including Egypt, the African Cup of Nations<br />
winner 2008, as well as the reigning World Champion,<br />
Italy.<br />
-10-<br />
Furthermore, additional focus for 2009 is on working<br />
capital improvements to strengthen the cash position and<br />
therefore the return on capital employed by year-end.<br />
With all the implemented measures, <strong>PUMA</strong> plans to<br />
protect its industry-leading key financial parameters.<br />
Investments<br />
Investments originally expected in the range of € 65<br />
million and € 75 million for 2009 were adjusted to € 55<br />
million in accordance with the implemented cost<br />
reduction program. Included in the total is capital<br />
expenditure of about € 20 million for the new corporate<br />
headquarters “<strong>PUMA</strong> Plaza“ in Herzogenaurach. The new<br />
administration center “<strong>PUMA</strong> Plaza“, which will house a<br />
brand center as well as a new concept store and a<br />
factory outlet store, will be ready for occupancy at the<br />
end of 2009.<br />
Short-term purchase price liabilities from corporate<br />
acquisitions and expansion of the consolidated group are<br />
expected to result in an additional cash outflow of up to<br />
€ 100 million in 2009.
Balance Sheet June 30,'09 June 30,'08 Devi- Dec. 31,'08<br />
ASSETS<br />
€ million € million ation € million<br />
Cash and cash equivalents 302,7 288,2 5,0% 375,0<br />
Inventories 432,1 419,5 3,0% 430,8<br />
Trade receivables 502,8 473,6 6,2% 396,5<br />
Other current assets (Working Capital) 118,0 118,2 -0,2% 124,3<br />
Other current assets 5,9 0,4 1554,2% 35,5<br />
Current assets 1.361,5 1.299,9 4,7% 1.362,0<br />
Deferred taxes 114,9 77,6 48,0% 80,5<br />
Other non-current assets 571,4 403,3 41,7% 456,2<br />
Non-current assets 686,3 481,0 42,7% 536,6<br />
2.047,8 1.780,8 15,0% 1.898,7<br />
LIABILITIES AND SHAREHOLDERS' EQUITY<br />
Current bank liabilities 44,8 65,6 -31,6% 49,7<br />
Trade liabilities 271,5 253,8 7,0% 269,1<br />
Other current liabilities (Working Capital) 240,7 205,5 17,1% 246,1<br />
Other current liabilities 154,3 72,0 114,3% 49,8<br />
Current liabilities 711,4 596,8 19,2% 614,8<br />
Deferred taxes 26,5 22,7 16,6% 26,5<br />
Pension provisions 20,6 17,7 16,6% 21,3<br />
Other non-current liabilities 131,1 63,2 107,5% 58,9<br />
Non-current liabilities 178,2 103,6 72,1% 106,7<br />
Shareholders' equity 1.158,3 1.080,5 7,2% 1.177,2<br />
2.047,8 1.780,8 15,0% 1.898,7<br />
-11-
Income Statement Q2/2009 Q2/2008 Devi- 1-6/2009 1-6/2008 Devi-<br />
€ million € million ation € million € million ation<br />
Sales 600,3 576,8 4,1% 1.297,7 1.250,1 3,8%<br />
Cost of sales -300,2 -274,2 9,5% -634,6 -587,8 8,0%<br />
Gross profit 300,1 302,6 -0,8% 663,1 662,3 0,1%<br />
- in % of consolidated sales 50,0% 52,5% 51,1% 53,0%<br />
Royalty and commission income 5,2 6,4 -18,8% 10,2 13,4 -24,1%<br />
305,2 308,9 -1,2% 673,3 675,8 -0,4%<br />
Other operating income and<br />
expenses (incl. depreciation) -242,2 -246,6 -1,8% -496,2 -487,6 1,8%<br />
Operational result before special items 63,1 62,3 1,2% 177,1 188,1 -5,9%<br />
Special items 0,0 0,0 -110,0 0,0<br />
EBIT 63,1 62,3 1,2% 67,1 188,1 -64,3%<br />
- in % of consolidated sales 10,5% 10,8% 5,2% 15,0%<br />
Financial result -2,1 0,1 -3,7 1,0<br />
EBT 61,0 62,4 -2,3% 63,4 189,2 -66,5%<br />
- in % of consolidated sales 10,2% 10,8% 4,9% 15,1%<br />
Taxes on income -23,0 -17,3 32,9% -20,3 -53,9 -62,4%<br />
- Tax rate 37,7% 27,7% 32,0% 28,5%<br />
Net earnings attributable to minority interest 0,5 0,4 9,5% 0,9 0,4 122,1%<br />
Net earnings 38,5 45,6 -15,6% 44,0 135,7 -67,5%<br />
Earnings per share (€) 2,55 2,98 -14,4% 2,92 8,74 -66,6%<br />
Earnings per share (€) - diluted 2,55 2,98 -14,4% 2,92 8,74 -66,6%<br />
Weighted average shares outstanding 15,082 15,529 -2,9%<br />
Weighted average shares outstanding - diluted 15,082 15,532 -2,9%<br />
-12-
Cashflow Statement 1-6/2009 1-6/2008 Devi-<br />
€ million € million ation<br />
EBT 63,4 189,2 -66,5%<br />
Depreciation 31,0 26,7 16,3%<br />
Special Items 110,0 0,0<br />
Non-cash effected expenses and income -0,9 6,1 -115,4%<br />
Cashflow - gross 203,5 222,0 -8,4%<br />
Change in net assets -91,8 -152,5 -39,8%<br />
Taxes, interests and other payments -48,1 -49,9 -3,6%<br />
Cashflow from operating activities 63,5 19,6 223,7%<br />
Payments for acquisitions -61,0 -19,7 209,0%<br />
Purchase of property and equipment -24,6 -50,6 -51,4%<br />
Interest received and others 6,2 7,3 -15,9%<br />
Cashflow from investing activities -79,4 -63,0 26,1%<br />
Free Cashflow -15,8 -43,3 -63,5%<br />
Free Cashflow (before acquisition) 45,1 -23,6<br />
Capital increase 0,0 0,9<br />
Dividend payments -41,5 -42,5 -2,4%<br />
Purchase of own shares 0,0 -136,7<br />
Other changes -14,3 4,2<br />
Cashflow from financing activities -55,7 -174,0 -68,0%<br />
Effect on exchange rates on cash -0,7 -16,9 -95,9%<br />
Change in cash and cash equivalents -72,3 -234,3 -69,2%<br />
Cash and cash equivalents at beginning of financial year 375,0 522,5 -28,2%<br />
Cash and cash equivalents end of the period 302,7 288,2 5,0%<br />
-13-
Changes in Equity Subscribed Group reserves<br />
Consolidated Treasury Total Minorities Total<br />
€ million<br />
capital Capital Revenue Difference Cashflow profit/net stock Equity Equity<br />
reserve reserves from hedges income for before<br />
currency the year Minorities<br />
conversion<br />
Dec. 31, 2007 41,0 183,5 69,5 -73,0 -26,1 986,7 -34,7 1.146,8 8,0 1.154,8<br />
Dividend payment -42,5 -42,5 -42,5<br />
Currency changes -20,1 -20,1 -20,1<br />
Changes in the<br />
consolidated group 0,0 -7,6 -7,6<br />
Net effect on cashflow hedges,<br />
net of taxes -3,7 -3,7 -3,7<br />
Capital increase 0,0 0,9 0,9 0,9<br />
Consolidated profit 135,7 135,7 -0,4 135,3<br />
Purchase of treasury stock -136,7 -136,7 -136,7<br />
June 30, 2008 41,0 184,4 69,5 -93,1 -29,8 1.079,9 -171,4 1.080,5 0,0 1.080,5<br />
Dec. 31, 2008 41,0 185,5 69,5 -92,0 11,1 1.175,6 -216,1 1.174,7 2,5 1.177,2<br />
Dividend payment -41,5 -41,5 -41,5<br />
Currency changes -5,7 -5,7 0,3 -5,5<br />
Net effect on cashflow hedges,<br />
net of taxes -17,4 -17,4 -17,4<br />
Value of employees services 2,3 2,3 2,3<br />
Consolidated profit 44,0 44,0 -0,9 43,1<br />
Reduction of subscibed capital due<br />
to cancellation of own shares -2,4 -213,7 216,1 0,0 0,0<br />
June 30, 2009 38,6 187,8 69,5 -97,8 -6,2 964,5 0,0 1.156,5 1,8 1.158,3<br />
-14-
Segment Data<br />
Sales Gross profit<br />
by head office location of customer by head office location of customer<br />
Q2/2009 Q2/2008 Q2/2009 Q2/2008 1-6/2009 1-6/2008 1-6/2009 1-6/2008<br />
Breakdown by regions € million € million % % € million € million % %<br />
EMEA 288,3 299,6 51,5% 54,1% 654,4 690,7 53,5% 54,5%<br />
Americas 168,6 146,7 47,6% 47,6% 346,7 295,5 47,1% 48,9%<br />
- thereof USA in US$ 132,7 126,6 271,4 260,8<br />
Asia/Pacific 143,4 130,5 49,9% 54,2% 296,7 263,9 50,5% 53,6%<br />
600,3 576,8 50,0% 52,5% 1.297,7 1.250,1 51,1% 53,0%<br />
Sales<br />
Gross profit<br />
Q2/2009 Q2/2008 Q2/2009 Q2/2008 1-6/2009 1-6/2008 1-6/2009 1-6/2008<br />
Breakdown by product segments € million € million % % € million € million % %<br />
Footwear 330,0 325,1 48,7% 53,3% 727,1 719,4 49,7% 53,4%<br />
Apparel 203,8 206,3 50,7% 51,5% 426,3 438,1 52,3% 52,5%<br />
Accessories 66,4 45,4 54,2% 50,5% 144,3 92,7 54,9% 52,1%<br />
Sales<br />
Sales<br />
Gross profit<br />
Gross profit<br />
600,3 576,8 50,0% 52,5% 1.297,7 1.250,1 51,1% 53,0%<br />
-15-
Notes to the Financial Report for the First Six Months of 2009<br />
GENERAL REMARKS<br />
Under the “<strong>PUMA</strong>” brand name, <strong>PUMA</strong> Aktiengesellschaft<br />
<strong>Rudolf</strong> <strong>Dassler</strong> <strong>Sport</strong> (hereinafter “<strong>PUMA</strong> <strong>AG</strong>”) and its<br />
subsidiaries are engaged in the development and sales of<br />
a broad range of sport and sportlifestyle products<br />
including footwear, apparel and accessories. The<br />
company is a joint stock company under German law,<br />
with registered head office in Herzogenaurach, Federal<br />
Republic of Germany; its responsible court of registration<br />
is at Fürth (Bavaria).<br />
<strong>PUMA</strong> is an affiliated company of the PPR Group and will<br />
be consolidated in the consolidated financial statements<br />
of PPR.<br />
ACCOUNTING STANDARDS<br />
The unaudited financial report of <strong>PUMA</strong> <strong>AG</strong> and its<br />
subsidiaries (which together form the <strong>PUMA</strong> group) was<br />
prepared according to IAS 34 “Interim Financial<br />
Reporting” and should be read in connection with the<br />
annual financial statements as of December 31, 2008.<br />
The consolidated financial statements details contained<br />
therein apply to the financial reports for 2009, unless<br />
changes have been explicitly referred to.<br />
The financial report corresponds to all committing<br />
standards and interpretations applied and explained in<br />
the annual financial statements as of December 31,<br />
2008.<br />
This financial report is partly based on assumptions and<br />
estimates which have an impact on the amounts and on<br />
the breakdown of the reported assets and liabilities as<br />
well as of the revenues and expenses. The actual values<br />
may, in some exceptional cases, differ from these<br />
assumptions and estimates at a later date. The<br />
corresponding changes if and when they occur will be<br />
considered as soon as the findings are revised.<br />
CONSOLIDATED GROUP<br />
Effective from January 1, 2009 <strong>PUMA</strong> holds a majority<br />
interest in the previous licensee “Dobotex International<br />
BV“ in the Netherlands. According to the agreements<br />
concluded with the “minority shareholder“ relative to the<br />
possibility of taking over a 100% interest during the<br />
contractual period, Dobotex is constructively allocated to<br />
the <strong>PUMA</strong> Group as a 100% holding. Dobotex is a longstanding<br />
<strong>PUMA</strong> partner and holds the international <strong>PUMA</strong><br />
license for socks and bodywear.<br />
-16-<br />
In addition, <strong>PUMA</strong> acquired a 100% interest in the<br />
corporate merchandising firm “Brandon Company AB”<br />
effective from January 1, 2009. Through acquisition of<br />
the Swedish company, <strong>PUMA</strong> will strengthen its core<br />
business and expand into new business areas such as<br />
merchandizing and event marketing.<br />
Furthermore, effective from January 1, 2009, sales in<br />
Cyprus were taken over by the newly founded<br />
partnership ”<strong>PUMA</strong> Cyprus Ltd.“ According to the<br />
agreements concluded with the “minority shareholder“,<br />
the company is economically allocated to the <strong>PUMA</strong><br />
Group as a 100% holding and will be consolidated<br />
accordingly.
SEASONAL VARIANCE<br />
The group’s sales fluctuate with the seasons.<br />
Consequently, the sales and resulting earnings vary in<br />
the course of a year. Normally, sales and operational<br />
earnings reach their peak in the first and third quarter<br />
while the second and fourth quarter may be<br />
characterized by lower levels.<br />
EMPLOYEES<br />
Number of employees at the beginning<br />
of the period<br />
Number of employees at the end of the<br />
period<br />
Average number<br />
of employees<br />
2009 2008<br />
10,069 9,204<br />
9,796 9,311<br />
9,842 9,212<br />
EARNINGS PER SHARE<br />
Earnings per share are calculated according to<br />
IAS 33 by dividing the result for the period by the<br />
weighted average number of outstanding shares. The<br />
repurchased shares reduced the number of outstanding<br />
shares as well as diluted number of shares. In principle,<br />
outstanding stock options from the Management<br />
Incentive Program can result to a dilution of earnings per<br />
share.<br />
2009 2008<br />
Earnings per share € 2.92 € 8.74<br />
Diluted earnings per share € 2.92 € 8.74<br />
DIVIDEND<br />
-17-<br />
According to the Annual Shareholders’ Meeting on May<br />
13, 2009, a dividend of € 2.75 per share was approved<br />
for the fiscal year 2008. The dividend totaled € 41.5<br />
million and was paid to the shareholders beginning on<br />
May 14, 2009 and is considered as dividend payments in<br />
the “Cashflow Statement”.
SHAREHOLDERS’ EQUITY<br />
Subscribed Capital<br />
As of June 30, 2009 the subscribed capital amounted to<br />
€ 38.6 million, divided into 15,082,464 no par value<br />
shares.<br />
The board decided with the approval of the supervisory<br />
board to cancel all (950,000) own shares. Effective April<br />
29, 2009 all own shares were cancelled and share capital<br />
was reduced accordingly.<br />
SAPARDIS S.A., a fully subsidiary of PPR S.A., Paris,<br />
holds currently 69.36% of the subscribed capital.<br />
Treasury Stock<br />
The resolution adopted by the Annual General Meeting<br />
on May 13, 2009 authorized the company to purchase<br />
until November 12, 2010 its own shares to a value of up<br />
to ten percent of the share capital. This approval<br />
replaces the approval given at the Annual General<br />
Meeting on April 22, 2008.<br />
The company has not purchased own shares during the<br />
first six months. At the end of June, the company held<br />
no own shares.<br />
Effective April 29, 2009 all own shares were cancelled<br />
(see “Subscribed Capital”).<br />
-18-<br />
Development Number of Shares<br />
2009 2008<br />
Number of shares at the<br />
beginning of the period<br />
16,032,464 16,027,964<br />
Cancelled own shares -950,0000 0<br />
conversion of<br />
Management Incentives<br />
0 4,500<br />
Number of shares at the end<br />
of the period/subscribed<br />
capital<br />
15,082,464 16,032,464<br />
thereof own shares/treasury<br />
stocks<br />
0 -700,000<br />
Shares outstanding at<br />
the end of the period<br />
15,082,464 15,332,464<br />
Weighted average number<br />
of shares, outstanding<br />
15,082,464 15,529,248<br />
Diluted number of shares 15,082,464 15,531,594
Authorized Capital<br />
The resolution adopted by the Annual General Meeting<br />
on April 11, 2007 authorized the Management Board to<br />
increase until April 10, 2012 the share capital of the<br />
company, with the consent of the Supervisory Board as<br />
follows:<br />
• by issuing, on one or more occasions, new, no<br />
par value, bearer shares against cash<br />
contributions by up to € 7,500,000.00. The<br />
shareholders are basically entitled to have a<br />
pre-emptive right (Authorized Capital I).<br />
• by issuing, on one or more occasions, new, no<br />
par value, bearer shares against cash or noncash<br />
contributions by up to € 7,500,000.00. The<br />
pre-emptive right can be excluded in whole or<br />
in part (Authorized Capital II).<br />
Conditional Capital<br />
Pursuant to Article 4 (5) of the Articles of Association,<br />
conditional capital was created in the amount of € 3.9<br />
million (“conditional capital 2001”) in 2001 in order to<br />
finance a total of 1,530,000 stock options. The stock<br />
options were issued to Management in several tranches<br />
within the scope of the Stock Option Program. As of<br />
March 31, 2009, conditional capital amounting to € 0.2<br />
million was still available.<br />
By resolution of the shareholders’ meeting of 22 April<br />
2008, the share capital may be increased by up to € 1.5<br />
million (“conditional capital 2008”) through issuance of<br />
up to 600,000 new shares of stock. The conditional<br />
capital increase may be used only for the purpose of<br />
granting stock options to members of the Management<br />
Board and other executive staff of the Company and to<br />
subordinated affiliated companies.<br />
Management Incentive Program<br />
<strong>PUMA</strong> implements share-based remuneration systems in<br />
the form of stock option programs (SOP) and stock<br />
appreciation rights (SAR) with a view to providing long<br />
term incentive effects and thus retaining management<br />
staff in the company over the long term.<br />
From option programs issued in previous years 210,000<br />
virtual options from the SAR program were outstanding<br />
at the end of the reporting period. For further<br />
explanations concerning the respective programs please<br />
refer to the Annual Report 2008.<br />
At the shareholders’ meeting held on 22 April 2008, a<br />
new stock option program (SOP) was resolved upon in<br />
the form of a “Performance Share Program”. To this end,<br />
conditional capital (“conditional capital 2008”) was<br />
created and the Supervisory Board or the Management<br />
Board, respectively, were authorised to issue subscription<br />
rights to Board members and other executive staff of the<br />
Company and to subordinated affiliated companies up to<br />
the end of a period of five years (following entry of the<br />
Conditional Capital in the Commercial Register), but at<br />
least, however, until the end of a three month period<br />
following the ordinary shareholders’ meeting in the year<br />
2013.<br />
-19-<br />
As far as Management Board members are concerned,<br />
the responsibility lies exclusively with the Supervisory<br />
Board. In all, up to 1,200,000 subscription rights<br />
(thereof, up to 65% attributable to the Board) may be<br />
issued. The subscription rights may be issued within the<br />
subscription period in annual tranches of a maximum of<br />
30% of the total volume, whereby the first tranche was<br />
issued with a total of 113,000 subscription rights as of<br />
July 21, 2008 and the second tranche was issued with a<br />
total of 139,002 subscription rights as of April 14, 2009.<br />
The subscription rights issued are to run over a five-year<br />
term and should be exercised after a period of two years<br />
at the earliest, provided however, that the <strong>PUMA</strong> share<br />
price achieved an increase of at least 20%. In contrast to<br />
traditional stock option programs, participants are not<br />
entitled to acquire shares at a certain preferred price.<br />
Instead, provided that performance targets are met,<br />
Management is granted the same value in shares rather<br />
than a cash bonus.<br />
The authorisation also involves a provision that the<br />
Supervisory Board, in keeping with the recommendations<br />
of the Corporate Governance Code, can limit the content<br />
and volume of the subscription rights granted to<br />
Management Board members either fully or in part in the<br />
event of extraordinary, non-foreseeable developments.<br />
The Management Board may also use this possibility with<br />
respect to the other executive staff concerned.
EVENTS AFTER THE BALANCE SHEET DATE<br />
Several group companies are undergoing tax audits.<br />
Additional tax payments as a result of such audits can<br />
currently not be quantified.<br />
No further events occurred after the balance sheet date<br />
which may affect the financial situation and earnings<br />
position as of June 30, 2009.<br />
Responsibility Statement<br />
“To the best of our knowledge, and in accordance with<br />
the applicable reporting principles for interim financial<br />
reporting, the interim consolidated financial statements<br />
give a true and fair view of the assets, liabilities, financial<br />
position and profit or loss of the group, and the interim<br />
management report of the group includes a fair review of<br />
the development and performance of the business and<br />
the position of the group, together with a description of<br />
the principal opportunities and risks associated with the<br />
expected development of the group for the remaining<br />
months of the financial year.”<br />
Herzogenaurach, August 7, 2009<br />
The Board of Management<br />
-20-
Board of Management<br />
Jochen Zeitz<br />
Chairman and CEO<br />
Melody Harris-Jensbach<br />
Deputy CEO<br />
(Chief Product Officer)<br />
Dieter Bock (until July 31, 2009)<br />
(Chief Financial Officer)<br />
Klaus Bauer (from August 1, 2009)<br />
(Chief Operating Officer)<br />
Stefano Caroti<br />
(Chief Commercial Officer)<br />
Reiner Seiz<br />
(Chief Supply Chain Officer)<br />
Deputy Member of the Board of Management<br />
Antonio Bertone<br />
(Chief Marketing Officer)<br />
Deputy Member of the Board of Management<br />
Supervisory Board<br />
François-Henri Pinault<br />
Chairman<br />
Thore Ohlsson<br />
Deputy Chairman<br />
Jean-François Palus<br />
Grégoire Amigues<br />
Erwin Hildel<br />
Employees’ Representative<br />
Oliver Burkhardt<br />
Employees’ Representative<br />
-21-
Financial Calendar FY 2009<br />
February 18, 2009 Financial Results FY 2008<br />
May 8, 2009 Financial Results Q1/2009<br />
Press- and Analyst-Conference Call<br />
May 13, 2009 Annual Shareholders’ Meeting<br />
August 7, 2009 Financial Results Q2/2009<br />
Press- and Analyst-Conference Call<br />
November 9, 2009 Financial Results Q3/2009<br />
Press- and Analyst-Conference Call<br />
The financial releases and other financial information are available on the Internet at<br />
„about.puma.com“.<br />
Published by:<br />
<strong>PUMA</strong> <strong>AG</strong> <strong>Rudolf</strong> <strong>Dassler</strong> <strong>Sport</strong><br />
Wuerzburger Str. 13<br />
D-91074 Herzogenaurach<br />
Tel.: +49 (0)9132 81-0<br />
Fax: +49 (0)9132 81-2246<br />
email: investor-relations@puma.com<br />
Internet: http://www.puma.com<br />
This document contains forward-looking information about the Company’s financial status and strategic initiatives. Such information is subject to a certain level of risk and uncertainty that could cause the Company's actual results to differ<br />
significantly from the information discussed in this document. The forward-looking information is based on the current expectations and prognosis of the management team. Therefore, this document is further subject to the risk that such<br />
expectations or prognosis, or the premise of such underlying expectations or prognosis, become erroneous. Circumstances that could alter the Company's actual results and procure such results to differ significantly from those contained in<br />
forward-looking statements made by or on behalf of the Company include, but are not limited to those discussed be above.<br />
###<br />
<strong>PUMA</strong> ® is the global athletic brand that successfully fuses influences from sport, lifestyle and fashion.<br />
<strong>PUMA</strong>’s unique industry perspective delivers the unexpected in sportlifestyle footwear, apparel and accessories, through technical innovation and revolutionary design.<br />
Established in Herzogenaurach, Germany in 1948, <strong>PUMA</strong> distributes products in over 80 countries.<br />
For further information please visit www.puma.com<br />
-22-