Prepared by OSEDA --- Print date: January 07, 2005 Missouri ...
Prepared by OSEDA --- Print date: January 07, 2005 Missouri ...
Prepared by OSEDA --- Print date: January 07, 2005 Missouri ...

You also want an ePaper? Increase the reach of your titles
YUMPU automatically turns print PDFs into web optimized ePapers that Google loves.
MSIP<br />
Standard Indicator description<br />
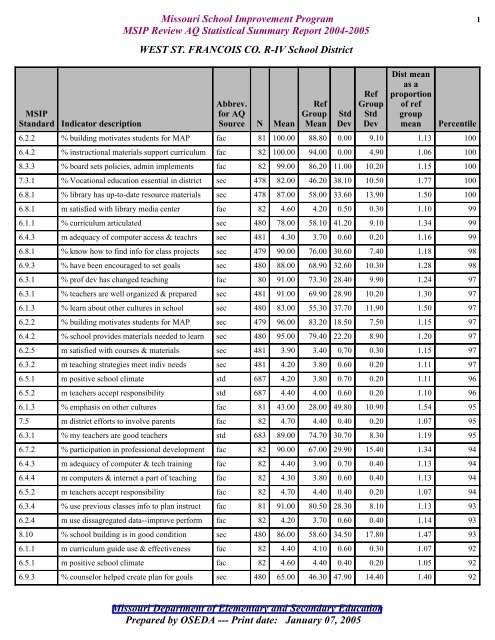
<strong>Missouri</strong> School Improvement Program 1<br />
MSIP Review AQ Statistical Summary Report 2004-<strong>2005</strong><br />
WEST ST. FRANCOIS CO. R-IV School District<br />
Abbrev.<br />
for AQ<br />
Source N Mean<br />
Ref<br />
Group<br />
Mean<br />
Std<br />
Dev<br />
Ref<br />
Group<br />
Std<br />
Dev<br />
<strong>Missouri</strong> Department of Elementary and Secondary Education<br />
<strong>Prepared</strong> <strong>by</strong> <strong>OSEDA</strong> --- <strong>Print</strong> <strong>date</strong>: <strong>January</strong> <strong>07</strong>, <strong>2005</strong><br />
Dist mean<br />
as a<br />
proportion<br />
of ref<br />
group<br />
mean Percentile<br />
6.2.2 % building motivates students for MAP fac 81 100.00 88.80 0.00 9.10 1.13 100<br />
6.4.2 % instructional materials support curriculum fac 82 100.00 94.00 0.00 4.90 1.06 100<br />
8.3.3 % board sets policies, admin implements fac 82 99.00 86.20 11.00 10.20 1.15 100<br />
7.3.1 % Vocational education essential in district sec 478 82.00 46.20 38.10 10.50 1.77 100<br />
6.8.1 % library has up-to-<strong>date</strong> resource materials sec 478 87.00 58.00 33.60 13.90 1.50 100<br />
6.8.1 m satisfied with library media center fac 82 4.60 4.20 0.50 0.30 1.10 99<br />
6.1.1 % curriculum articulated sec 480 78.00 58.10 41.20 9.10 1.34 99<br />
6.4.3 m adequacy of computer access & teachrs sec 481 4.30 3.70 0.60 0.20 1.16 99<br />
6.8.1 % know how to find info for class projects sec 479 90.00 76.00 30.60 7.40 1.18 98<br />
6.9.3 % have been encouraged to set goals sec 480 88.00 68.90 32.60 10.30 1.28 98<br />
6.3.1 % prof dev has changed teaching fac 80 91.00 73.30 28.40 9.90 1.24 97<br />
6.3.1 % teachers are well organized & prepared sec 481 91.00 69.90 28.90 10.20 1.30 97<br />
6.1.3 % learn about other cultures in school sec 480 83.00 55.30 37.70 11.90 1.50 97<br />
6.2.2 % building motivates students for MAP sec 479 96.00 83.20 18.50 7.50 1.15 97<br />
6.4.2 % school provides materials needed to learn sec 480 95.00 79.40 22.20 8.90 1.20 97<br />
6.2.5 m satisfied with courses & materials sec 481 3.90 3.40 0.70 0.30 1.15 97<br />
6.3.2 m teaching strategies meet indiv needs sec 481 4.20 3.80 0.60 0.20 1.11 97<br />
6.5.1 m positive school climate std 687 4.20 3.80 0.70 0.20 1.11 96<br />
6.5.2 m teachers accept responsibility std 687 4.40 4.00 0.60 0.20 1.10 96<br />
6.1.3 % emphasis on other cultures fac 81 43.00 28.00 49.80 10.90 1.54 95<br />
7.5 m district efforts to involve parents fac 82 4.70 4.40 0.40 0.20 1.<strong>07</strong> 95<br />
6.3.1 % my teachers are good teachers std 683 89.00 74.70 30.70 8.30 1.19 95<br />
6.7.2 % participation in professional development fac 82 90.00 67.00 29.90 15.40 1.34 94<br />
6.4.3 m adequacy of computer & tech training fac 82 4.40 3.90 0.70 0.40 1.13 94<br />
6.4.4 m computers & internet a part of teaching fac 82 4.30 3.80 0.60 0.40 1.13 94<br />
6.5.2 m teachers accept responsibility fac 82 4.70 4.40 0.40 0.20 1.<strong>07</strong> 94<br />
6.3.4 % use previous classes info to plan instruct fac 81 91.00 80.50 28.30 8.10 1.13 93<br />
6.2.4 m use dissagregated data--improve perform fac 82 4.20 3.70 0.60 0.40 1.14 93<br />
8.10 % school building is in good condition sec 480 86.00 58.60 34.50 17.80 1.47 93<br />
6.1.1 m curriculum guide use & effectiveness fac 82 4.40 4.10 0.60 0.30 1.<strong>07</strong> 92<br />
6.5.1 m positive school climate fac 82 4.60 4.40 0.40 0.20 1.05 92<br />
6.9.3 % counselor helped create plan for goals sec 480 65.00 46.30 47.90 14.40 1.40 92
MSIP<br />
Standard Indicator description<br />
<strong>Missouri</strong> School Improvement Program 2<br />
MSIP Review AQ Statistical Summary Report 2004-<strong>2005</strong><br />
WEST ST. FRANCOIS CO. R-IV School District<br />
Abbrev.<br />
for AQ<br />
Source N Mean<br />
Ref<br />
Group<br />
Mean<br />
Std<br />
Dev<br />
Ref<br />
Group<br />
Std<br />
Dev<br />
<strong>Missouri</strong> Department of Elementary and Secondary Education<br />
<strong>Prepared</strong> <strong>by</strong> <strong>OSEDA</strong> --- <strong>Print</strong> <strong>date</strong>: <strong>January</strong> <strong>07</strong>, <strong>2005</strong><br />
Dist mean<br />
as a<br />
proportion<br />
of ref<br />
group<br />
mean Percentile<br />
6.3.4 % use performance data to plan instruction fac 82 95.00 84.40 21.70 7.80 1.13 91<br />
6.4.1 m availability of computers, internet & tech fac 82 4.40 4.00 0.60 0.40 1.10 91<br />
6.3.1 % prof dev relates instructional improvement fac 82 99.00 90.10 11.00 6.60 1.10 90<br />
6.6.2 % I feel safe at this school std 684 83.00 69.70 37.30 9.50 1.19 90<br />
6.1.2 m training--classroom assessment strategy fac 82 3.90 3.50 1.00 0.30 1.11 89<br />
6.7.2 m district expects participation in prof dev fac 82 4.70 4.60 0.40 0.10 1.02 89<br />
7.5 % parents know what goes on in school sec 478 75.00 62.50 43.50 10.00 1.20 89<br />
6.1.2 m training--curriculum develop & alignment fac 82 4.50 4.20 0.60 0.30 1.<strong>07</strong> 87<br />
6.1.3 % child taught about other cultures prt 767 76.00 67.90 43.00 7.70 1.12 87<br />
6.5.1 m positive school climate sup 38 4.30 4.10 0.60 0.30 1.05 86<br />
6.1.4 % parents have curriculum input fac 81 69.00 50.00 46.50 18.80 1.38 85<br />
6.1.1 % frequency of curriculum guide use fac 80 78.00 60.70 42.00 18.10 1.29 84<br />
8.2.3 % CSIP has been eval & up<strong>date</strong>d recently fac 82 95.00 78.10 21.70 15.20 1.22 84<br />
6.9.3 % school has helped child set goals prt 761 54.00 47.60 49.90 7.80 1.13 84<br />
6.4.4 % frequency of computer use at school fac 82 76.00 63.30 43.20 13.40 1.20 82<br />
8.10 % school building is in good condition fac 82 96.00 82.40 18.90 15.40 1.17 82<br />
6.9.4 % can talk w counselor about pers problem sec 480 70.00 58.50 45.80 14.40 1.20 82<br />
6.1.3 % teach research skills with instruction fac 79 70.00 62.90 46.30 9.30 1.11 81<br />
8.2.1 % teachers regularly talk about std achieve fac 82 96.00 89.70 18.90 7.20 1.<strong>07</strong> 81<br />
7.3.1 % Vocational education essential in district fac 80 88.00 71.70 33.30 21.60 1.23 80<br />
8.10 % school building is in good condition sup 38 89.00 73.70 31.10 17.50 1.21 80<br />
8.5.2 % have input into budget process fac 82 88.00 77.70 32.90 13.70 1.13 79<br />
8.2.1 % I know what csip expects me to do fac 82 93.00 84.90 26.20 10.20 1.10 78<br />
6.2.2 % building motivates students for MAP prt 767 90.00 86.70 29.50 4.90 1.04 78<br />
6.7.2 m inservice training provided & is useful sup 37 4.10 3.80 0.80 0.40 1.08 78<br />
6.1.4 % students have curriculum input fac 80 53.00 38.70 50.30 18.70 1.37 77<br />
8.3.3 % board sets policies, admin implements sup 38 84.00 71.40 37.00 15.10 1.18 77<br />
8.5.4 % community provides enough money sup 37 84.00 66.10 37.40 19.30 1.27 77<br />
6.6.2 % I feel safe at this school fac 82 99.00 96.10 11.00 3.90 1.03 74<br />
8.10 % school building is in good condition prt 768 83.00 73.10 37.40 15.40 1.14 73<br />
7.3.1 % Vocational education essential in district prt 757 62.00 56.90 48.60 8.70 1.09 73<br />
6.6.2 % child feels safe at this school prt 774 84.00 78.80 36.80 9.80 1.<strong>07</strong> 72
MSIP<br />
Standard Indicator description<br />
<strong>Missouri</strong> School Improvement Program 3<br />
MSIP Review AQ Statistical Summary Report 2004-<strong>2005</strong><br />
WEST ST. FRANCOIS CO. R-IV School District<br />
Abbrev.<br />
for AQ<br />
Source N Mean<br />
Ref<br />
Group<br />
Mean<br />
Std<br />
Dev<br />
Ref<br />
Group<br />
Std<br />
Dev<br />
<strong>Missouri</strong> Department of Elementary and Secondary Education<br />
<strong>Prepared</strong> <strong>by</strong> <strong>OSEDA</strong> --- <strong>Print</strong> <strong>date</strong>: <strong>January</strong> <strong>07</strong>, <strong>2005</strong><br />
Dist mean<br />
as a<br />
proportion<br />
of ref<br />
group<br />
mean Percentile<br />
6.5.2 m teachers accept responsibility prt 779 4.10 4.10 0.60 0.10 1.00 71<br />
8.5.4 % community provides enough money fac 82 77.00 64.00 42.50 19.90 1.20 68<br />
6.5.1 m positive school climate prt 779 3.90 3.90 0.70 0.20 1.00 66<br />
6.6.2 % I feel safe at this school sup 38 92.00 88.40 27.30 10.60 1.04 66<br />
6.3.2 % the way they teach works well for child prt 774 71.00 69.00 45.20 9.70 1.03 63<br />
6.4.1 % child uses computers effectively at schl prt 762 73.00 69.80 44.40 9.30 1.05 63<br />
6.3.1 % child's teachers are good teachers prt 773 82.00 80.10 38.30 7.80 1.02 61<br />
8.2.1 % school has written plan improve achieve prt 764 50.00 48.50 50.00 10.00 1.03 58<br />
6.4.2 % good learning materials at child's school prt 767 78.00 77.30 41.40 8.50 1.01 56<br />
6.2.5 % what is taught meets child's needs prt 769 70.00 69.60 45.60 9.60 1.01 53<br />
7.5 m district efforts to involve parents prt 779 3.90 3.90 0.70 0.20 1.00 53<br />
8.5.4 % community provides enough money prt 766 52.00 53.20 50.00 15.50 0.98 48<br />
6.9.4 % counselor is available to help w problem prt 769 66.00 64.70 47.20 11.20 1.02 47<br />
6.9.4 % individual counseling services available fac 82 91.00 89.10 28.10 10.70 1.02 46<br />
8.7.3 % board listens to parents concerns prt 762 42.00 44.70 49.40 10.20 0.94 44<br />
6.4.1 % computer access at school is important prt 768 91.00 91.90 29.00 2.80 0.99 43<br />
6.4.4 % frequency of computer use at school sec 480 46.00 52.70 49.90 18.20 0.87 40