A Water and Sanitation Needs Assessment for Kumasi, Ghana
A Water and Sanitation Needs Assessment for Kumasi, Ghana
A Water and Sanitation Needs Assessment for Kumasi, Ghana

Create successful ePaper yourself
Turn your PDF publications into a flip-book with our unique Google optimized e-Paper software.
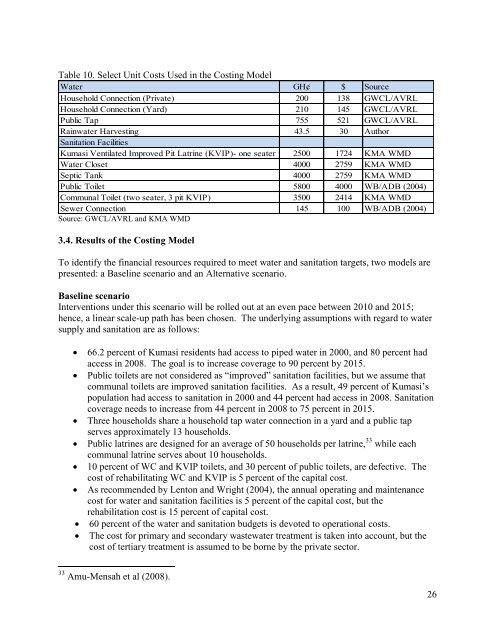
Table 10. Select Unit Costs Used in the Costing Model<br />
<strong>Water</strong> GH¢ $ Source<br />
Household Connection (Private) 200 138 GWCL/AVRL<br />
Household Connection (Yard) 210 145 GWCL/AVRL<br />
Public Tap 755 521 GWCL/AVRL<br />
Rainwater Harvesting 43.5 30 Author<br />
<strong>Sanitation</strong> Facilities<br />
<strong>Kumasi</strong> Ventilated Improved Pit Latrine (KVIP)- one seater 2500 1724 KMA WMD<br />
<strong>Water</strong> Closet 4000 2759 KMA WMD<br />
Septic Tank 4000 2759 KMA WMD<br />
Public Toilet 5800 4000 WB/ADB (2004)<br />
Communal Toilet (two seater, 3 pit KVIP) 3500 2414 KMA WMD<br />
Sewer Connection 145 100 WB/ADB (2004)<br />
Source: GWCL/AVRL <strong>and</strong> KMA WMD<br />
3.4. Results of the Costing Model<br />
To identify the financial resources required to meet water <strong>and</strong> sanitation targets, two models are<br />
presented: a Baseline scenario <strong>and</strong> an Alternative scenario.<br />
Baseline scenario<br />
Interventions under this scenario will be rolled out at an even pace between 2010 <strong>and</strong> 2015;<br />
hence, a linear scale-up path has been chosen. The underlying assumptions with regard to water<br />
supply <strong>and</strong> sanitation are as follows:<br />
66.2 percent of <strong>Kumasi</strong> residents had access to piped water in 2000, <strong>and</strong> 80 percent had<br />
access in 2008. The goal is to increase coverage to 90 percent by 2015.<br />
Public toilets are not considered as ―improved‖ sanitation facilities, but we assume that<br />
communal toilets are improved sanitation facilities. As a result, 49 percent of <strong>Kumasi</strong>’s<br />
population had access to sanitation in 2000 <strong>and</strong> 44 percent had access in 2008. <strong>Sanitation</strong><br />
coverage needs to increase from 44 percent in 2008 to 75 percent in 2015.<br />
Three households share a household tap water connection in a yard <strong>and</strong> a public tap<br />
serves approximately 13 households.<br />
Public latrines are designed <strong>for</strong> an average of 50 households per latrine, 33 while each<br />
communal latrine serves about 10 households.<br />
10 percent of WC <strong>and</strong> KVIP toilets, <strong>and</strong> 30 percent of public toilets, are defective. The<br />
cost of rehabilitating WC <strong>and</strong> KVIP is 5 percent of the capital cost.<br />
As recommended by Lenton <strong>and</strong> Wright (2004), the annual operating <strong>and</strong> maintenance<br />
cost <strong>for</strong> water <strong>and</strong> sanitation facilities is 5 percent of the capital cost, but the<br />
rehabilitation cost is 15 percent of capital cost.<br />
60 percent of the water <strong>and</strong> sanitation budgets is devoted to operational costs.<br />
The cost <strong>for</strong> primary <strong>and</strong> secondary wastewater treatment is taken into account, but the<br />
cost of tertiary treatment is assumed to be borne by the private sector.<br />
33 Amu-Mensah et al (2008).<br />
26