Water and Sanitation Needs Assessment for Blantyre City, Malawi
Water and Sanitation Needs Assessment for Blantyre City, Malawi
Water and Sanitation Needs Assessment for Blantyre City, Malawi

Create successful ePaper yourself
Turn your PDF publications into a flip-book with our unique Google optimized e-Paper software.
MCI SOCIAL SECTOR WORKING PAPER SERIES<br />
N 27/2012<br />
WATER AND SANITATION NEEDS ASSESSMENT FOR BLANTYRE CITY,<br />
MALAWI<br />
Prepared by:<br />
Moumié Maoulidi, PhD<br />
October 2012<br />
475 Riverside Drive, Suite 253, New York, NY, 10115, United States<br />
Phone: +1-870-2767; Fax: +1 212-870-2777<br />
Website: http://mci.ei.columbia.edu
NB: This needs assessment was researched <strong>and</strong> prepared by MCI Associate Director <strong>for</strong><br />
Research, Dr. Moumié Maoulidi, reviewed by MCI Social Sector Specialist in <strong>Blantyre</strong>, Mrs.<br />
Sophie Kalimba <strong>and</strong> edited by MCI Director, Dr. Susan M. Blaustein, <strong>and</strong> MCI Social Sector<br />
Program Associate, Ms. Lorian Wyzinski.<br />
1
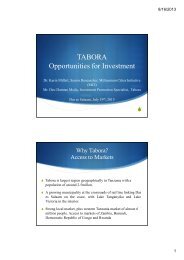
Figure 1. . Map of Ma alawi Showin ng <strong>Blantyre</strong> <strong>City</strong><br />
Source: UN U Cartographi ic Section<br />
2
ACKNOWLEDGEMENTS<br />
<strong>Blantyre</strong> <strong>City</strong> Council<br />
Mr. Emmanuel Ted N<strong>and</strong>olo, Chief Executive Officer, <strong>Blantyre</strong> <strong>City</strong> Council<br />
Mr. Costly Chanza, Director of Urban Planning, <strong>Blantyre</strong> <strong>City</strong> Council<br />
Dr. Emmanuel Kanjunjunju, Director, Health Services<br />
Mr. Felix Khembo, Monitoring <strong>and</strong> Evaluation Officer<br />
<strong>Blantyre</strong> <strong>Water</strong> Board<br />
Charles A.S. Msusa, Chief Accountant<br />
Andrew Masiye, Planning <strong>and</strong> Business Development Manager<br />
UN-HABITAT<br />
Mr. John Chome, UN-HABITAT, Lilongwe, <strong>Malawi</strong>.<br />
<strong>Water</strong> For People<br />
Mrs. Kate Harawa, Country Director<br />
Mr. Muthi Nhlema, Grants Manager<br />
Village Hygiene Project<br />
Mr. Roy Khonyongwa, Executive Director<br />
A special thank you to Mrs. Sophie Kalimba, <strong>for</strong> her indefatigable ef<strong>for</strong>ts <strong>and</strong> commitment to the<br />
<strong>City</strong> of <strong>Blantyre</strong> <strong>and</strong> to MCI.<br />
3
TABLE OF CONTENTS<br />
ACKNOWLEDGEMENTS ............................................................................................................ 3<br />
EXECUTIVE SUMMARY ............................................................................................................ 7<br />
I. INTRODUCTION ....................................................................................................................... 9<br />
1.1. Objectives ......................................................................................................................... 9<br />
1.2. Methodology .................................................................................................................... 9<br />
1.3. Limitations ....................................................................................................................... 9<br />
1.4. Demographics................................................................................................................... 9<br />
II. BLANTYRE’S WATER AND SANITATION SYSTEM ...................................................... 11<br />
2.1. Topography .................................................................................................................... 11<br />
2.2. <strong>Blantyre</strong>’s <strong>Water</strong> Supply System ................................................................................... 12<br />
2.3. Access to <strong>Water</strong> in <strong>Blantyre</strong> ........................................................................................... 15<br />
2.4. <strong>Blantyre</strong>’s <strong>Sanitation</strong> System ......................................................................................... 19<br />
2.5. Access to <strong>Sanitation</strong> in <strong>Blantyre</strong> .................................................................................... 24<br />
2.6. Hygiene Education ......................................................................................................... 25<br />
2.7. Access to <strong>Water</strong> <strong>and</strong> <strong>Sanitation</strong> in Schools <strong>and</strong> Hospitals ............................................. 26<br />
III. FINANCING WATER AND SANITATION IN BLANTYRE ............................................. 26<br />
3.1. Financing <strong>Water</strong> <strong>and</strong> <strong>Sanitation</strong> ..................................................................................... 28<br />
3.2. Costing Model ................................................................................................................ 29<br />
3.3. Results of the Costing Model ......................................................................................... 30<br />
IV. CONCLUSION AND RECOMMENDATIONS ................................................................... 33<br />
REFERENCES ............................................................................................................................. 36<br />
APPENDIX ................................................................................................................................... 38<br />
4
LIST OF TABLES<br />
Table 1. <strong>Blantyre</strong> <strong>City</strong> Population by Area (left) <strong>and</strong> List of LIAs (right) ................................... 10<br />
Table 2. <strong>Water</strong> Production <strong>and</strong> Sales Figures (2004-2009) .......................................................... 15<br />
Table 3. UN JMP’s Definition of Improved <strong>and</strong> Unimproved <strong>Water</strong> Sources ............................. 15<br />
Table 4. Daily per Capita Consumption <strong>and</strong> Expenditure on <strong>Water</strong>, by Location ....................... 16<br />
Table 5. Distribution of Improved <strong>Water</strong> Points by Type in Low Income Areas ........................ 17<br />
Table 6. Metered <strong>Water</strong> Charges <strong>and</strong> <strong>Water</strong> Losses (2004-2009) ................................................ 19<br />
Table 7. 2010 Solid Waste Equipment List .................................................................................. 21<br />
Table 8. Types of Latrines Used in <strong>Blantyre</strong> ................................................................................ 24<br />
Table 9. Definition of Improved <strong>and</strong> Unimproved <strong>Sanitation</strong> Facilities ...................................... 25<br />
Table 10. Ministry of Finance IWSS Budget Estimates 2011-2014 ............................................. 27<br />
Table 11. Tariff Structure <strong>for</strong> Domestic, Commercial <strong>and</strong> Industrial Facilities (Aug. 2012) ...... 27<br />
Table 12. Budgets <strong>Blantyre</strong> <strong>Water</strong> Board Compared to Other <strong>Water</strong> Boards (2004-2009) ......... 28<br />
Table 13. Department of Cleansing Services <strong>and</strong> Sewerage Income (2007-2010) ...................... 28<br />
Table 14. Select Unit Costs Used in the Costing Model ............................................................... 30<br />
Table 15. Baseline Scenario Model Results ................................................................................. 32<br />
Table 16. Alternative Scenario Model Results ............................................................................. 33<br />
LIST OF FIGURES<br />
Figure 1. Map of <strong>Malawi</strong> Showing <strong>Blantyre</strong> <strong>City</strong> .......................................................................... 2<br />
Figure 2. <strong>Blantyre</strong> <strong>City</strong> Administrative Areas <strong>and</strong> Surface <strong>Water</strong> Sources .................................... 8<br />
Figure 3. Population Growth in <strong>Blantyre</strong> <strong>City</strong> (1966-2015) ......................................................... 10<br />
Figure 4. <strong>Blantyre</strong> Topography ..................................................................................................... 12<br />
Figure 5. <strong>Blantyre</strong> <strong>Water</strong> Treatment Plants <strong>and</strong> <strong>Water</strong> Board Supply Area ................................. 13<br />
Figure 6. <strong>Water</strong> Transmission System .......................................................................................... 14<br />
Figure 7. Distribution of Consumption by Customer Category (2010) ........................................ 16<br />
Figure 8. In<strong>for</strong>mal Dumpsite in Ndir<strong>and</strong>e ..................................................................................... 21<br />
Figure 9. <strong>Blantyre</strong> Sewer Catchment Areas <strong>and</strong> Wastewater Treatment Works .......................... 23<br />
Figure 10. A Functioning (left) <strong>and</strong> Non-Functioning (right) Wastewater Treatment Plant ........ 24<br />
5
ABBREVIATIONS<br />
AfDB African Development Bank<br />
BCC <strong>Blantyre</strong> <strong>City</strong> Council<br />
EIB European Investment Bank<br />
EU-EIB European Union - European Investment Bank<br />
FLOW Field Level Operations Watch<br />
GoM Government of <strong>Malawi</strong><br />
IHS Integrated Household Survey<br />
IWSS Irrigation, <strong>Water</strong> <strong>and</strong> <strong>Sanitation</strong> Sector<br />
LIA Low-Income Areas<br />
MCI Millennium Cities Initiative<br />
MDG Millennium Development Goals<br />
MEPD Ministry of Economic Planning <strong>and</strong> Development<br />
MGDS <strong>Malawi</strong> Growth <strong>and</strong> Development Strategy<br />
MICS Multiple Indicator Cluster Survey<br />
MIW Medical <strong>and</strong> Infectious Waste<br />
MIWD Ministry of Irrigation <strong>and</strong> <strong>Water</strong> Development<br />
MK <strong>Malawi</strong> Kwacha (currency)<br />
MoF Ministry of Finance<br />
NGO Non-Governmental Organization<br />
NRW Non Revenue <strong>Water</strong><br />
NSO National Statistics Office<br />
NSP National <strong>Sanitation</strong> Policy<br />
NWDP I First National <strong>Water</strong> Development Programme<br />
NWDP II Second National <strong>Water</strong> Development Programme<br />
PPP Public-Private Partnerships<br />
SADC South African Development Community<br />
SWAp Sector Wide Approach<br />
THAs Traditional Housing Areas<br />
UFW Unaccounted For <strong>Water</strong><br />
UN-HABITAT United Nations Human Settlements Programme<br />
UNICEF United Nations Children’s Fund<br />
VIP Ventilated Improved Pit Latrine<br />
WASH <strong>Water</strong>, <strong>Sanitation</strong> <strong>and</strong> Hygiene<br />
W4P <strong>Water</strong> <strong>for</strong> People<br />
WMS Welfare Monitoring Survey<br />
WUA <strong>Water</strong> Users Association<br />
6
EXECUTIVE SUMMARY<br />
<strong>Malawi</strong> is a country endowed with a large network of surface water bodies, including Lake<br />
<strong>Malawi</strong> (28,750 km 2 ), Lake Malombe (303 km 2 ), Lake Chilwa (683 km 2 ) <strong>and</strong> numerous rivers.<br />
Yet, the <strong>Blantyre</strong> <strong>Water</strong> Board (BWB) has been struggling to provide regular water supply to the<br />
residents of the country’s commercial capital, <strong>Blantyre</strong>, mainly because rapid population growth<br />
is outstripping supply. The city of <strong>Blantyre</strong> relies on two extraction <strong>and</strong> treatment plants <strong>for</strong><br />
water supply, Walker’s Ferry <strong>and</strong> Mudi Dam, but these two plants were designed to produce<br />
water <strong>for</strong> a much smaller population than the estimated 2012 population of 783,296 people.<br />
An important challenge facing the BWB is that, because of <strong>Blantyre</strong>’s higher geographical<br />
location <strong>and</strong> distance from the main source of water, the Shire River, producing water is costly.<br />
<strong>Water</strong> has to be pumped vertically over a great distance <strong>and</strong> at considerable cost. Operational<br />
inefficiencies also help explain erratic water supply. BWB annual reports indicate that almost<br />
half of the produced water is lost due to leakages, illegal connections <strong>and</strong> v<strong>and</strong>alism.<br />
Dilapidated infrastructure <strong>and</strong> malfunctioning electrical/mechanical equipment are additional<br />
factors contributing to the irregular provision of water. The two water extraction <strong>and</strong> treatment<br />
plants are in need of major rehabilitation, <strong>and</strong> the costs required to repair the equipment are<br />
astronomical. The cash-strapped BWB has not been able to generate the required financial<br />
resources to overhaul <strong>and</strong> replace the water supply infrastructure. Recently, the Government of<br />
<strong>Malawi</strong> <strong>and</strong> international development partners have contributed to the rehabilitation of<br />
infrastructure by financing projects such as the Peri-Urban <strong>Water</strong> Supply Project <strong>and</strong> the Second<br />
National <strong>Water</strong> Development Programme (NWDP II).<br />
<strong>Water</strong> supply shortages are more prevalent in high-density unplanned residential areas (where<br />
most low-income communities reside) than in low-density, high-income areas. In low-income<br />
areas, unreliable water supply is leading some residents to rely on unimproved sources of water<br />
such as shallow wells, streams <strong>and</strong> drainage ditches—with their attendant health <strong>and</strong> safety risks.<br />
There is an urgent need to ensure that these areas receive piped water, either by increasing the<br />
number of water kiosks or by extending the pipeline network.<br />
The city also faces several acute sanitation challenges: solid waste collection is grossly<br />
inadequate, with only 30 percent of the population having access; the sewer system coverage is<br />
very limited, as only one-tenth of the population is connected to the sewer; <strong>and</strong> rivers are being<br />
polluted by effluent as well as by untreated domestic <strong>and</strong> industrial wastewater. Many people<br />
rely on pit latrines <strong>and</strong> septic tanks that fill up quickly because they are shared with extended<br />
family members <strong>and</strong> neighbors. <strong>Sanitation</strong> is particularly problematic in low-income areas<br />
where pit latrine <strong>and</strong> septic tank emptying services have until recently been irregular. The<br />
introduction of some promising new pumping technologies is alleviating this situation.<br />
This needs assessment finds that with an annual per capita investment of $16 between 2013 <strong>and</strong><br />
2015, <strong>Blantyre</strong> <strong>City</strong> can achieve the Millennium Development Goal targets <strong>for</strong> water <strong>and</strong><br />
sanitation. The report is structured as follows: the first <strong>and</strong> second sections describe the main<br />
water <strong>and</strong> sanitation challenges; the third section addresses the financing of water <strong>and</strong> sanitation<br />
in <strong>Blantyre</strong> <strong>and</strong> presents the results of the costing model, <strong>and</strong> the fourth section concludes <strong>and</strong><br />
presents some recommendations.<br />
7
Figure 2. <strong>Blantyre</strong> <strong>City</strong> Administrative Areas <strong>and</strong> Surface <strong>Water</strong> Sources<br />
8
I. INTRODUCTION<br />
<strong>Blantyre</strong> <strong>City</strong> is the second largest urban center in <strong>Malawi</strong> <strong>and</strong> is located 311 kilometers (km)<br />
southeast of the national capital, Lilongwe. 1 Situated at an altitude of approximately 1,150<br />
meters (m) above sea level, the city covers an area of over 220 square kilometers (sq. km). 2 It is<br />
the capital of <strong>Malawi</strong>’s Southern Region as well as of <strong>Blantyre</strong> District. Key water <strong>and</strong> sanitation<br />
problems facing <strong>Blantyre</strong> residents include frequent water supply disruptions, irregular solid<br />
waste collection, indiscriminate liquid waste disposal <strong>and</strong> inadequate sewerage treatment.<br />
1.1. Objectives<br />
The main objective of this needs assessment is to identify the main water <strong>and</strong> sanitation<br />
challenges facing the city of <strong>Blantyre</strong> in its ef<strong>for</strong>ts to achieve Target 7C (<strong>for</strong>merly Target 10) of<br />
Millennium Development Goal #7 – to cut in half by 2015 the proportion of people without<br />
access to safe water <strong>and</strong> basic sanitation. Moreover, it suggests specific interventions that can<br />
improve water, sanitation <strong>and</strong> hygiene conditions <strong>and</strong> estimates their associated costs, in order to<br />
enable local, regional <strong>and</strong> national governments <strong>and</strong> development partners to plan accordingly.<br />
1.2. Methodology<br />
The research methodology used in this study includes field research, a desk review <strong>and</strong> site<br />
visits. The field research <strong>and</strong> site visits were conducted in 2010 <strong>and</strong> 2011 by MCI’s Social<br />
Sector Specialist in <strong>Blantyre</strong> <strong>and</strong> MCI’s Associate Director <strong>for</strong> Research. Data <strong>and</strong> in<strong>for</strong>mation<br />
used in this report were obtained from representatives of various agencies in <strong>Blantyre</strong>, including:<br />
the Ministry of Irrigation <strong>and</strong> <strong>Water</strong> Development (MIWD), the National Statistical Office<br />
(NSO), as well as secondary sources.<br />
1.3. Limitations<br />
A key challenge faced while conducting this assessment was that official government statistics<br />
relating to water <strong>and</strong> sanitation coverage are incongruous with secondary sources as well as<br />
surveys such as the demographic <strong>and</strong> health surveys (DHS) <strong>and</strong> multiple indicator cluster<br />
surveys (MICS). Some organizations, such as <strong>Water</strong> <strong>for</strong> People (W4P), argue that official<br />
government statistics overestimate the proportion of people with access to improved water<br />
sources <strong>and</strong> sanitation because they do not use the same definitions as international<br />
organizations. 3 Whenever discussing the MDGs, international definitions <strong>and</strong> indicators, rather<br />
than government definitions <strong>and</strong> statistics, are used in this study.<br />
1.4. Demographics<br />
The 2008 Census showed that <strong>Blantyre</strong> <strong>City</strong> had a population of 661,256 inhabitants (NSO,<br />
2008). Assuming a growth rate of four percent per year, the estimated 2012 population is<br />
1 <strong>Blantyre</strong> is one of four urban areas in <strong>Malawi</strong>; the others are Lilongwe, Zomba, <strong>and</strong> Mzuzu. The city was founded<br />
by Scottish Missionaries in 1870 <strong>and</strong> is named after the Scottish town where Dr. David Livingstone was born.<br />
2 <strong>Malawi</strong> is divided into three regions (Northern, Central <strong>and</strong> Southern) <strong>and</strong> 28 districts.<br />
3 http://www.water<strong>for</strong>people.org/programs/africa/malawi.html.<br />
9
783,296, <strong>and</strong> the projected 2015 population is 884,497. High fertility rates <strong>and</strong> in-migration<br />
explain this expected population increase <strong>and</strong> raise concerns about whether the existing urban<br />
infrastructure can sustain the rapid population growth. It should be noted, however, that the city’s<br />
daytime population soars to approximately one million, because people from surrounding areas<br />
travel to the city during the day. This puts tremendous pressure on <strong>Blantyre</strong> <strong>City</strong> Council’s<br />
(BCC’s) ability to provide adequate water <strong>and</strong> sanitation services.<br />
Figure 3. Population Growth in <strong>Blantyre</strong> <strong>City</strong> (1966-2015)<br />
Population<br />
1,000,000<br />
900,000<br />
800,000<br />
700,000<br />
600,000<br />
500,000<br />
400,000<br />
300,000<br />
200,000<br />
100,000<br />
0<br />
Source: NSO <strong>and</strong> MCI projections<br />
1966 1987 1998 2008 2011 Proj. 2015<br />
<strong>Malawi</strong> is one of the most densely populated countries in Africa, with a population density of<br />
158.3 people per square kilometer (people per sq. km); although <strong>Blantyre</strong> <strong>City</strong> is not <strong>Malawi</strong>’s<br />
largest city in terms of population, it has the highest population density in the country, with<br />
3,269 people per sq. km. 4<br />
About 70 percent of the city’s population lives in 21 low-income areas (LIA), some of which are<br />
unplanned (Muwamba, 2010). 5 These unplanned areas are locations that have developed without<br />
following building regulations <strong>and</strong> where housing construction <strong>and</strong> selling of l<strong>and</strong> is<br />
uncontrolled. There are more than a dozen such unplanned areas, with Ndir<strong>and</strong>e having the<br />
highest population, <strong>and</strong> they occupy about 25 percent of the l<strong>and</strong> in the city (UN-HABITAT,<br />
2011). Table 1 shows the distribution of the city’s population by administrative area <strong>and</strong> lists the<br />
names of the main low-income areas.<br />
Table 1. <strong>Blantyre</strong> <strong>City</strong> Population by Area (left) <strong>and</strong> List of LIAs (right)<br />
Area in <strong>Blantyre</strong> Population Area in <strong>Blantyre</strong> Population<br />
Low-Income Areas (LIA)<br />
Michiru Ward 46,639 Chichiri Ward 5,452 Kameza Manase<br />
South Lunzu Ward 37,864 Mzedi Ward 13,333 Machinjiri Chatha<br />
Mapanga Ward 23,854 Bangwe Ward 34,773 Mapanga Naotcha<br />
Nkolokoti Ward 35,218 Namiyango Ward 18,761 Chilomoni(Mulunguzi) Soche<br />
Ndir<strong>and</strong>e Norh Ward 29,033 Limbe East Ward 38,512 Mbayani/CheMussa Chiwembe Village<br />
Ndir<strong>and</strong>e South Ward 64,602 Limbe Central Ward 2,960 Ndir<strong>and</strong>e (Safarao, Misesa<br />
Ndir<strong>and</strong>e West Ward 15,529 Limbe west Ward 13,877 Makata, Zambia, BCA (Mavuto Branch)<br />
Nyambadwe Ward 8,304 Soche East Ward 14,887 Chrimba)<br />
Bangwe/Namiyango<br />
Likhubula Ward 51,853 Soche West Ward 50,617 Kachere, Chigumula<br />
Chilomoni Ward 37,690 Nancholi Ward 25,109 Mzedi<br />
<strong>Blantyre</strong> West Ward 22,901 Misesa 31,212 Manyowe<br />
<strong>Blantyre</strong> Central Ward 4,808 Chigumula Ward 23,352<br />
<strong>Blantyre</strong> East Ward 5,786 Msamba Ward 4,330<br />
4 In the 1998 Census, <strong>Blantyre</strong>’s population was 646,235, even as Lilongwe’s was only 440,471. A decade later, in<br />
2008, <strong>Blantyre</strong>’s population was 661,256, but Lilongwe’s population was 674,448.<br />
5 A few planned areas are also low-income.<br />
10
II. BLANTYRE’S WATER AND SANITATION SYSTEM<br />
Institutional Framework<br />
Key policy documents defining the country’s water <strong>and</strong> sanitation strategy include the First <strong>and</strong><br />
Second Phases of <strong>Malawi</strong> Growth <strong>and</strong> Development Strategy [MGDS I & II], the 2008 National<br />
<strong>Sanitation</strong> Policy [NSP], the 2005 National <strong>Water</strong> Policy <strong>and</strong> the 1996 National Environmental<br />
Policy [NEP]. The NSP assigned local governments sanitation responsibilities, <strong>and</strong> the NEP<br />
called <strong>for</strong> better management of the environment <strong>and</strong> natural resources. The objectives of MGDS<br />
include ensuring that all people shall have access to potable water <strong>and</strong> adequate sanitation<br />
services <strong>and</strong> reducing incidences of water related diseases. To attain MGDS objectives, the<br />
Government of <strong>Malawi</strong> (GoM) initiated the first <strong>and</strong> second phases of the National <strong>Water</strong><br />
Development Programme (NWDP I & II). Funded by the World Bank, NWDP I (1996-2003)<br />
focused on the water sub-sector <strong>and</strong> advocated <strong>for</strong> the separation of policy-making<br />
responsibilities from the service delivery function. NWDP II (2007-2012) is a sector-wide<br />
approach (SWAp) seeking to increase water production, improve operational efficiency <strong>and</strong><br />
ensure that low-income communities have access to water supply <strong>and</strong> sanitation services.<br />
However, sanitation was initially barely mentioned in NWDP II, which is supported by the<br />
World Bank, the European Union (EU) <strong>and</strong> the African Development Bank (AfDB). This is<br />
relevant to note because, until recently, the GoM has not accorded sanitation the importance it<br />
deserves.<br />
At the national level, the Ministry of Irrigation <strong>and</strong> <strong>Water</strong> Development (MIWD) <strong>for</strong>mulates <strong>and</strong><br />
administers water policy <strong>and</strong> st<strong>and</strong>ards <strong>and</strong> grants licenses <strong>for</strong> water extraction rights. A Draft<br />
National Ten Year <strong>Sanitation</strong> <strong>and</strong> Hygiene Masterplan prepared by the GoM states that the<br />
sanitation sub-sector will also be under the MIWD. At the sub-national level, local governments<br />
are responsible <strong>for</strong> planning <strong>and</strong> coordinating water <strong>and</strong> sanitation programs within their<br />
boundaries. For instance, in <strong>Blantyre</strong>, BWB, an independent entity, is charge of water supply,<br />
while on-site sanitation (pit latrines <strong>and</strong> septic tanks), the sewer system <strong>and</strong> waste management<br />
services are managed by BCC. 6 The GoM <strong>and</strong> BCC have also actively encouraged Public-Private<br />
Partnerships (PPP) in the provision of sanitation services, as well as the supply <strong>and</strong> management<br />
of water in low-income areas (Chirwa <strong>and</strong> Jungwe, 2007; UN-HABITAT, 2011).<br />
2.1. Topography<br />
<strong>Blantyre</strong> is a city with many hills <strong>and</strong> valleys, as well as rugged terrain. The hills are between<br />
780 <strong>and</strong> 1,612 m above sea level, <strong>and</strong> many streams originate from these hills <strong>and</strong> flow into the<br />
city. As Figure 4 shows, the topography is also varied <strong>and</strong> includes relatively flat areas. This<br />
l<strong>and</strong>scape presents a unique problem because the water extraction point is situated at Walker’s<br />
Ferry, 48 km from the city, <strong>and</strong> there is a 780m-altitude difference between <strong>Blantyre</strong> <strong>and</strong><br />
Walker’s Ferry. Consequently, water has to be pumped vertically over a great distance, <strong>and</strong> at<br />
considerable cost. In addition to hills <strong>and</strong> valleys, the terrain in areas such as Mbayani is rocky,<br />
making it difficult to build pit latrines deeper than three meters. <strong>Blantyre</strong> <strong>City</strong> also has three<br />
main soil types, with major implications <strong>for</strong> sanitation. Most areas in the city have dark grey or<br />
6 The BCC comes under the Ministry of Local Government <strong>and</strong> Rural Development. As stipulated in the Local<br />
Government Act (1998), the city is managed by elected councilors <strong>and</strong> a mayor, but day-to-day operations are<br />
managed by the <strong>Blantyre</strong> Chief Executive Officer (CEO).<br />
11
eddish brown clay loam soil, but areas near rivers <strong>and</strong> streams have soils made up of clayey<br />
alluvium deposits, while hilly areas consist of s<strong>and</strong>y soils (Matope, 2000). Septic tanks are well<br />
suited to this type of soil because it is permeable.<br />
Figure 4. <strong>Blantyre</strong> Topography<br />
Source: Costly Chanza, BCC (2011)<br />
There are a number of river catchment areas in <strong>Blantyre</strong> (Figure 4) that <strong>for</strong>m a natural drainage<br />
system with distinct hydrological catchment areas, namely, Likhubula, Chirimba, Matabi, Lunzu<br />
<strong>and</strong> Mombezi, which drain the northern part of the city, <strong>and</strong> Mudi, Nasolo, Naperi, Limbe <strong>and</strong><br />
Luchenza, draining the middle <strong>and</strong> southern parts. The sewerage catchment areas are Limbe,<br />
Soche, <strong>Blantyre</strong> <strong>and</strong> Chirimba (which includes Likhubula <strong>and</strong> Matabi catchment areas). In<br />
addition, there are Mudi, Limbe <strong>and</strong> Naperi sewerage catchment areas. Four of these sewerage<br />
catchment areas are operational (Chirimba, Mudi, Naperi <strong>and</strong> Limbe), <strong>and</strong> four are proposed<br />
(Luchenza, Mombezi, Chisombezi <strong>and</strong> Lunzu). Section 2.4 discusses sanitation in more detail.<br />
2.2. <strong>Blantyre</strong>’s <strong>Water</strong> Supply System<br />
<strong>Blantyre</strong> <strong>City</strong> derives most of its piped water supply from the Shire River (an outlet of Lake<br />
<strong>Malawi</strong>), located 48 km away. The water is abstracted <strong>and</strong> treated at a plant called Walker’s<br />
Ferry, as well as at Mudi Dam, which located is within the city. The Mudi Treatment Plant was<br />
initially designed to serve the old townships of <strong>Blantyre</strong> <strong>and</strong> Limbe. As the town of<br />
<strong>Blantyre</strong>/Limbe began to grow, <strong>and</strong> the dem<strong>and</strong> <strong>for</strong> water increased in the 1960s, Walker’s Ferry<br />
12
Treatment Plant was commissioned. Built in 1963, Walker’s Ferry was upgraded in 1996, but<br />
most of the equipment is now being replaced because it is archaic. It is estimated that about 90<br />
percent of the water currently used in <strong>Blantyre</strong> is derived from Walker’s Ferry, <strong>and</strong> 10 percent is<br />
extracted from the Mudi Dam (BWB, 2011).<br />
The BWB, a water utility organization operated by the government of <strong>Malawi</strong>, is responsible <strong>for</strong><br />
abstracting, treating <strong>and</strong> selling potable water not only to the city, but also to surrounding periurban<br />
areas. 7 As a result, BWB services approximately one million people, a population much<br />
higher than the number of people living in the city (BWB, 2008). BWB extracts water from<br />
Shire River <strong>and</strong> treats it at Walker’s Ferry. 8 The same water treatment process also takes place at<br />
Mudi Treatment Works, where water is extracted from an artificial dam. Figure 5 shows the<br />
locations of the water plants, some key pumping stations <strong>and</strong> the areas where BWB supplies<br />
potable water.<br />
Figure 5. <strong>Blantyre</strong> <strong>Water</strong> Treatment Plants <strong>and</strong> <strong>Water</strong> Board Supply Area<br />
Source: (EU&EIB, 2008)<br />
7 BWB is a quasi-governmental organization established under the <strong>Malawi</strong> <strong>Water</strong> Works Act No. 17 of 1995 to<br />
supply water to <strong>Blantyre</strong> <strong>City</strong> <strong>and</strong> the surrounding areas of Chileka Village, Chiradzulu (part), Lumbira Estate,<br />
Lunzu <strong>and</strong> Nkula Falls.<br />
8 The water treatment process involves coagulation, flocculation, sedimentation, filtration <strong>and</strong> disinfection.<br />
13
Figure 6 shows the water w transmi ission system m in Blantyrre.<br />
As can be<br />
seen, raw wwater<br />
is<br />
extracted d from the Sh hire River an nd treated at Walker’s Feerry.<br />
It is thhen<br />
pumped in a first stagge<br />
to<br />
the Chile eka pumping g station (inte ermediate pu umping statiion)<br />
<strong>and</strong> in a second stagge<br />
to differennt<br />
reservoir rs in town, be e<strong>for</strong>e being distributed. d<br />
Figure 6. . <strong>Water</strong> Tran nsmission Sy ystem<br />
Given Bl lantyre’s hill ly terrain, th he distributio on system inccludes<br />
eight booster pummping<br />
stationns<br />
<strong>and</strong> 13 re eservoirs (EU U&EIB, 200 08).<br />
14
The daily production capacity of BWB is 86,000,000 liters (78,000,000 liters at Walker's Ferry<br />
<strong>and</strong> 8,000,000 liters at Mudi Dam), but the daily dem<strong>and</strong> <strong>for</strong> the growing population of <strong>Blantyre</strong><br />
<strong>and</strong> surrounding areas is at 96,000,000 liters. 9 Clearly, water production is not sufficient to meet<br />
the total consumption. Walker’s Ferry has a capacity to produce 108,000,000 liters per day, <strong>and</strong><br />
BWB expects that the total production capacity will increase to 105,000,000 liters by 2013<br />
(BWB, 2011). Table 2 shows water production between 2004 <strong>and</strong> 2009.<br />
Table 2. <strong>Water</strong> Production <strong>and</strong> Sales Figures (2004-2009)<br />
2004/05 2005/6 2006/07 2007/08 2008/09 2009/10<br />
Average Daily Output ('000 liters) 77,000,000 79,410,000<br />
79,556,000 82,000,000 83,100,000<br />
Average Daily Output (m /day) 77,000 79,410 - 79,556 82,000 83,100<br />
Industrial Consumption (mn m ) 22 NA 23 26 NA NA<br />
Meters in Service (number) 35,000 28,388 25,744 34,101 36,009 37,174<br />
Metered <strong>Water</strong> Charges (MK '000)<br />
Source: NSO (2010)<br />
984,000 1,006,511 1,171,686 1,453,154 1,576,383 1,889,684<br />
<strong>Water</strong> shortages are widespread, particularly when pumps break down or cannot function<br />
because of electricity outages <strong>and</strong> during the dry season in <strong>Blantyre</strong> (September through<br />
November). Between 2001 <strong>and</strong> 2010, <strong>Blantyre</strong> received about 995 millimeters of rainfall every<br />
year; yet rainwater harvesting has not been widely practiced (NSO, 2010; Ng’ong’ola et al.,<br />
2010). 10 Some schools collect rainwater to supplement BWB water, improve sanitation <strong>and</strong><br />
cultivate vegetables <strong>for</strong> commercial purposes. To encourage such activities, the Ministry of<br />
Education, the University of <strong>Malawi</strong>, the Rainwater Harvesting Association <strong>and</strong> the <strong>Malawi</strong><br />
Industrial Research <strong>and</strong> Technology Development Center have proposed a $1.2 million (MK 342<br />
million) project to improve rainwater harvesting in schools. 11<br />
2.3. Access to <strong>Water</strong> in <strong>Blantyre</strong><br />
Different surveys, such as the 2006 Multiple Indicator Cluster Survey (MICS), the 2005 Second<br />
Integrated Household Survey (IHS 2) <strong>and</strong> the 2009 Welfare Monitoring Survey (WMS), have<br />
used slightly different criteria to define access to improved water sources. For instance, the 2009<br />
WMS considers boreholes, communal st<strong>and</strong>pipes, protected wells <strong>and</strong> tap water (piped into<br />
dwelling unit or compound) to be “safe /improved water sources.” 12 Rainwater harvesting is not<br />
included. The UN’s Joint Monitoring Programme (JMP) defines access to improved water as<br />
shown in Table 3.<br />
Table 3. UN JMP’s Definition of Improved <strong>and</strong> Unimproved <strong>Water</strong> Sources<br />
Improved <strong>Water</strong> Supply Source Unimproved <strong>Water</strong> Supply Source<br />
Individual household connection Tanker truck provided water<br />
Piped water from a yard tap Vendor provided water<br />
Piped water obtained from a neighbor Unprotected well/spring<br />
Protected well/spring Bottled water<br />
Rain water harvesting<br />
Source: http://www.wssinfo.org/definitions/infrastructure.html<br />
9<br />
Kamanga (2009) <strong>and</strong> BWB website (http://www.bwb.mw/index.php).<br />
10<br />
For a table on average rainfall per month, see Appendix 1.<br />
11<br />
USD $1 = MK 280.<br />
12<br />
Note: BWB does not include boreholes or protected wells as safe water sources.<br />
15
Using this UN JMP definition, <strong>and</strong> results from a recent baseline survey by Ng’ong’ola et al.<br />
(2010), clean potable water is accessible to about 61 percent of the city’s population. This<br />
implies that about two out of five people are using water from sources such as wells, rivers <strong>and</strong><br />
streams. BWB, on the other h<strong>and</strong>, estimates that 75 percent of people have access to potable<br />
water, while the 2009 WMS proposes that 90 percent has access (UN-HABITAT, 2011).<br />
It is also relevant to note that water consumption varies depending on location. According to<br />
Ng’ong’ola at al. (2010), average water consumption per person per day in <strong>Blantyre</strong> in 2010 was<br />
152.2 liters, which is below the 160 liters per capita international consumption st<strong>and</strong>ard; but as<br />
Table 4 shows people living in high density areas consumed only 87 to 130 liters per day (Ibid).<br />
Table 4. Daily per Capita Consumption <strong>and</strong> Expenditure on <strong>Water</strong>, by Location<br />
High-Density High-Density<br />
Per capita water consumption Unplanned Planned Medium-Density Low-Density Overall<br />
Mean Daily Consumption (in liters) 86.5 130.4 174.8 352.1 152.2<br />
Max Daily Consumption (in liters) 1196.8 549.5 978.6 2446.1 3329.1<br />
Min Daily Consumption (in liters) 1.4 18.4 2.2 18 1.4<br />
Daily expenditure on water (MK/day)<br />
Source: Ng’ong’ola et al. (2010)<br />
47 87 87 156<br />
BWB categorizes tap water customers into four groups: domestic; industrial; institutional; <strong>and</strong><br />
commercial customers. Figure 7 shows the distribution of consumption by customer category in<br />
2010.<br />
Figure 7. Distribution of Consumption by Customer Category (2010)<br />
51%<br />
4% 7%<br />
23%<br />
Source: 2010 BWB Annual Report<br />
15%<br />
Kiosk<br />
Industrial<br />
Commercial<br />
Institutions<br />
Domestic<br />
In 2011, BWB recorded 1,502 new connections, as compared to 1,370 new connections in 2010,<br />
an increase of 9.6 percent <strong>and</strong> an indication that more households <strong>and</strong> businesses have access to<br />
potable water.<br />
Although some people living in in<strong>for</strong>mal settlements as well as in unplanned <strong>and</strong> traditional<br />
housing areas (THAs) have access to potable water, most low-income area (LIA) residents rely<br />
on improved as well as unimproved sources of water, such as rivers, streams <strong>and</strong> h<strong>and</strong>-dug wells.<br />
The 2008 Census results revealed that during the dry <strong>and</strong> wet seasons, on average, 28 percent of<br />
<strong>Blantyre</strong> <strong>City</strong> residents relied on piped water, 55 percent depended on st<strong>and</strong>pipes, 11.3 percent<br />
on protected wells as boreholes <strong>and</strong> 5.7 percent on unimproved sources such as rivers. However,<br />
almost half of slum dwellers relied on water kiosks, 13 percent acquired water from st<strong>and</strong>pipes,<br />
16
11 percent had piped water at home <strong>and</strong> the rest used unprotected sources (NSO, 2009). A<br />
recent community water mapping exercise conducted by <strong>Water</strong> <strong>for</strong> People (W4P) confirms that<br />
kiosks are the most common source of improved water <strong>for</strong> households in about half of the LIAs,<br />
as shown in Table 5. BWB authorities report that there are approximately 424 water kiosks in<br />
<strong>Blantyre</strong> <strong>City</strong>. However, low-income areas such as Chigumula, Chiwembe, Kameza, Manase,<br />
Mapanga, Misesa/Chensomba, Mzedi, Soche <strong>and</strong> Nancholi have fewer kiosks than boreholes <strong>and</strong><br />
protected springs or wells. It is not uncommon to see residents in these areas washing clothes<br />
<strong>and</strong> bathing in polluted rivers.<br />
Table 5. Distribution of Improved <strong>Water</strong> Points by Type in Low Income Areas<br />
Name of LIA Protected Spring Borehole w/h<strong>and</strong><br />
pump<br />
Lined well w/h<strong>and</strong> pump Kiosks Total<br />
Chilobwe/Chimwan/Zingwa 1 (9%) 3 (27%) 7 (64%) 11<br />
Bangwe/Namiyango 8 (17%) 5 (10%) 35 (73%) 48<br />
BCA 2 (15% 11 (85%) 13<br />
Chigumula 13 (81%) 3 (19%) 0 16<br />
Chilomoni 5 (24%) 2 (9%) 14 (67%) 21<br />
Chirimba/Chileka Road 14 (50%) 14 (50%) 28<br />
Chiwembe 5 (83%) 1 (17%) 6<br />
Kachere/Makhe.Nkol 1 (3%) 3 (9%) 3 (9%) 28 (80%) 35<br />
Kameza 3 (50%) 3 (50%) 6<br />
Machinjiri 2 (6%) 25 (78%) 5 (16%) 32<br />
Manase 1 (5%) 6 (38%) 3 (19%) 6 (38%) 16<br />
Manyowe 2 (29%) 5 (71%) 7<br />
Mapanga 1 (10%) 7 (70%) 2 (20%) 0 10<br />
Misesa/Chensomba 21 (81%) 3 (11%) 2 (8%) 26<br />
Mzedi 1 (4%) 17 (74%) 2 (9%) 3 (13%) 23<br />
Naotcha 8 (100%) 8<br />
Ndir<strong>and</strong>e 4 (4%) 104 (96%) 108<br />
Sigerege 1 (5%) 6 (32%) 12 (63%) 19<br />
Soche 4 (17%) 4 (17%) 10 (42%) 6 (25%) 24<br />
Nancholi 12 (40%) 15 (50%) 1 (3%) 14 (47%) 30<br />
Source: <strong>Water</strong> <strong>for</strong> People (2009)<br />
To improve water supply in LIAs, BWB <strong>and</strong> BCC have set up a Kiosk Management Unit<br />
(KMU), whose responsibilities include facilitating the establishment of effective <strong>and</strong> efficient<br />
kiosk management, improving revenue collection <strong>and</strong> regulating water pricing. Nongovernmental<br />
organizations (NGOs) are also actively engaged in the water sector. <strong>Blantyre</strong> <strong>City</strong><br />
Council, BWB <strong>and</strong> the NGO W4P signed a Memor<strong>and</strong>um of Underst<strong>and</strong>ing (MOU) in<br />
September 2007 stipulating that they will work together in establishing <strong>Water</strong> Users Associations<br />
(WUAs). 13 Under the agreement, these associations would be responsible <strong>for</strong> managing water<br />
kiosks in urban <strong>and</strong> peri-urban low-income areas of <strong>Blantyre</strong>. BWB sells subsidized water to<br />
WUA kiosks at MK 0.082 per liter, <strong>and</strong> kiosks sell it at MK 3 per 20 liter bucket, which is<br />
considerably cheaper than prices charged by other kiosk operators <strong>and</strong> illegal private sellers in<br />
low-income areas.<br />
Be<strong>for</strong>e the introduction of WUAs, kiosks were managed by operators that included community,<br />
religious <strong>and</strong> political party leaders <strong>and</strong> BWB. Un<strong>for</strong>tunately, many operators were pocketing<br />
13 A WUA consists of an elected board, an executive committee, a bookkeeper, water sellers, water inspectors (NO<br />
COMMA) <strong>and</strong> plumbers. It sells water to people through communal water kiosks, where people purchase by-thebucket<br />
water from sellers.<br />
17
substantial amounts of money collected from kiosks instead of remitting it to BWB. This resulted<br />
in BWB disconnecting water in several LIAs.<br />
WUAs have now taken over operations, maintenance <strong>and</strong> revenue collection <strong>for</strong> kiosks in LIAs.<br />
They monitor <strong>and</strong> fix leaks <strong>and</strong> have even repaid amounts previously owed to the BWB. They<br />
are also rehabilitating old water points, reinvesting their profits in new infrastructure <strong>and</strong><br />
employing salaried operators (mainly women). Six WUAs are now operational in 10 LIAs:<br />
Kachere-Nkolokoti; Ndir<strong>and</strong>e-Matope; Michiru; Sanjika-Mitside; Namiyango-Chigumula; <strong>and</strong><br />
Mudi. BWB <strong>and</strong> W4P plan to establish more WUAs by 2013 to be located in the following<br />
areas: Namiyango-Chigumula; Michiru; Ndir<strong>and</strong>e-Matope; Mitsidi-Sanjika; Malab<strong>and</strong>a;<br />
Zingwangwa; Bangwe; Lunzu; <strong>and</strong> Chiwembe-Chensomba. One problem with the kiosks,<br />
however, is that they are only operational <strong>for</strong> about six hours a day.<br />
To enhance service delivery, W4P has also designed a tracking system called Field Level<br />
Operations Watch (FLOW) that uses <strong>and</strong>roid phones equipped with Global Positioning System<br />
<strong>and</strong> Google Earth software. The FLOW system gives WUAs, BWB <strong>and</strong> community members<br />
the ability to record <strong>and</strong> share data/in<strong>for</strong>mation on needed repairs <strong>and</strong> maintenance requirements.<br />
For instance, individuals can send SMS messages from their cell phones <strong>and</strong> request repairs. 14<br />
The quality of water in <strong>Blantyre</strong> has generally been considered to be acceptable, except <strong>for</strong><br />
bacteriological load (concentrates), which are relatively easily treated. There are indications,<br />
though, that several surface water sources are affected by sewerage <strong>and</strong> industrial contamination.<br />
Sajidu et al (2007), <strong>for</strong> instance, have found that streams are polluted with lead, cadmium, nickel,<br />
manganese <strong>and</strong> phosphates <strong>and</strong> that, “wastewater treatment plants in the city do not significantly<br />
reduce heavy metals,” <strong>and</strong> MIDW (2011) has noted that water quality has deteriorated in recent<br />
years. The 2011 BWB Annual Report, on the other h<strong>and</strong>, observes that water samples collected<br />
to monitor levels of toxic heavy metals such as phosphate <strong>and</strong> chromium in the Shire River do<br />
not show significant changes in the levels of heavy materials. However, the 2011 BWB report<br />
does not include any tables to substantiate these claims.<br />
Recent surveys also indicate that the city’s residents are not happy with water services, <strong>and</strong> some<br />
residents have complained that bills do not always tally with water usage, particularly during<br />
periods when water supply is disrupted (Ng’ong’ola et al., 2010).<br />
On average, residents have to travel a mean distance of 88 meters to an improved water source in<br />
<strong>Blantyre</strong> (Ng’ong’ola et al, 2010). However, a 2008 study conducted in low-income areas<br />
observes that the average distance was 800 meters, which is more than the <strong>Malawi</strong> Government<br />
st<strong>and</strong>ard of 500 meters (World <strong>Water</strong> Corps, 2008). This is likely because in these locations,<br />
residents do not have household or yard connections <strong>and</strong> there<strong>for</strong>e have to travel to distant water<br />
points to collect water.<br />
To improve water supply, BWB also needs to improve its operational efficiency. V<strong>and</strong>alism,<br />
leakages <strong>and</strong> illegal taps are common, resulting in unaccounted-<strong>for</strong>-water (UFW) <strong>and</strong> great<br />
14 SMS, or Short Message Service, is a text messaging service component of phone, web or mobile communication<br />
systems.<br />
18
financial losses. 15 As shown in Table 6, in recent years losses as a percentage of sales have<br />
hovered around 50 percent (NSO, 2010). In 2009 the daily total water supplied was 83,100<br />
liters, with losses of about 14,600 liters (about 49 percent). BWB would like to reduce water<br />
losses to less than 25 percent by 2013.<br />
Table 6. Metered <strong>Water</strong> Charges <strong>and</strong> <strong>Water</strong> Losses (2004-2009)<br />
2004/05 2005/6 2006/07 2007/08 2008/09 2009/10<br />
Metered <strong>Water</strong> Charges (K '000) 984,000 1,006,511 1,171,686 1,453,154 1,576,383 1,889,684<br />
Volume of Losses ('000 m ) 13 15 16 1.1 15.4 14.6<br />
Losses as Percentage of Sales 50% 49% 53% 48% 49% 49%<br />
Source: NSO (2010)<br />
Another key issue that needs to be addressed is lack of maintenance. The BWB water<br />
distribution network has more than 1,100 km of pipelines, but many pipes are old <strong>and</strong> need to be<br />
replaced. Pumps <strong>and</strong> trans<strong>for</strong>mers are also not regularly serviced because of high maintenance<br />
cost. In addition, because of increased silt build-up caused by soil erosion, the Walker’s Ferry<br />
<strong>and</strong> Mudi Treatment Plants are only able to produce a fraction of the total amount of water they<br />
are capable of generating (BWB, 2008).<br />
2.4. <strong>Blantyre</strong>’s <strong>Sanitation</strong> System<br />
The sewerage system in <strong>Blantyre</strong> <strong>City</strong> consists of piped sewerage as well as non-piped <strong>and</strong><br />
drainage systems. The Engineering Services Department of the BCC operates the sewerage<br />
system. There are five piped sewerage system networks (Mudi, Soche, Limbe, Chirimba <strong>and</strong><br />
Maone), but only 10 percent of the city’s population is connected to these networks (Matope,<br />
2000). Moreover, the networks are aging <strong>and</strong> have fallen into disrepair. A 2006 study estimated<br />
that 80 percent of the city’s sewerage flowed untreated into rivers due to breaks in the sewerage<br />
mains (MIWD, 2006).<br />
The majority of <strong>Blantyre</strong>’s residents (about 70 percent), particularly those living in in<strong>for</strong>mal<br />
settlements, use on-site sanitation system (mainly pit latrines) <strong>for</strong> human waste disposal. A key<br />
problem with the on-site sanitation system is that many latrines in <strong>Blantyre</strong> are only 1-3 meters<br />
deep (Ng’ong’ola et al., 2010). 16 These shallow pit latrines do not meet the government<br />
definition of ‘improved sanitation facilities’ (<strong>Water</strong> <strong>for</strong> People, 2008). Some of the pit latrines<br />
are also unhealthy because they lack slabs <strong>and</strong> are ideal breeding grounds <strong>for</strong> mosquitoes that<br />
transmit malaria <strong>and</strong> intestinal worms. 17 Moreover, in high-density unplanned areas, several<br />
households often share a latrine. As a result, the number of users per latrine is high, <strong>and</strong> since<br />
latrines are not very deep, they tend to fill up quickly. Typically, when a latrine becomes full,<br />
residents cap the old pit <strong>and</strong> dig another one.<br />
The rainy season is particularly challenging because pit latrines often overflow, contaminating<br />
groundwater in areas with high water tables <strong>and</strong> posing serious health risks. Expectedly, every<br />
15<br />
UFW reflects the difference between the volume of water delivered to the distribution system <strong>and</strong> the water sold.<br />
The level of UFW is considered a good proxy <strong>for</strong> the overall efficiency of operations of a water utility.<br />
16<br />
The ideal depth <strong>and</strong> of pit latrines is three meters or more, with 1-1.2 meters in diameter. The other on-site<br />
sanitation technology is septic tanks.<br />
17<br />
A slab is the floor of a latrine. It is commonly made of concrete <strong>and</strong> covers the pit of the latrine.<br />
19
year, <strong>Blantyre</strong> registers outbreaks of cholera <strong>and</strong> other waterborne diseases. For instance, during<br />
the seven-month period between December 2009 to June 2010, <strong>Blantyre</strong> recorded over 250<br />
cholera cases (Muwamba, 2010). Organizations such as <strong>Malawi</strong> Homeless People's Federation<br />
(MHPF) have promoted the construction of EcoSan latrines or Skyloos (elevated pit latrines) in<br />
low-income areas, particularly in locations with high water tables (UN-HABITAT, 2011).<br />
Given the preponderance of shallow pit latrines <strong>and</strong> the acute need <strong>for</strong> pit-emptying services, a<br />
promising fecal sludge management technology, called the Gulper, was recently developed. The<br />
Gulper, a simple, manual pit-emptying pump designed by Steve Sugden at the London School of<br />
Hygiene <strong>and</strong> Tropical Medicine, is easy to operate <strong>and</strong> can access hard-to-reach households in<br />
crowded areas. 18 According to Magoya (2011), this technology has “attracted a lot of interest,<br />
even owners of septic tanks are calling <strong>for</strong> Gulper service.” More importantly, W4P trains local<br />
small-scale sanitation entrepreneurs to start <strong>and</strong> manage pit-emptying businesses. Pit-emptying<br />
companies charge MK 3,000 ($10) <strong>for</strong> a 200-liter drum. This is cheaper than the flat rate the<br />
BCC charges <strong>for</strong> this service, which is MK 10,000 ($35) per load. Other pit-emptying<br />
technologies that have been developed include the ‘Nibbler,’ which is faster <strong>and</strong> requires less<br />
pumping ef<strong>for</strong>t than the Gulper. However, there is also a need to ensure that there are adequate<br />
facilities <strong>for</strong> the safe transport <strong>and</strong> disposal of waste from pit latrines. In response, W4P has<br />
been developing a technology to dry fecal matter using solar energy, so as to reduce<br />
transportation costs. Without access to af<strong>for</strong>dable waste dumping/drying sites, pit-emptying<br />
service providers tend to dump the septic tank/pit sludge illegally.<br />
Solid Waste<br />
<strong>Blantyre</strong> <strong>City</strong>’s Health Department is responsible <strong>for</strong> solid waste management. More than a<br />
decade ago, Matope (2000) estimated that the total solid waste generated in the city was 0.37 kg<br />
per capita per day, which amounted to 192 tons a day, with three-quarters of it domestic waste.<br />
In 2006 BCA’s Chief Environmental Officer estimated that the average solid waste amount<br />
generated each day was 540 metric tons (MIDW, 2006a). A recent document estimates that<br />
<strong>Blantyre</strong> residents produce an average of 0.9 kg of waste per capita per day (equivalent to 647<br />
metric tons per day)—81 percent of which is organic <strong>and</strong> biodegradable (Berman, 2010).<br />
According to UN-HABITAT, only a third of the solid waste generated is actually collected (UN-<br />
HABITAT, 2011).<br />
Solid waste collection services are available in high-income areas, but low-income areas do not<br />
have access to the same services. BCC has placed skips/containers in many residential areas <strong>and</strong><br />
markets, but collection is irregular, particularly when there are fuel shortages or when vehicles<br />
break down. In peri-urban areas there is no regular solid waste collection system in place, partly<br />
because there are few access roads. As a result, household solid waste is often dumped into pits,<br />
drains or indiscriminately discarded in the streets. As a means of improving the waste disposal<br />
situation in the urban areas, additional skips/containers should be placed at vantage points so that<br />
people can drop waste materials in them. These skips should also be emptied regularly.<br />
There are a number of private entities providing waste collection services, including <strong>Malawi</strong><br />
Housing Corporation <strong>and</strong> private trash collectors, but they focus on commercial/industrial<br />
companies <strong>and</strong> houses in high-income areas, leaving poor communities underserved. The BCC<br />
18 For a <strong>Water</strong>Aid brochure on the Gulper, see http://www.wateraid.org/documents/thegulpertechnologyposter.pdf.<br />
20
charges private waste collectors fees to dispose of waste at the dumpsite, <strong>and</strong> as a result, many of<br />
these collectors dump waste in undesignated areas to avoid the fees. 19<br />
Table 7 shows the state of BCC’s sanitation equipment in 2010. As can readily be seen, most of<br />
these vehicles are very old (over 10 years). In addition, almost half of the 14 trucks <strong>and</strong> three<br />
tractors are in poor condition <strong>and</strong> tend to break down often.<br />
Table 7. 2010 Solid Waste Equipment List<br />
TYPE OF EQUIPMENT NUMBER YEAR BOUGHT LOADS PER WEEK<br />
REFUSE TRUCKS 14<br />
BK 2654 1996 28<br />
BL 913 1998 7<br />
BL 914 1998 7<br />
BL 915 1998 6<br />
BL 916 1998 7<br />
BP 2741 2008 7<br />
BP 2742 2008 28<br />
BN 1192 2004 6<br />
BM 269 2000 24<br />
BL 1005 1998 20<br />
BL 1903 1998 20<br />
BM 6074 2000 6<br />
BL 6856 2000 6<br />
BJ 4913 1993 7<br />
TRACTORS 3<br />
BP 1532 2007 1<br />
BP 1534 2007 1<br />
BJ 4750 1993 Mower<br />
Source: <strong>Blantyre</strong> <strong>City</strong> Council<br />
Solid waste is collected on a regular basis in high-income areas, but in<strong>for</strong>mal settlements <strong>and</strong><br />
Traditional Housing Areas (THAs) 20 are severely underserved. In these areas, solid waste is<br />
either not collected, or skips are emptied irregularly, leading to the accumulation of waste <strong>and</strong><br />
the indiscriminate disposal of solid waste. Figure 8 shows an example of a dumpsite in an<br />
in<strong>for</strong>mal settlement. Ironically, the sign states, “Do Not Litter.”<br />
Figure 8. In<strong>for</strong>mal Dumpsite in Ndir<strong>and</strong>e<br />
Source: BCC/S. Berman<br />
19 Dumpsite fees range from MK 3,000 - MK 8,000 ($10 to $29) <strong>for</strong> 1 -10 tons of waste.<br />
20 THAs are areas where the urban poor can access legal <strong>and</strong> planned housing plots.<br />
21
The official site <strong>for</strong> solid waste disposal, known as Mzedi, is located along the eastern boundary<br />
of the city on the slopes of Mzedi Mountain <strong>and</strong> is nearing full capacity. The site is not a proper<br />
l<strong>and</strong>fill, but rather an uncontrolled open dump without leachate or gas management systems <strong>and</strong><br />
without a fence, so it is accessible to residents, including children. This is problematic because<br />
hazardous waste is not separated from other waste (GoM, 2009). Hazardous waste includes<br />
paints, solvents, consumer batteries, construction <strong>and</strong> demolition debris, chemical <strong>and</strong><br />
pharmaceutical waste, medical <strong>and</strong> infectious waste (MIW), tires <strong>and</strong> sewage sludge. At times,<br />
MIW is disposed of by burning.<br />
The Mzedi l<strong>and</strong>fill is a long distance from the city center, influencing the cost involved in<br />
collecting <strong>and</strong> disposing of waste. More importantly, the l<strong>and</strong>fill has also outlived its lifespan by<br />
approximately 10 years <strong>and</strong> is dilapidated. The BCC has determined that a second l<strong>and</strong>fill site is<br />
needed <strong>and</strong> that it should be located closer to the city; however, it is not expected to be<br />
operational be<strong>for</strong>e 2015. In the interim, BCC hires a private company twice a year to “bulldoze”<br />
or cover the garbage at the l<strong>and</strong>fill with earth, as a way to mitigate flies <strong>and</strong> foul odor; this is<br />
neither sustainable nor cost-effective. It is estimated that the BCC spends MK 10 million<br />
($35,335) just to bulldoze the Mzedi l<strong>and</strong>fill each year.<br />
To reduce the volume of waste at Mzedi, recycling of inorganic materials also needs to be<br />
actively promoted. Some people living in nearby villages, including children, are already<br />
recuperating dumped items from the l<strong>and</strong>fill <strong>and</strong> re-selling them, but this <strong>for</strong>m of<br />
recycling/scavenging is not healthy or organized. A <strong>for</strong>mal system of plastic, glass, aluminum<br />
<strong>and</strong> paper recycling needs to be introduced. The first step would be to build a recycling plant<br />
<strong>and</strong> establish a number of collection stations where households can bring their garbage. 21<br />
Unemployed individuals could then sort recyclables from biodegradable waste <strong>and</strong> receive<br />
compensation. A public education campaign in<strong>for</strong>ming people about reducing waste generation<br />
<strong>and</strong> encouraging them to sort their household waste would also be needed. For instance,<br />
households could be sensitized to separate glass, plastics <strong>and</strong> aluminum cans <strong>and</strong> plastic from<br />
organic waste <strong>and</strong> encouraged to store organic <strong>and</strong> inorganic waste in separate bins.<br />
Overall, there is limited recycling <strong>and</strong> re-use of waste in <strong>Blantyre</strong>. The BCC waste management<br />
policy there<strong>for</strong>e needs to be based on the principle of “Three Rs”, namely, Reducing, Reusing<br />
<strong>and</strong> Recycling. <strong>City</strong> officials also need to see organic waste as an income-generating resource<br />
that can be harnessed to produce fertilizer, or methane gas that can be used as fuel. Scholars<br />
such as Gjefle (2011) have argued that productive sanitation (also referred to as Eco-sanitation,<br />
or EcoSan) can create an engine of economic growth <strong>for</strong> African urban economies because<br />
activities such as composting can generate income <strong>and</strong> create jobs.<br />
Finally, it is also worth noting that many roads in unplanned areas in <strong>Blantyre</strong> do not have storm<br />
drains, <strong>and</strong> the few drains that exist are often clogged by garbage, making flooding more likely.<br />
The <strong>for</strong>mal areas have stormwater run-off infrastructure, but there are few drains in LIAs, with<br />
the resultant risks of flooding during the rainy season. To improve drainage in the city, BCC has<br />
proposed a $13.3m project to improve stormwater management.<br />
21 The National 2012-2022 <strong>Sanitation</strong> <strong>and</strong> Hygiene Investment Plan <strong>and</strong> Strategy calls on all <strong>Malawi</strong>ans to practice<br />
safe recycling of liquid <strong>and</strong> solid waste, but does not detail any specific activities.<br />
22
Liquid Waste<br />
Historically, <strong>Blantyre</strong> has had as many as five wastewater treatment works (WWTW)—<br />
<strong>Blantyre</strong>, Soche, Limbe, Chirimba, <strong>and</strong> Maone— but three of them (Chirimba, Limbe <strong>and</strong><br />
Maone) are not functioning, <strong>and</strong> the others are in need of major repairs. These plants receive<br />
wastewater through the sewerage network <strong>and</strong> from tankers depositing effluent collected from pit<br />
latrines/septic tanks. Figure 9 shows the locations of WWTWs, sewer catchment areas <strong>and</strong> sewer<br />
lines.<br />
Figure 9. <strong>Blantyre</strong> Sewer Catchment Areas <strong>and</strong> Wastewater Treatment Works<br />
<strong>Blantyre</strong> Disposal Works is the largest WWTW <strong>and</strong> was established as a conventional biological<br />
filtration plant serving 35,000 people <strong>and</strong> industries. The Soche Sewage Treatment Plant was<br />
constructed in 1958, <strong>and</strong> the Limbe Disposal Works was built almost a decade later in 1967.<br />
23
However,<br />
these plants s have not be een properly maintained, m a<strong>and</strong><br />
the capaability<br />
of existing<br />
wastewwater<br />
treatment t plants to tr reat septage from f growin ng numbers oof<br />
septic tankks<br />
<strong>and</strong> latrinnes<br />
is limitedd.<br />
As<br />
a result, liquid<br />
waste that t is suppos sed to be trea ated at the plants<br />
ends up flowing intoo<br />
rivers untreeated.<br />
The city also has trea atment plants<br />
<strong>for</strong> industr rial wastewatter.<br />
The Blaantyre<br />
plant at Manase, f<strong>for</strong><br />
instance, processes re esidential se ewage as wel ll as industriial<br />
effluent fr from compannies<br />
such as<br />
Carlsberg g, Dairyboar rd Ltd, Chibu uku Breweri ies, the Coldd<br />
Storage Coompany<br />
<strong>and</strong> the Mapeto<br />
David Whitehead W tex xtile compan ny. This liqu uid waste is ssupposed<br />
to be processeed<br />
through a<br />
series of settlement ta anks, filters <strong>and</strong> aeration n ponds, but due to poor maintenancce,<br />
it often dooes<br />
not go th hrough the tre eatment proc cess <strong>and</strong> flow ws untreatedd<br />
into the Muudi<br />
River. PPoor<br />
wastewater<br />
managem ment is an ac cute problem m throughout <strong>Blantyre</strong>, buut<br />
is especiaally<br />
so in unpplanned<br />
settlemen nts, where th he lack of pro oper drainag ge <strong>and</strong> overfl flowing latrinnes<br />
result in wastewater<br />
flowing indiscrimina i ately into ope en spaces or their immeddiate<br />
surrounndings.<br />
Figure 10 0. A Functio oning (left) <strong>and</strong> a Non-Fun nctioning (rigght)<br />
Wastewwater<br />
Treatmment<br />
Plant<br />
So ource: Moumié é Maoulidi<br />
2.5. Acce ess to Sanita ation in <strong>Blantyre</strong><br />
The GoM M requires th hat every hou use should have h some tyype<br />
of sanitattion<br />
facility. As a result, ,<br />
many sur rveys show that t a high percentage p of f residents have<br />
access too<br />
some <strong>for</strong>mm<br />
of latrine<br />
(GoM, 20 008). As Ta able 8 shows s, flush toilet ts are populaar<br />
in low- annd<br />
medium-ddensity<br />
areass,<br />
but<br />
four out of o five house eholds in hig gh-density unplanned u loccations<br />
rely on pit <strong>and</strong> vventilated<br />
pitt<br />
latrines.<br />
Table 8. Types of La atrines Used in <strong>Blantyre</strong><br />
High-Densisty<br />
High-Density<br />
Latrine Typ pe Unplan nned Areas Planned P Areas (% %)<br />
Pit latrine<br />
80.6<br />
48.4<br />
VIP/san pla at<br />
6.6<br />
1.1<br />
Flush toilet t<br />
12.6<br />
50.5<br />
Other<br />
0.2<br />
0<br />
Total<br />
100<br />
100<br />
Sample (N) )<br />
653<br />
91<br />
Source: Ng g’ong’ola et al. . (2010)<br />
Medium-DDensity<br />
Areas (%)<br />
29. .5<br />
4<br />
66. .5<br />
0<br />
1000<br />
1766<br />
Loww-Density<br />
Arreas<br />
(%)<br />
31.8<br />
5.8<br />
62.4<br />
0<br />
100<br />
173<br />
Accordin ng to Ng’ong g’ola et al. (2 2010), 98.1 percent p of reesidents<br />
havee<br />
access to a toilet, whicch<br />
suggests that Blantyr re has surpas ssed the MD DG sanitationn<br />
target. Thee<br />
problem is that such daata<br />
Total<br />
62<br />
5.6<br />
32.3<br />
0.1<br />
100<br />
1093<br />
24
do not take into account that 34 percent of pit latrines are less than three meters deep, <strong>and</strong> many<br />
are open pit (without a cover); hence they cannot be considered to be improved sanitation<br />
facilities. 22 Moreover, many toilets in <strong>Blantyre</strong> are shared by several households, <strong>and</strong> it is<br />
questionable whether they con<strong>for</strong>m to the JMP’s definition of improved sanitation facility.<br />
According to recent documents like MIWD (2011), official statistics on the number of people<br />
with access to improved sanitation in <strong>Malawi</strong> are misleading because definitions <strong>and</strong><br />
interpretations of what constitutes adequate sanitation have differed. For instance, the <strong>Malawi</strong><br />
Integrated Household Surveys (IHS) use the term ‘proper sanitation’ <strong>and</strong> define it as having a<br />
flush toilet, VIP toilet or traditional latrine with a roof. The 2009 Welfare Monitoring Survey<br />
(WMS) uses the phrase ‘safe/improved sanitation’ <strong>and</strong> defines it as having a flush toilet, VIP<br />
latrine or covered pit latrine. The 2008 Census asked respondents to identify whether they have a<br />
flush toilet, VIP, traditional latrine, no toilet or other facility, but the definition of "other facility"<br />
is not clear. All the a<strong>for</strong>ementioned data sources ask if the toilet facilities are shared with other<br />
households, but it is unclear whether the GoM considers shared toilets as improved sanitation<br />
facilities. Clearly, there is a need to harmonize definitions of access to improved sanitation.<br />
This report uses the UN JMP’s definition of improved sanitation, as shown in Table 9. Using<br />
this definition, we estimate that 63.9 percent of <strong>Blantyre</strong>’s population had access to improved<br />
sanitation in 2009.<br />
Table 9. Definition of Improved <strong>and</strong> Unimproved <strong>Sanitation</strong> Facilities<br />
Improved <strong>Sanitation</strong> Unimproved <strong>Sanitation</strong><br />
Connection to a public sewer Bucket latrine<br />
Connection to a septic tank Public or shared latrine<br />
Pour-flush toilet Latrines with open pit<br />
Simple pit latrine Flying toilets<br />
Ventilated improved pit latrine (VIP)<br />
Source: http://www.wssinfo.org/definitions/infrastructure.html<br />
2.6. Hygiene Education<br />
Baseline survey reports, such as Ng’ong’ola et al. (2010), observe that most <strong>Blantyre</strong> residents,<br />
irrespective of socio-economic strata, wash their h<strong>and</strong>s after visiting a toilet. Local hygiene<br />
teams have sensitized communities about h<strong>and</strong>-washing, <strong>and</strong> most people are aware that washing<br />
h<strong>and</strong>s decreases the spread of disease-causing pathogens. The 2008 National <strong>Sanitation</strong> Policy<br />
also emphasizes that h<strong>and</strong>-washing improves personal hygiene, <strong>and</strong> the MGDS II, <strong>Malawi</strong>’s<br />
reference document <strong>for</strong> development programs during the period between 2011 <strong>and</strong> 2016,<br />
underscores the importance of increased awareness of hygiene. However, due to water scarcity,<br />
most people use bowls <strong>and</strong> not running water, <strong>and</strong> soap is not always available (<strong>Water</strong> <strong>for</strong><br />
People, 2009; Ng’ong’ola et al., 2010). In addition, according to one government official, even<br />
when soap is available, citizens do not have the “mental attitude” to use it as necessary <strong>for</strong> good<br />
hygiene. 23 To overcome such proclivities, in 2008 UNICEF <strong>and</strong> <strong>Malawi</strong>’s Ministry of Health<br />
22<br />
The ideal depth of pit latrines is three meters, with 1-1.2 meters in diameter. These latrines have a 20-year<br />
lifespan.<br />
23<br />
Adrina Mchiela, Principal Secretary, Ministry of Irrigation <strong>and</strong> <strong>Water</strong> Development, quoted in Sunday Times<br />
newspaper, 9 November 2008.<br />
25
launched a nationwide “Soap Campaign” to encourage the use of soap when washing h<strong>and</strong>s. The<br />
EU EIB also has a $100,000 (MK 2.8 million) hygiene education project in <strong>Blantyre</strong> that is<br />
expected to end in 2012. This type of project needs to continue.<br />
Hygiene education should also include sensitization campaigns <strong>for</strong> solid <strong>and</strong> liquid waste<br />
disposal, given that it is equally important to change people’s mindsets about how to dispose of<br />
solid <strong>and</strong> liquid waste. Such campaigns will only succeed, however, if the BCC also provides<br />
containers <strong>for</strong> the safe disposal of solid <strong>and</strong> liquid waste.<br />
2.7. Access to <strong>Water</strong> <strong>and</strong> <strong>Sanitation</strong> in Schools <strong>and</strong> Hospitals<br />
A 2011 BCC survey that collected data from 54 (out of 58) <strong>Blantyre</strong> <strong>City</strong> Primary Schools<br />
reveals that approximately 87 percent of the public schools have access to clean <strong>and</strong> safe water,<br />
<strong>and</strong> 13 percent relied on unimproved sources of water (BCC, 2011). In addition, about 77<br />
percent had well-maintained toilets, but only one-third had h<strong>and</strong>-washing facilities. Moreover,<br />
only 25 percent of the schools had WASH clubs, <strong>and</strong> most schools (94 percent) did not recycle<br />
their waste (Ibid). 24 It is paramount to improve schools without working toilets or clean water<br />
because such schools are not only unhealthy, they also discourage children from attending school<br />
<strong>and</strong> completing their education.<br />
Regarding <strong>Blantyre</strong> public health facilities, most have access to piped water <strong>and</strong> are connected to<br />
the sewer system (UN-HABITAT, 2011). The main water <strong>and</strong> sanitation challenges facing<br />
health facilities include irregular supply of water <strong>and</strong> poor management of solid waste,<br />
particularly hazardous medical waste. The Ministry of Health now has a policy that all health<br />
facilities should either have an incinerator or an arrangement to safely discard medical waste.<br />
III. FINANCING WATER AND SANITATION IN BLANTYRE<br />
BCC derives its income from the central government, property rates <strong>and</strong> business taxes, as well<br />
as various fees. According to UN-HABITAT (2011), the city’s revenue collection rates have<br />
been low, “due to high default rates, lack of transparency <strong>and</strong> corruption.”<br />
To date, most of the funding from the central government has not been allocated to the water <strong>and</strong><br />
sanitation sector. For instance, the <strong>Malawi</strong> Ministry of Finance (MoF) Budget estimates show<br />
that in 2009, MK 12,486 million ($88.4m) was allocated to district assemblies, but less than one<br />
percent of this amount was <strong>for</strong> the water supply or sanitation (MIWD, 2011). 25 The proportion<br />
of development partners’ financial contributions to the national water <strong>and</strong> sanitation sector<br />
budget, on the other h<strong>and</strong>, has been increasing. For instance, between 2004 <strong>and</strong> 2009,<br />
contributions from development partners to the sector increased from MK 590 million ($5.4<br />
million) to MK 4,481 million ($31.7 million) (MIWD, 2011). Table 10 shows the MoF budget<br />
estimates <strong>for</strong> 2011-2014.<br />
24 WASH is an acronym <strong>for</strong> water, sanitation <strong>and</strong> hygiene.<br />
25 The largest sector budgets at the district level were <strong>for</strong> health (72.9 percent).<br />
26
Table 10. Ministry of Finance IWSS Budget Estimates 2011-2014<br />
2011 2012 2013 2014<br />
Development budget local (MK Million) 422 1,656 2,289 170<br />
Development budget <strong>for</strong>eign (MK Million) 3,863 15,644 21,777 97<br />
Recurrent budget (MK Million) 635 730 839 965<br />
Total budget (MK Million) 4,920 18,030 24,905 1,232<br />
Source: MIWD (2011)<br />
The Government of <strong>Malawi</strong>’s policy is that water tariffs should be as low as possible <strong>and</strong><br />
af<strong>for</strong>dable to all, including to low-income areas dwellers. Some kiosk sellers overcharge<br />
customers, but the BWB has made it clear to water sellers that they need to abide by the<br />
following water tariff structure.<br />
Table 11. Tariff Structure <strong>for</strong> Domestic, Commercial <strong>and</strong> Industrial Facilities (Aug. 2012)<br />
1<br />
2<br />
Rate<br />
Charged<br />
per Liter<br />
20 liter<br />
Bucket<br />
200 liter<br />
Drum<br />
MK 0.082 MK 1.64 MK 16.40<br />
(a) 0 to 5,000 liters MK 0.144 MK 2.88 MK 28.80<br />
(b) 0 to 10,000 liters MK 0.148 MK 2.96 MK 29.60<br />
(c) 0 to 40,000 liters MK 0.178 MK 3.56 MK 35.60<br />
(d) 0 to above 40,000 liters MK 0.196 MK 3.92 MK 39.20<br />
3<br />
(a) 0 to10,000 liters MK 0.235 MK 4.70 MK 47.00<br />
(b) 0 to 40,000 liters MK 0.260 MK 5.20 MK 52.00<br />
(c) 0 to above 40,000 liters MK 0.281 MK 5.62 MK 56.20<br />
4<br />
(a) 0 to 10,000 liters MK 0.254 MK 5.08 MK 50.80<br />
(b) 0 to 40,000 liters MK 0.280 MK 5.60 MK 56.00<br />
(c) 0 to above 40,000 liters MK 0.303 MK 6.06 MK 60.60<br />
5<br />
<strong>Water</strong> supplied from communal water points or kiosks<br />
<strong>Water</strong> supplied <strong>for</strong> domestic purposes<br />
<strong>Water</strong> supplied to institutions<br />
<strong>Water</strong> supplied <strong>for</strong> commercial purposes<br />
<strong>Water</strong> supplied <strong>for</strong> industrial purposes<br />
(a) 0 to 10,000 liters MK 0.329 MK 6.58 MK 65.80<br />
(b) 0 to 40,000 liters MK 0.368 MK 7.36 MK 73.60<br />
(c) 0 to above 40,000 liters MK 0.407 MK 8.14 MK 81.40<br />
Source: BWB. See http://www.bwb.mw/tariffs.php<br />
BWB's major sources of revenue include water sales (about 97 percent), connection/reconnection<br />
fees, income from bank interest, <strong>and</strong> profits from disposal of assets (EU & EIB, 2008). User<br />
charges currently do not cover BWB’s operation <strong>and</strong> maintenance costs (Ng’ong’ola et al.,<br />
2010). As previously noted, a significant portion of BWB’s revenues have been used to defray<br />
electricity costs, <strong>and</strong> it is estimated that a significant portion (40 percent) of the total operating<br />
cost is still spent on electric bills <strong>for</strong> pumping treated water from Walker's Ferry <strong>and</strong> Chileka to<br />
the distribution network in <strong>Blantyre</strong> <strong>City</strong> (EU & EIB, 2008). BWB also suffers from the non-<br />
27
payment of water bills from a large number of government institutions, <strong>for</strong> a total of<br />
approximately $10 million.<br />
According to the World Bank <strong>and</strong> BWB annual reports, BWB recorded net losses every year<br />
between 2002 <strong>and</strong> 2009. For instance, BWB incurred net losses of MK 234 million <strong>and</strong> MK 106<br />
million ($835,714 <strong>and</strong> $378,571) in 2008 <strong>and</strong> 2009, respectively (BWB, 2008; BWB, 2009). The<br />
losses can be attributed to poor operating efficiency. For instance, non-revenue water (NRW)—<br />
the difference between water produced <strong>and</strong> water lost to leakages, illegal connections <strong>and</strong><br />
unbilled consumption— increased from 34 to 49 percent between 2002 <strong>and</strong> 2005. In 2011,<br />
BWB managed to reduce NRW from 48 to 47 percent (BWB, 2011). The high level of NRW is<br />
particularly costly since BWB has to pump up all the water that it produces, which requires a lot<br />
of electricity. The Board’s Financial Statements show that the financial per<strong>for</strong>mance is<br />
improving: BWB recorded net profits of MK 76.8 million ($274,285) in 2010 <strong>and</strong> MK 58.9<br />
million ($210,357) in 2011.<br />
Table 12 shows the BWB budget between 2004 <strong>and</strong> 2009 <strong>and</strong> compares it to the total budget of<br />
<strong>Malawi</strong>'s other water boards. It can be seen that the bulk of the national budget <strong>for</strong> water boards<br />
is allocated to BWB, although the proportion is decreasing.<br />
Table 12. Budgets <strong>Blantyre</strong> <strong>Water</strong> Board Compared to Other <strong>Water</strong> Boards (2004-2009)<br />
2004 2005 2006 2007 2008 2009<br />
<strong>Blantyre</strong> <strong>Water</strong> Board (MK Million) 1,175 1,148 1,140 1,433 1,799 2,086<br />
Lilongwe + Northern Region + Central<br />
Region + Southern Region <strong>Water</strong> Boards<br />
(MK Million) 1763 2183 2626 2989 3488 3613<br />
Total budget (MK Million) 2,938 3,331 3,766 4,422 5,287 5,699<br />
BWB's Budget as % of Total Budget 40% 34% 30% 32% 34% 37%<br />
Source: MIWD (2011)<br />
Identifying the budget allocated to sanitation is challenging because on-site sanitation is<br />
managed by BCC’s Health Department, while the Engineering Services Department operates the<br />
sewerage system, <strong>and</strong> the BCC’s Health Department is responsible <strong>for</strong> solid waste management.<br />
Nonetheless, it was possible to obtain some data that provide an indication of the level of<br />
funding available <strong>for</strong> sanitation activities, as shown in Table 13.<br />
Table 13. Department of Cleansing Services <strong>and</strong> Sewerage Income (2007-2010)<br />
2007 2008 2009 2010<br />
Dept. of Manager of Cleansing Services (MK) 20,297,000 6,482,000 12,052,828 11,531,064<br />
Engineering Dept: Main Sewerage - Administration (MK) 20,145,000 14,927,636 10,273,320 22,993,189<br />
Total Income: Cleansing Service & Engineering (MK)<br />
Source: BCC Health Department<br />
40,444,007 21,411,644 22,328,157 34,526,263<br />
3.1. Financing <strong>Water</strong> <strong>and</strong> <strong>Sanitation</strong><br />
A number of international organizations, including World Bank, Africa Development Bank<br />
(AfDB) <strong>and</strong> the European Union (EU) provide financial support to the water <strong>and</strong> sanitation<br />
sector in <strong>Blantyre</strong>. For instance, to mitigate water shortage problems, BWB is implementing a<br />
four-year project, known as the <strong>Malawi</strong> Peri-Urban <strong>Water</strong> Supply <strong>and</strong> <strong>Sanitation</strong> Project, which<br />
28
seeks to bring potable water <strong>and</strong> improve sanitation to people in low-income areas. 26 The<br />
project’s total cost of €32 million ($40.5 million) is financed by an EU <strong>Water</strong> Facility Grant of<br />
€14.9 million ($18.8 million) <strong>and</strong> a €15.7 million ($19.9 million) European Investment Bank<br />
(EIB) loan. 27 Key goals of the project, which is part of NWDP II, include upgrading the water<br />
<strong>and</strong> sanitation infrastructure in <strong>Blantyre</strong>, constructing 363 water kiosks, reducing water losses to<br />
less than 25 percent <strong>and</strong> increasing production capacity by 20 percent (BWB, 2011). 28<br />
The World Bank initially allocated $2.5 million to improve water supply in the medium term.<br />
The funds were used to procure pumps <strong>and</strong> spare parts <strong>for</strong> the Walker’s Ferry Treatment Plant<br />
<strong>and</strong> the Chileka Pumping Station <strong>and</strong> to upgrade a pipeline that runs from Walker's Ferry to<br />
Chileka. The recent EU <strong>and</strong> EIB financing supplements funding <strong>for</strong> the World Bank supported<br />
the Second National <strong>Water</strong> Development Project (NWDP II), which started in 2007. There are<br />
also plans to develop a new water source that will complement the existing water sources, at<br />
Walker's Ferry <strong>and</strong> Mudi Dam, <strong>and</strong> improve water storage capacity by building three storage<br />
reservoirs, at Kameza, Chilobwe <strong>and</strong> Chigumula. The total cost <strong>for</strong> these projects is about $21<br />
million.<br />
The African <strong>Water</strong> Facility (AWF), an initiative of the African Ministers Council on <strong>Water</strong><br />
(AMCOW) managed by the African Development Bank, also has a €814 897 ($1.03 million)<br />
project to improve water <strong>and</strong> sanitation in slums surrounding <strong>Blantyre</strong> <strong>City</strong>. AFW is financing 75<br />
percent of the project costs while the Centre <strong>for</strong> Community Organization <strong>and</strong> Development<br />
(CCODE) <strong>and</strong> the beneficiaries are incurring the remaining costs. Inter alia, the project seeks to<br />
facilitate access to af<strong>for</strong>dable <strong>and</strong> environmentally friendly water <strong>and</strong> sanitation facilities <strong>for</strong><br />
1000 urban poor households through the establishment of a revolving loan fund. It is expected<br />
that the project will be completed by 2013.<br />
3.2. Costing Model<br />
This study uses a needs assessment tool developed by the UN Millennium Project to estimate the<br />
financial resources needed to achieve water <strong>and</strong> sanitation targets at the sub-national level. This<br />
Excel-based needs assessment tool relies on population data, coverage targets <strong>and</strong> unit costs. 29<br />
Data on water <strong>and</strong> sanitation coverage were derived from a baseline survey submitted to MIWD<br />
by Ng’ong’ola et al. (2010) <strong>and</strong> several surveys, including the 2009 WMS.<br />
Improved water sources or technologies identified by MCI as appropriate <strong>for</strong> <strong>Blantyre</strong> include: 30<br />
1. Individual household connection<br />
2. Piped water from a yard tap<br />
3. Kiosk/Public tap water<br />
4. Rainwater harvesting<br />
26 http://eeas.europa.eu/delegations/malawi/documents/press_corner/20100826_01_en.pdf<br />
27 The end-date <strong>for</strong> the project is 2013. Data are from a 26 August 2010 EU <strong>and</strong> EIB press release.<br />
28 As previously mentioned, between 2005 <strong>and</strong> 2009, water losses were 48-50 percent.<br />
29 The model was initially developed by the United Nations Millennium Project, now administered by the United<br />
Nations Development Programme (UNDP), <strong>and</strong> was applied here by MCI <strong>for</strong> the first time in a municipal context.<br />
30 This list of interventions is presented as a reference <strong>and</strong> should not be viewed as an exhaustive set of options.<br />
29
Technologies included in this needs assessment as representing “improved” sanitation facilities<br />
include:<br />
1. Flush toilets connected to a septic tank or the public sewerage<br />
2. Pit latrine<br />
3. Ventilated improved pit latrine (VIP)<br />
4. Skyloos/Improved Two-Pit Latrines<br />
Unit Costs<br />
Units costs used in the model were derived from MIWD (2011), MCI’s Social Sector Specialist<br />
in <strong>Blantyre</strong> <strong>and</strong> other sources <strong>and</strong>, when local unit costs were not available, the national <strong>Water</strong><br />
<strong>and</strong> <strong>Sanitation</strong> costing model. <strong>Water</strong> <strong>and</strong> sanitation unit costs used in the costing model are<br />
shown in Table 14.<br />
A plastic water storage tank with masonry supporting pillars that can store 10,000 liters costs is<br />
estimated to cost MK 150,000 ($535). 31 The unit cost <strong>for</strong> a three-meters-deep lined pit, a Twopit<br />
improved latrine or Skyloo latrine, including cost <strong>for</strong> materials <strong>and</strong> labor, is estimated to cost<br />
MK 81,081 ($300).<br />
Table 14. Select Unit Costs Used in the Costing Model<br />
<strong>Water</strong> MK $ Source<br />
Household Connection (Private) 25,378 93.9 BWB<br />
Public St<strong>and</strong>pipes/Kiosks 140,811 521.0 GWCL/AVRL (Ghana)<br />
Boreholes with H<strong>and</strong>pumps 2,150,811 7,958.0 UNICEF WASH<br />
Rainwater Harvesting 8,108 30.0 Author<br />
Protected dug wells 81,081 300.0 Other African WatSan model<br />
<strong>Water</strong> Storage Facilities* 243,243 900.0 MCI Social Sector Specialist<br />
<strong>Sanitation</strong> Facilities MK $ Source<br />
Conventional Sewerage 45,405,405 168,000 GoM<br />
Septic Tank 177,297 656 Morella, Foster, Banerjee (2008)<br />
Flush Toilet 103,946 385 Other African WatSan model<br />
Pit Latrine (1.5 m lined, emptiable) 36,757 136 MIWD (2011)<br />
Ventillated Improved Latrine (VIP) 119,189 441 Morella, Foster, Banerjee (2008)<br />
Skyloo/ Improved Latrine (Two-Pit) 81,081 300 MIWD (2011)<br />
Note: USD units costs are converted using the July-Aug. 2012 exchange rate of USD ($) 1=MK 280<br />
3.3. Results of the Costing Model<br />
To identify the financial resources required to meet the water <strong>and</strong> sanitation targets, two models<br />
are presented: a Baseline scenario <strong>and</strong> an Alternative scenario.<br />
31 USD $1= MK 280.<br />
30
Baseline scenario<br />
Interventions under this scenario will be rolled out at an even pace between 2012 <strong>and</strong> 2015;<br />
hence, a linear scale-up path has been chosen. The underlying assumptions with regard to water<br />
supply <strong>and</strong> sanitation are as follows:<br />
60.8 percent of <strong>Blantyre</strong> residents had access to piped water in 2009. The Goal is to<br />
increase coverage to 95 percent by 2015.<br />
Ng’ong’ola et al. (2010) note that 98.1 percent of the population had access to a toilet,<br />
but 34 percent of the pit toilets were shared. Since shared toilets are not considered by<br />
UN’s JMP to be “improved” sanitation facilities, MCI assumes that only 63.9 percent of<br />
<strong>Blantyre</strong>’s population had access to improved sanitation in 2009. <strong>Sanitation</strong> coverage<br />
needs to increase to 82 percent in 2015. Moreover, about a quarter of the pit latrines will<br />
be pumpable VIPs.<br />
Three households share a household tap water connection in a yard; a public tap serves<br />
approximately 125 households.<br />
Total number of households is estimated at 146,079, <strong>and</strong> in 2009, only 10 percent were<br />
connected to a sewer. However, by 2015, 15 percent of households will have access to<br />
conventional sewerage.<br />
20 percent of public st<strong>and</strong> posts, boreholes, flush toilets <strong>and</strong> pit latrines were defective in<br />
2009, but by 2015, only 10 percent are assumed to be defective.<br />
As recommended by Lenton <strong>and</strong> Wright (2004), the annual operating <strong>and</strong> maintenance<br />
cost <strong>for</strong> water <strong>and</strong> sanitation facilities is 7.5 percent of the capital cost, but the<br />
rehabilitation cost is 15 percent of capital cost. The cost of rehabilitating pit latrines,<br />
however, is 5 percent of the capital cost.<br />
60 percent of the water <strong>and</strong> sanitation budgets are devoted to operational costs.<br />
The cost <strong>for</strong> primary <strong>and</strong> secondary wastewater treatment is taken into account in the<br />
baseline scenario, but the cost of tertiary treatment is assumed to be borne by the private<br />
sector. Per unit capital costs <strong>for</strong> primary treatment were taken from the <strong>Malawi</strong> National<br />
Model <strong>and</strong> are assumed to be $4,000 per unit capital costs; secondary treatment of<br />
conventional sewerage is estimated at $10,000 per unit.<br />
A wastewater treatment plant to recycle grey water <strong>and</strong> sewerage from households is also<br />
rehabilitated. The facility will have the following characteristics: one settling pond; two<br />
anaerobic tanks; <strong>and</strong> three bio lagoons. Total costs, including staff salaries <strong>for</strong> five<br />
engineers, five lab technicians, 10 operators, <strong>and</strong> 20 general workers, is $73,260. After<br />
the plant is rehabilitated, the annual cost <strong>for</strong> maintenance <strong>and</strong> staff salaries will be<br />
$12,900.<br />
The cost <strong>for</strong> teacher training <strong>and</strong> logistical support <strong>for</strong> hygiene education in primary<br />
schools is $1.50 per pupil.<br />
A mass media hygiene campaign will also be conducted at a cost derived from the<br />
<strong>Malawi</strong> National Model. MCI assumes that the cost <strong>for</strong> the <strong>Blantyre</strong> campaign will be a<br />
quarter of the cost of the national mass media campaign.<br />
Based on these assumptions <strong>and</strong> proposed interventions, the average annual per-capita cost to<br />
meet the MDG water <strong>and</strong> sanitation targets between 2013 <strong>and</strong> 2015 <strong>for</strong> the Baseline scenario is<br />
$16. About 57 percent of this per capita cost is <strong>for</strong> sanitation expenses, 23.8 percent is <strong>for</strong> water<br />
<strong>and</strong> 16 percent is <strong>for</strong> human resources.<br />
31
Table 15. Baseline Scenario Model Results<br />
2013<br />
<strong>Water</strong><br />
2014 2015 Average<br />
Capital Cost 1,684,122 1,783,216 1,884,679 1,784,005<br />
Operating Cost 1,230,031 1,370,620 1,521,387 1,374,013<br />
<strong>Water</strong> Total ($) 2,914,153 3,153,835 3,406,067 3,158,018<br />
<strong>Sanitation</strong><br />
Capital Cost 3,733,375<br />
Operating Cost 3,311,832<br />
<strong>Sanitation</strong> Total ($) 7,045,207<br />
Wastewater Treatment<br />
Capital Cost 13,315<br />
Operating Cost 47,952<br />
Total Waste<strong>Water</strong> Treatment ($) 61,267<br />
Hygiene Education Total ($) 202,548<br />
Hospitals Total ($) 3,285<br />
Schools Total ($) 10,638<br />
Human Resources Total ($) 2,249,253<br />
Settling Pond/Biolagoons Total ($) 12,900<br />
Enabling Intervention Total ($) 6,983<br />
Gr<strong>and</strong> Total ($) 12,519,133<br />
Per capita cost 15<br />
3,949,201<br />
3,639,519<br />
7,588,720<br />
14,087<br />
62,038<br />
76,125<br />
215,555<br />
3,519<br />
10,737<br />
2,265,174<br />
12,900<br />
6,983<br />
13,346,447<br />
4,171,336<br />
3,991,672<br />
8,163,008<br />
14,883<br />
76,922<br />
91,805<br />
232,428<br />
3,753<br />
10,836<br />
2,281,095<br />
12,900<br />
6,983<br />
14,221,775<br />
3,951,304<br />
3,647,674<br />
7,598,979<br />
14,095<br />
62,304<br />
76,399<br />
216,843<br />
3,519<br />
10,737<br />
2,265,174<br />
12,900<br />
6,983<br />
13,362,452<br />
Alternative scenario<br />
In the Alternative scenario, the same assumptions about operating, maintenance <strong>and</strong><br />
rehabilitation costs outlined in the Baseline scenario apply, but the coverage inputs are different.<br />
For instance, whereas 4.3 percent of toilets were VIP in 2009, nine percent of toilets are VIP<br />
toilets, <strong>and</strong> five percent are Skyloo toilets by 2015. In other words, sewage-based systems <strong>and</strong><br />
septic tanks are not promoted. Instead, the emphasis has repeatedly been placed on such<br />
sanitation technologies as VIP <strong>and</strong> pumpable toilets because they are low-cost, do not consume<br />
lot of water <strong>and</strong> the human excreta can be used to produce fertilizer or biogas. In addition, the<br />
cost of an additional wastewater facility is not taken into account, <strong>and</strong> only the salaries of<br />
sanitation workers, who are BCC employees, are considered. In this scenario, water employees<br />
are paid by BWB.<br />
Baseline scenario Alternative scenario<br />
2009 2015 2009 2015<br />
Conventional Sewerage 10.0% 15.0% Conventional Sewerage 10.0% 10.0%<br />
Septic Tanks 7.6% 9.0% Septic Tanks 7.6% 8.0%<br />
Flush Toilet/Pit Latrine 42.0% 50.0% Flush Toilet/Pit Latrine 42.0% 50.0%<br />
Ventillated Improve Pit Latrine 4.3% 6.0% Ventillated Improve Pit Latrine 4.3% 9.0%<br />
Improved (Two Pit Latrine) 0.0% 2.0% Improved (Two Pit Latrine) 0.0% 5.0%<br />
Infrastructure that is defective 20.0% 10.0% Infrastructure that is defective 20.0% 10.0%<br />
16<br />
16<br />
16<br />
32
The average annual per capita costs in the Alternative scenario <strong>for</strong> the 2013-2015 period is $13<br />
per capita, as shown in Table 16.<br />
Table 16. Alternative Scenario Model Results<br />
2013 2014 2015<br />
<strong>Water</strong><br />
Capital Cost 1,684,122<br />
Operating Cost 1,230,031<br />
<strong>Water</strong> Total ($) 2,914,153<br />
<strong>Sanitation</strong><br />
Capital Cost 3,824,547<br />
Operating Cost 3,355,659<br />
<strong>Sanitation</strong> Total ($) 7,180,207<br />
Wastewater Treatment<br />
Capital Cost 4,822<br />
Operating Cost 18,578<br />
Total Waste<strong>Water</strong> Treatment ($) 23,400<br />
Hygiene Education Total ($) 195,206<br />
Hospitals Total ($) 3,285<br />
Schools Total ($) 10,638<br />
Human Resources Total ($) 304,695<br />
Enabling Intervention Total ($) 6,983<br />
Gr<strong>and</strong> Total ($) 10,638,567<br />
Per capita cost 13<br />
1,783,216<br />
1,370,620<br />
3,153,835<br />
4,049,917<br />
3,697,036<br />
7,746,953<br />
4,937<br />
23,515<br />
28,452<br />
207,867<br />
3,519<br />
10,737<br />
304,695<br />
6,983<br />
11,463,041<br />
IV. CONCLUSION AND RECOMMENDATIONS<br />
13<br />
1,884,679<br />
1,521,387<br />
3,406,067<br />
4,280,535<br />
4,064,102<br />
8,344,636<br />
5,050<br />
28,565<br />
33,615<br />
224,224<br />
3,753<br />
10,836<br />
304,695<br />
6,983<br />
12,334,810<br />
14<br />
1,784,005<br />
1,374,013<br />
3,158,018<br />
4,051,666<br />
3,705,599<br />
7,757,265<br />
4,936<br />
23,553<br />
28,489<br />
209,099<br />
3,519<br />
10,737<br />
304,695<br />
6,983<br />
11,478,806<br />
Organizations such as the World Bank <strong>and</strong> reports such as M<strong>and</strong>a (2009) argue that <strong>Blantyre</strong><br />
<strong>City</strong> <strong>and</strong> <strong>Malawi</strong> are not on track to achieving the MDG targets in water <strong>and</strong> sanitation by 2015.<br />
The World Bank website, <strong>for</strong> instance, notes that, “about one fifth of <strong>Malawi</strong>ans do not have<br />
access to adequate water supply, while 44 percent do not have access to adequate sanitation.”<br />
Ng’ong’ola et al. (2010) corroborate this assertion by observing that only 25 percent of<br />
households in <strong>Blantyre</strong> are meeting the international water consumption st<strong>and</strong>ard of 60 liters per<br />
capita per day. Less than three years ago, the 2009 Welfare Monitoring Survey found that only<br />
54 percent of <strong>Blantyre</strong> residents had access to improved sanitation.<br />
To keep pace with higher dem<strong>and</strong>s <strong>for</strong> water from an increasing population, BWB needs to<br />
augment the city's water supply. This will require improving water production <strong>and</strong> operational<br />
efficiency through the rehabilitation of treatment plants, trans<strong>for</strong>mers, motors <strong>and</strong> pumps;<br />
improving cost recovery; developing a rapid response to v<strong>and</strong>alism; <strong>and</strong> reducing non-revenue<br />
water. Old pipes must be replaced with durable pipes to avoid frequent pipe bursts <strong>and</strong> to reduce<br />
water loss due to leakages. Some of these infrastructure rehabilitation activities are already<br />
being undertaken under the NWDP II. However, there also needs to be a re-assessment of the<br />
entire water supply network, including the possibility of replacing the current water extraction<br />
system with one that relies less on electric pumps <strong>and</strong> more on gravity.<br />
13<br />
33
To meet the MDG target <strong>for</strong> water, BCC needs to focus on peri-urban <strong>and</strong> in<strong>for</strong>mal settlements<br />
where access is lagging behind <strong>and</strong> population is growing. Extending the water pipeline to cover<br />
more areas <strong>and</strong> installing additional water kiosks <strong>and</strong> WUAs are some of the activities that can<br />
improve access to potable water in LIAs. BWB must there<strong>for</strong>e continue coordinating with<br />
NGOs <strong>and</strong> other stakeholders in the provision of safe water. Furthermore, rainwater harvesting,<br />
water conservation <strong>and</strong> the re-use of water must be given increased attention. <strong>Blantyre</strong> residents<br />
need to view water as a renewable source that can be conserved <strong>and</strong> re-treated. The private<br />
sector should be encouraged to play a leading role in water harvesting <strong>and</strong> water recycling<br />
The MDG sanitation target of halving the population without access to sanitation facilities by the<br />
year 2015 is unlikely to be met in <strong>Blantyre</strong> <strong>City</strong> because many households share toilets with<br />
extended family members <strong>and</strong> neighbors. The sanitation situation in <strong>Blantyre</strong> <strong>City</strong> is particularly<br />
bleak in low-income areas, where a single toilet facility is often shared by several households,<br />
<strong>and</strong> pit latrines tend to be shallow— ideal breeding grounds <strong>for</strong> flies that transmit diseaseinducing<br />
pathogens. Some latrines in high-density unplanned areas can hardly be considered to<br />
be improved sanitation facilities, because they are made of torn sacks <strong>and</strong> plastic wrapped on<br />
sticks <strong>and</strong> thereby do not provide privacy or safety <strong>for</strong> users.<br />
Traditional sanitation methods (sewage-based systems, pit latrines, etc.) do not appear to be<br />
environmentally sustainable in <strong>Blantyre</strong>. Flush toilets, which are only used by a relatively small<br />
number of households, are not ideal, because, in a place with water scarcity, they consume a<br />
disproportionate amount of drinking water. The BCC there<strong>for</strong>e needs to consider using<br />
rainwater instead of drinking water to run toilets.<br />
The fact that many people rely on pit latrines is also problematic, partly because when pits<br />
become full, residents cap the old pit <strong>and</strong> dig another one. The reliance on shallow pit latrines in<br />
in<strong>for</strong>mal settlements is particularly troubling because there is limited space in cities, <strong>and</strong>, in<br />
places where water tables are high, pit latrines can contaminate the water supply. Pit-emptying<br />
is an attractive option, but there is a need to ensure safe transport <strong>and</strong> disposal of waste from pit<br />
latrines. In addition, fecal sludge is often dumped into sewers <strong>and</strong> treated as waste instead of as<br />
an economic resource. This is a worrying trend, because sewage from conventional systems is<br />
increasingly going untreated into the nearest waterways <strong>and</strong> polluting rivers. BCC could build<br />
additional wastewater treatment plants, which are capital <strong>and</strong> resource-intensive, but a more<br />
viable alternative would be <strong>for</strong> BCC <strong>and</strong>/or private sector partners to invest in eco-san toilets <strong>and</strong><br />
waste-to-energy technologies that trans<strong>for</strong>m fecal sludge into biogas or biodiesel fuel.<br />
Given the situation, the population needs to be sensitized to building lined <strong>and</strong> pumpable latrines<br />
<strong>and</strong> toilets such as VIP/Skyloos. Concomitantly, the use of pit latrine/septic tank emptying<br />
technologies such as the Gulper <strong>and</strong> the Nibbler should be actively promoted, particularly since<br />
the waste can be used to produce biogas <strong>and</strong> fertilizers.<br />
There is also a need to introduce a system that will reduce <strong>and</strong> discourage indiscriminate solid<br />
waste disposal <strong>and</strong> the emptying of raw sewage into surface water sources, particularly in lowincome<br />
areas. Ideally, solid waste needs to be removed from household <strong>and</strong> skips/containers at<br />
least once a week, but BCC currently does not have the capacity to collect <strong>and</strong> dispose of all the<br />
waste produced in the city. A community-based model <strong>for</strong> solid waste collection, separation <strong>and</strong><br />
34
ecycling should be considered. Finally, the BCC also need to put in place a system to separate<br />
hazardous waste from general waste.<br />
The Government of <strong>Malawi</strong>, the BCC as well as local <strong>and</strong> international partners are committed to<br />
providing adequate water <strong>and</strong> sanitation services to <strong>Blantyre</strong> <strong>City</strong> residents. Yet, <strong>Malawi</strong>’s<br />
commercial capital remains a water-stressed city, mainly due to the high levels of population<br />
growth in low-income areas, increasing dem<strong>and</strong>s on its water resources, aging infrastructure, the<br />
high pumping cost <strong>and</strong> erratic water supply. In low-income areas, access to potable water is<br />
limited <strong>and</strong> erratic, <strong>and</strong> most residents (about 60 percent) rely on kiosks, communal taps or resort to<br />
unimproved water sources. The provision of sanitary facilities <strong>and</strong> services, such as appropriate solid<br />
waste disposal, has also not been satisfactory. V<strong>and</strong>alism also needs to be addressed, because it<br />
contributes to non-revenue water.<br />
If the BCC is going to be successful, there is also a need to en<strong>for</strong>ce water <strong>and</strong> sanitation laws.<br />
BCC is already working on this <strong>and</strong> has produced building regulations that are awaiting approval<br />
by the relevant government agencies. These by-laws regulations cover, inter alia, the provision of<br />
water <strong>and</strong> sanitation services to households across the city<br />
35
REFERENCES<br />
Berman, S. (2011). “Living with Garbage.”<br />
http://thestar.blogs.com/africa/author-sarah-berman/<br />
<strong>Blantyre</strong> <strong>Water</strong> Board [BWB] (2011), Annual Report 2011. (<strong>Blantyre</strong>: BWB)<br />
- (2010), Annual Report 2010. (<strong>Blantyre</strong>: BWB)<br />
- (2008), Annual Report 2008. (<strong>Blantyre</strong>: BWB)<br />
<strong>Blantyre</strong> <strong>City</strong> Council, School Health, Nutrition <strong>and</strong> HIV/AIDS Task Team [SHNT] (2011).<br />
Baseline <strong>Assessment</strong> of School Health, Nutrition <strong>and</strong> HIV/AIDS (SHNH) Amongst Primary<br />
Schools in <strong>Blantyre</strong> <strong>City</strong>: Draft Report ( <strong>Blantyre</strong>: BCC).<br />
Chipeta, L. (2009). “The <strong>Water</strong> Crisis in <strong>Blantyre</strong> <strong>City</strong> <strong>and</strong> its impact on women: the cases of<br />
Mbayani <strong>and</strong> Ntopwa, <strong>Malawi</strong>,” Journal of International Women’s Studies, 10 (4), pp. 17-33.<br />
Chirwa, E. <strong>and</strong> Jungwe, N. (2007). Private Sector Participation in the Distribution <strong>and</strong><br />
Management of <strong>Water</strong> Services: A Study of Low Income Areas in <strong>Blantyre</strong> <strong>and</strong> Lilongwe<br />
(Lilongwe: Government of <strong>Malawi</strong> Ministry Economic Planning <strong>and</strong> Development <strong>and</strong><br />
Ministry of Irrigation <strong>and</strong> <strong>Water</strong> Development).<br />
European Union <strong>and</strong> European Investment Bank [EU&EIB] (2008). Peri-Urban <strong>Water</strong> <strong>and</strong><br />
<strong>Sanitation</strong> Project in Lilongwe <strong>and</strong> <strong>Blantyre</strong>, <strong>Malawi</strong>. Project In<strong>for</strong>mation Memor<strong>and</strong>um.<br />
(Lilongwe: Lilongwe <strong>Water</strong> Board).<br />
Gjefle, K. (2011). “<strong>Sanitation</strong> <strong>for</strong> all - an engine of economic growth <strong>for</strong> urban Africa,”<br />
Sustainable <strong>Sanitation</strong> Design (SuSan Design) <strong>and</strong> the Association <strong>for</strong> International <strong>Water</strong><br />
Studies (FIVAS).<br />
Government of <strong>Malawi</strong> (2006) <strong>Malawi</strong> Growth <strong>and</strong> Development Strategy [MGDS]: From<br />
Poverty to Prosperity (Lilongwe: Ministry Economic Planning <strong>and</strong> Development).<br />
Government of <strong>Malawi</strong> (2008) National <strong>Sanitation</strong> Policy (draft), (Lilongwe: Ministry of<br />
Irrigation <strong>and</strong> <strong>Water</strong> Development).<br />
Government of <strong>Malawi</strong> (2010) Draft <strong>Malawi</strong> Growth <strong>and</strong> Development Strategy 2011-2016<br />
[MGDS]: From Poverty to Prosperity (Lilongwe: Ministry Economic Planning <strong>and</strong><br />
Development).<br />
Government of <strong>Malawi</strong>, National Statistics Office <strong>and</strong> UNICEF [NSO & UNICEF] (2008).<br />
<strong>Blantyre</strong> Multiple Indicator Cluster Survey 2006 (Zomba: Government of <strong>Malawi</strong>).<br />
Government of <strong>Malawi</strong> (2009). Proposed Rehabilitation of the <strong>Blantyre</strong>-Zomba<br />
(M3) Road: Environmental <strong>and</strong> Social Impact <strong>Assessment</strong> Report (Lilongwe: Government of<br />
<strong>Malawi</strong>).<br />
36
Kamanga, O. (2009). “New equipment <strong>for</strong> <strong>Blantyre</strong> <strong>Water</strong> Board to reduce water crisis.”<br />
Magoya, J. (2011) “<strong>Sanitation</strong> problems in peri-urban areas in <strong>Blantyre</strong>,” <strong>Sanitation</strong> Matters, 2,<br />
pp.10-11. http://www.water<strong>for</strong>people.org/assets/pdfs/media/sanitation-matters-2011.pdf<br />
M<strong>and</strong>a, M. A. Z. (2009). “<strong>Water</strong> <strong>and</strong> sanitation in urban <strong>Malawi</strong>: Can the Millennium<br />
Development Goals be met? A study of in<strong>for</strong>mal settlements in three cities.” Human<br />
Settlements Working Paper Series. (London: Human Settlements Group International Institute<br />
<strong>for</strong> Environment <strong>and</strong> Development)<br />
Matope, J. (2000). <strong>Blantyre</strong> <strong>City</strong> Environmental Profile. UNDP, UN-HABITAT.<br />
Ministry of Irrigation <strong>and</strong> <strong>Water</strong> Development [MIWD] (2011). <strong>Malawi</strong> Irrigation, <strong>Water</strong> <strong>and</strong><br />
<strong>Sanitation</strong>: 2010 Sector Per<strong>for</strong>mance Report (Lilongwe: Government of <strong>Malawi</strong>).<br />
Ministry of Irrigation <strong>and</strong> <strong>Water</strong> Development [MIWD] (2005). National <strong>Water</strong> Policy<br />
(Lilongwe: Government of <strong>Malawi</strong>).<br />
Misunje, M. (2008). “<strong>Malawi</strong> beats MDGs targets on water,” Nation newspaper, 29 May.<br />
Mkwambisi, D. (2007). “Urban agriculture <strong>and</strong> waste management in <strong>Malawi</strong>,” (Leeds:<br />
University of Leeds).<br />
Muwamba, E. (2010). “<strong>Blantyre</strong> <strong>Water</strong> Board Fights <strong>Blantyre</strong>'s <strong>Sanitation</strong> Woes,” The Nation<br />
December 10, 2010.<br />
National Statistics Office [NSO] (2010). Statistical Yearbook (Zomba: Government of <strong>Malawi</strong>).<br />
National Statistics Office [NSO] (2009). 2008 Population <strong>and</strong> Housing<br />
Census: Final Report (Zomba: Government of <strong>Malawi</strong>).<br />
Ng’ong’ola, D. H., Wiyo, K. A.; Jumbe, C.B.L. <strong>and</strong> Kalowekamo, F. (2010). “Residential Urban<br />
<strong>Water</strong> use Study in Lilongwe <strong>and</strong> <strong>Blantyre</strong>; A Baseline Survey,” (Lilongwe: Ministry of<br />
Irrigation <strong>and</strong> <strong>Water</strong> Development).<br />
Sajidu, S.M.I., Masamba, W.R.L., Henry, E.M.T., <strong>and</strong> Kuyeli, S.M. (2007). “<strong>Water</strong> quality<br />
assessment in streams <strong>and</strong> wastewater treatment plants of <strong>Blantyre</strong>, <strong>Malawi</strong>,” Physics <strong>and</strong><br />
Chemistry of the Earth, 32 (15-18), pp.1391–1398.<br />
UN-HABITAT (2011). <strong>Malawi</strong>: <strong>Blantyre</strong> Urban Profile (Nairobi: UN-HABITAT).<br />
World Bank (2007). Project Appraisal Document <strong>for</strong> a Second National <strong>Water</strong> Development<br />
(Washington. DC: World Bank).<br />
World Bank (2008). Africa Catalytic Growth Fund (ACGF) Grant. Report No. 42385-MW<br />
(Washington. DC: World Bank).<br />
37
APPENDIX<br />
Appendix 1. BWB <strong>Water</strong> Supply Zones<br />
Source: Costly Chanza (BCC)<br />
BWB has defined 10 water supply zones within the boundaries of <strong>Blantyre</strong> <strong>City</strong> <strong>and</strong> a further two zones outside<br />
these boundaries <strong>for</strong> the Walker’s Ferry settlement <strong>and</strong> the Chileka Village area. They are:<br />
Nyambadwe supply zone; Chirimba supply zone; UNICEF tank supply area; Ndir<strong>and</strong>e supply area; Mount Pleasant<br />
supply area; Mudi clear water tank; Chichiri supply zone; Zomba supply zone; Upper Mpingwe supply zone; Lower<br />
Mpingwe supply zone; Kanjedza supply zone; <strong>and</strong> BCA supply zone.<br />
38
Appendix 1. Annual Rainfall (mm)<br />
2001 2002 2003 2004 2005 2006 2007 2008 2009 2010<br />
Average<br />
2001-2010<br />
<strong>Blantyre</strong> (Chileka Airport) 1,107 857 795 606 521 1,082 974 912 837 839 853<br />
<strong>Blantyre</strong> (Chichiri Met.) 1,257 1,130 1,182 852 871 1,316 1,261 1,069 1,124 1,293 1,136<br />
Average 1455 1330 1327 1154 1132 1468 1414 1330 1323 1381 995<br />
Source: NSO (2010) Statistical Yearbook using Department of Climate Change <strong>and</strong> Meteorological Services<br />
Appendix 2. <strong>Water</strong> Kiosks in <strong>Blantyre</strong>- Source: <strong>Water</strong> <strong>for</strong> People<br />
Ratio of water kiosks to population in the LIA- Source: <strong>Water</strong> <strong>for</strong> People<br />
Name of LIA Total Number of <strong>Water</strong> Kiosks to Population Kiosks to Household<br />
Kiosks<br />
Ratio<br />
ratio<br />
Chilobwe/Chimwan/Zingwa 9 1:2107 1: 219<br />
Bangwe/Namiyango 37 1: 1076 1: 112<br />
BCA 14 1: 1606 1:167<br />
Chigumula NA NA NA<br />
Chilomoni 14 1: 2292 1: 413<br />
Chirimba/Chileka Road 22 1: 1537 1: 160<br />
Chiwembe 2 1: 6670 1:694<br />
Kachere 29 1: 538 1: 56<br />
Kameza 3 1: 1712 1: 297<br />
Machinjiri 5 1: 7793 1: 1231<br />
Manase 6 1: 1100 1: 114<br />
Manyowe 5 1:1699 1: 177<br />
Misesa/Chensomba 1 1: 39,321 1: 4,064<br />
Mzedi 3 1: 5160 1: 950<br />
Naotcha 8 1: 1, 855 1:193<br />
Ndir<strong>and</strong>e 103 1: 1150 1: 120<br />
Sigerege 12 1: 609 1: 63<br />
Soche 8 1: 6559 1: 682<br />
Nancholi 14 1: 653 1: 68<br />
Most Low-Income Areas in <strong>Blantyre</strong> <strong>City</strong> have higher populations compared to the number of kiosks available.<br />
Note that Mapanga/Njuli <strong>and</strong> Chigumula have no kiosks at all. The situation is made worse in areas with more<br />
broken-down kiosks.<br />
Functionality of <strong>Water</strong> Kiosks in <strong>Blantyre</strong>’s LIA<br />
Frequency Percentage<br />
Functional <strong>and</strong> in good condition 86 31<br />
Functional but need repairs 130 47<br />
Broken down 62 22<br />
Total 278 100<br />
22 percent of all kiosks across all LIAs are completely broken down. Only 31 percent of kiosks can be said to be<br />
working properly at all times.<br />
39
Distribution of <strong>Water</strong> Kiosks in <strong>Blantyre</strong>’s LIA According to their Functionality<br />
Name of LIA Works well <strong>and</strong> Works but Broken down Total <strong>Water</strong><br />
in good condition needs repair<br />
Kiosks<br />
Chilobwe/Chimwan/Zingwa 1 (14%) 4 (57%) 2 (29%) 7<br />
Bangwe/Namiyango 7 (20%) 17 (49%) 11 (31%) 35<br />
BCA 5 (45%) 6 (55%) 11<br />
Chigumula 0 0 0 0<br />
Chilomoni 9 (65%) 3 (21%) 2 (14%) 14<br />
Chirimba/Chileka Road 4 (27%) 7 (50%) 3 (21%) 14<br />
Chiwembe 1 (100%) 1<br />
Kachere/Makhe.Nkol 10 (36%) 16 (57%) 2 (7%) 28<br />
Kameza 1 (33%) 2 (67%) 3<br />
Machinjiri 3 (60%) 1 (20%) 1 (20%) 5<br />
Manase 2 (33%) 4 (67%) 6<br />
Manyowe 3 (60%) 2 (40%) 5<br />
Mapanga/Njuli 0<br />
Misesa/Chensomba 1 (100%) 2<br />
Mzedi 1 (33%) 2 (67%) 3<br />
Naotcha 6 (75%) 2 (25%) 8<br />
Ndir<strong>and</strong>e 23 (22%) 49 (47%) 32 (31%) 104<br />
Sigerege 8 (67%) 3 (25%) 1 (8%) 12<br />
Soche 4 (66%) 1 (17%) 1 (17%) 6<br />
Nancholi 5 (36%) 8 (57%) 1 (7%) 14<br />
Ndir<strong>and</strong>e <strong>and</strong> Bangwe have the highest number of broken-down kiosks in the <strong>Blantyre</strong> LIAs.<br />
Availability of <strong>Water</strong> at <strong>Water</strong> Kiosks, every day of the year<br />
Name of LIA <strong>Water</strong> available every day <strong>Water</strong> not available every day<br />
Chilobwe/Chimwan/Zingwa 1 (33%) 2 (67%)<br />
Bangwe/Namiyango 3 (9%) 32 (91%)<br />
BCA 2 (14%) 12 (86%)<br />
Chigumula NA NA<br />
Chilomoni 4 (31%) 9 (69%)<br />
Chirimba/Chileka Road 2 (9%) 20 (91%)<br />
Chiwembe 0(%) 2 (100%)<br />
Kachere/Makhe.Nkol 3 (11%) 25 (89%)<br />
Kameza 1 (33%) 2 (67%)<br />
Machinjiri 2 (40%) 3 (60%)<br />
Manase 1 (17%) 5 (83%)<br />
Manyowe 0 (0%) 5 (100%)<br />
Mapanga/Njuli NA NA<br />
Misesa/Chensomba 0(0%) 1 (100%)<br />
Mzedi 0(0%) 3 (100%)<br />
Naotcha 0(%) 8 (100%)<br />
Ndir<strong>and</strong>e 5 (7%) 97 (93%)<br />
Sigerege 4 (33%) 8 (67%)<br />
Soche 1 (14%) 6 (86%)<br />
Nancholi 1 (7%) 13 (93%)<br />
40
Appendix 3: Summary of production <strong>and</strong> sales figures <strong>for</strong> 2000/01 to 2010/11 period<br />
Year<br />
2000/01<br />
2001/02<br />
*2002/03<br />
2003/04<br />
2004/05<br />
2005/06<br />
2006/07<br />
2007/08<br />
2008/09<br />
2009/10<br />
2010/11<br />
Treated<br />
water produced<br />
(Mill m 3 )<br />
25.66<br />
26.56<br />
33.86<br />
28.77<br />
30.60<br />
28.99<br />
29.38<br />
28.64<br />
29.87<br />
30.04<br />
30.91<br />
Increase as<br />
% of<br />
previous<br />
year<br />
2.89<br />
3.51<br />
**2.05<br />
5.72<br />
6.33<br />
-5.16<br />
0.39<br />
-2.52<br />
4.3<br />
0.6<br />
2.8<br />
Source <strong>Water</strong><br />
sold<br />
(Mill m 3 W.Ferry Mudi<br />
)<br />
23.25<br />
23.53<br />
30.61<br />
26.52<br />
27.03<br />
26.90<br />
25.48<br />
26.64<br />
27.47<br />
28.07<br />
28.68<br />
2.41<br />
3.03<br />
3.25<br />
2.25<br />
3.57<br />
2.09<br />
3.90<br />
1.99<br />
2.40<br />
1.97<br />
2.23<br />
16.64<br />
17.58<br />
18.81<br />
15.74<br />
15.11<br />
13.96<br />
13.77<br />
15.75<br />
15.32<br />
15:45<br />
15.21<br />
Increase<br />
as % of<br />
previous year<br />
1.90<br />
5.65<br />
**-14.35<br />
- 4.63<br />
- 4.17<br />
-7.61<br />
-1.36<br />
14.38<br />
2.7<br />
0.8<br />
-1.6<br />
Notes: * 15 months (April 2002 - June 2003) ** Daily average figures used in the comparison.<br />
41
Appendi ix 4: <strong>Water</strong> <strong>and</strong> <strong>Sanitation</strong><br />
Techno ologies<br />
St<strong>and</strong>pipe e<br />
Source: W4P W<br />
Protected Spring<br />
Source: W4P W<br />
Below: A Gulper G Being Cleaned<br />
Photo by Moumié M Maoul lidi<br />
Concrete Kioosk<br />
Source: W4PP<br />
Rainwater HHarvesting<br />
at a School<br />
Sourc ce: BCC<br />
AAdditional<br />
IIn<strong>for</strong>mationn<br />
on the Gullper<br />
is<br />
AAvailable<br />
at the Followiing<br />
Websitees:<br />
W<strong>Water</strong><br />
Aid<br />
hhttp://www.watteraid.org/uk/wwhat_we_do/suustainab<br />
lee_technologiess/technologies/<br />
/9505.asp<br />
hhttp://www.unwwater.org/statisstics_urb.html<br />
YYou<br />
Tube<br />
hhttp://www.youutube.com/watcch?v=IUoX96WWFass<br />
42
Pit Latrine Flush Toilet<br />
Ventillated Improved Latrine (VIP) EcoSan or Skyloo Toilet<br />
Septic Tank<br />
A Septic Tank is a watertight chamber<br />
made of concrete, fiberglass or plastic, <strong>for</strong><br />
the storage <strong>and</strong> treatment of black water<br />
<strong>and</strong> grey water.<br />
It should typically have at least two<br />
chambers. The first chamber should be at<br />
least half of the total length, <strong>and</strong> when<br />
there are only two chambers, it should be<br />
2/3 of the total length.<br />
43