Water and Sanitation Needs Assessment for Blantyre City, Malawi
Water and Sanitation Needs Assessment for Blantyre City, Malawi
Water and Sanitation Needs Assessment for Blantyre City, Malawi

Create successful ePaper yourself
Turn your PDF publications into a flip-book with our unique Google optimized e-Paper software.
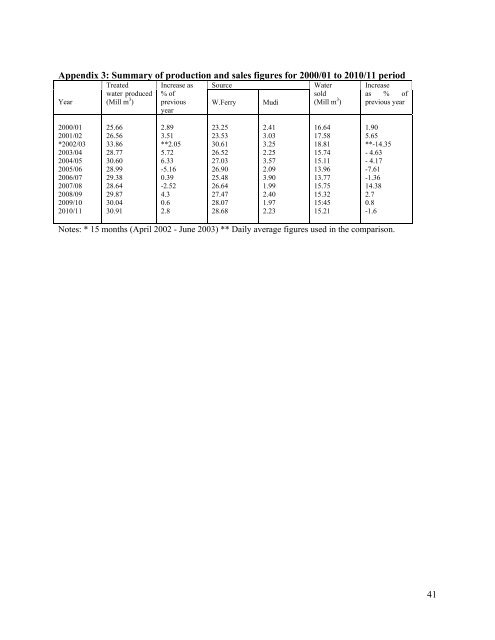
Appendix 3: Summary of production <strong>and</strong> sales figures <strong>for</strong> 2000/01 to 2010/11 period<br />
Year<br />
2000/01<br />
2001/02<br />
*2002/03<br />
2003/04<br />
2004/05<br />
2005/06<br />
2006/07<br />
2007/08<br />
2008/09<br />
2009/10<br />
2010/11<br />
Treated<br />
water produced<br />
(Mill m 3 )<br />
25.66<br />
26.56<br />
33.86<br />
28.77<br />
30.60<br />
28.99<br />
29.38<br />
28.64<br />
29.87<br />
30.04<br />
30.91<br />
Increase as<br />
% of<br />
previous<br />
year<br />
2.89<br />
3.51<br />
**2.05<br />
5.72<br />
6.33<br />
-5.16<br />
0.39<br />
-2.52<br />
4.3<br />
0.6<br />
2.8<br />
Source <strong>Water</strong><br />
sold<br />
(Mill m 3 W.Ferry Mudi<br />
)<br />
23.25<br />
23.53<br />
30.61<br />
26.52<br />
27.03<br />
26.90<br />
25.48<br />
26.64<br />
27.47<br />
28.07<br />
28.68<br />
2.41<br />
3.03<br />
3.25<br />
2.25<br />
3.57<br />
2.09<br />
3.90<br />
1.99<br />
2.40<br />
1.97<br />
2.23<br />
16.64<br />
17.58<br />
18.81<br />
15.74<br />
15.11<br />
13.96<br />
13.77<br />
15.75<br />
15.32<br />
15:45<br />
15.21<br />
Increase<br />
as % of<br />
previous year<br />
1.90<br />
5.65<br />
**-14.35<br />
- 4.63<br />
- 4.17<br />
-7.61<br />
-1.36<br />
14.38<br />
2.7<br />
0.8<br />
-1.6<br />
Notes: * 15 months (April 2002 - June 2003) ** Daily average figures used in the comparison.<br />
41