Calculator Notes for TI-89, TI-92 Plus, and Voyage 200
Calculator Notes for TI-89, TI-92 Plus, and Voyage 200
Calculator Notes for TI-89, TI-92 Plus, and Voyage 200

You also want an ePaper? Increase the reach of your titles
YUMPU automatically turns print PDFs into web optimized ePapers that Google loves.
Note 13D • Creating R<strong>and</strong>om Probability Distributions (continued) <strong>TI</strong>-<strong>89</strong>/<strong>TI</strong>-<strong>92</strong> <strong>Plus</strong>/<strong>Voyage</strong> <strong>200</strong><br />
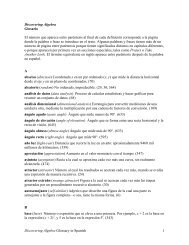
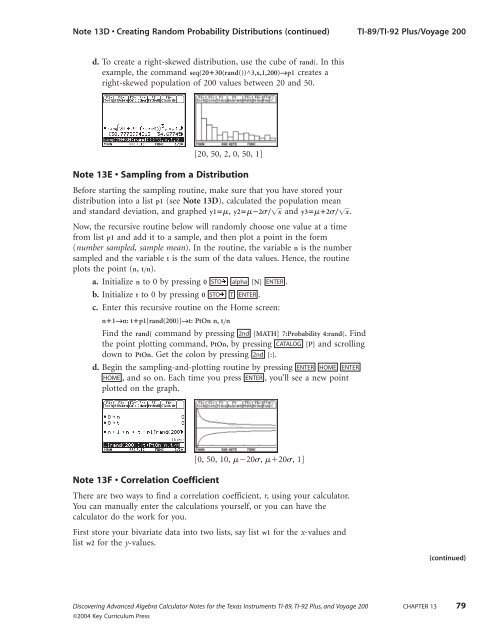
d. To create a right-skewed distribution, use the cube of r<strong>and</strong>(. In this<br />
example, the comm<strong>and</strong> seq(2030(r<strong>and</strong>())^3,x,1,<strong>200</strong>)→p1 creates a<br />
right-skewed population of <strong>200</strong> values between 20 <strong>and</strong> 50.<br />
[20, 50, 2, 0, 50, 1]<br />
Note 13E • Sampling from a Distribution<br />
Be<strong>for</strong>e starting the sampling routine, make sure that you have stored your<br />
distribution into a list p1 (see Note 13D), calculated the population mean<br />
<strong>and</strong> st<strong>and</strong>ard deviation, <strong>and</strong> graphed y1, y22x <strong>and</strong> y32x.<br />
Now, the recursive routine below will r<strong>and</strong>omly choose one value at a time<br />
from list p1 <strong>and</strong> add it to a sample, <strong>and</strong> then plot a point in the <strong>for</strong>m<br />
(number sampled, sample mean). In the routine, the variable n is the number<br />
sampled <strong>and</strong> the variable t is the sum of the data values. Hence, the routine<br />
plots the point (n, tn).<br />
a. Initialize n to 0 by pressing 0 STOÍ alpha [N] ENTER .<br />
b. Initialize t to 0 by pressing 0 STOÍ T ENTER .<br />
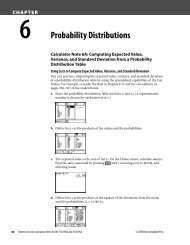
c. Enter this recursive routine on the Home screen:<br />
n1→n: tp1[r<strong>and</strong>(<strong>200</strong>)]→t: PtOn n, tn<br />
Find the r<strong>and</strong>( comm<strong>and</strong> by pressing 2nd [MATH] 7:Probability 4:r<strong>and</strong>(. Find<br />
the point plotting comm<strong>and</strong>, PtOn, by pressing CATALOG [P] <strong>and</strong> scrolling<br />
down to PtOn. Get the colon by pressing 2nd [:].<br />
d. Begin the sampling-<strong>and</strong>-plotting routine by pressing ENTER HOME ENTER<br />
HOME , <strong>and</strong> so on. Each time you press ENTER , you’ll see a new point<br />
plotted on the graph.<br />
Note 13F • Correlation Coefficient<br />
[0, 50, 10, 20, 20, 1]<br />
There are two ways to find a correlation coefficient, r, using your calculator.<br />
You can manually enter the calculations yourself, or you can have the<br />
calculator do the work <strong>for</strong> you.<br />
First store your bivariate data into two lists, say list w1 <strong>for</strong> the x-values <strong>and</strong><br />
list w2 <strong>for</strong> the y-values.<br />
Discovering Advanced Algebra <strong>Calculator</strong> <strong>Notes</strong> <strong>for</strong> the Texas Instruments <strong>TI</strong>-<strong>89</strong>, <strong>TI</strong>-<strong>92</strong> <strong>Plus</strong>, <strong>and</strong> <strong>Voyage</strong> <strong>200</strong> CHAPTER 13 79<br />
©<strong>200</strong>4 Key Curriculum Press<br />
(continued)