Calculator Notes for TI-89, TI-92 Plus, and Voyage 200
Calculator Notes for TI-89, TI-92 Plus, and Voyage 200
Calculator Notes for TI-89, TI-92 Plus, and Voyage 200

You also want an ePaper? Increase the reach of your titles
YUMPU automatically turns print PDFs into web optimized ePapers that Google loves.
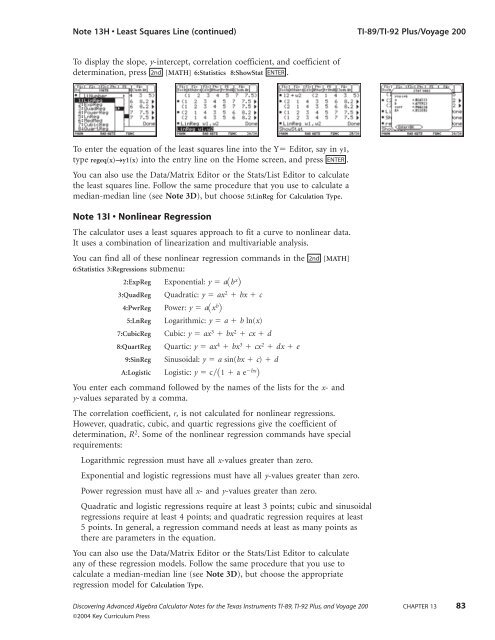
Note 13H • Least Squares Line (continued) <strong>TI</strong>-<strong>89</strong>/<strong>TI</strong>-<strong>92</strong> <strong>Plus</strong>/<strong>Voyage</strong> <strong>200</strong><br />
To display the slope, y-intercept, correlation coefficient, <strong>and</strong> coefficient of<br />
determination, press 2nd [MATH] 6:Statistics 8:ShowStat ENTER .<br />
To enter the equation of the least squares line into the Y Editor, say in y1,<br />
type regeq(x)→y1(x) into the entry line on the Home screen, <strong>and</strong> press ENTER .<br />
You can also use the Data/Matrix Editor or the Stats/List Editor to calculate<br />
the least squares line. Follow the same procedure that you use to calculate a<br />
median-median line (see Note 3D), but choose 5:LinReg <strong>for</strong> Calculation Type.<br />
Note 13I • Nonlinear Regression<br />
The calculator uses a least squares approach to fit a curve to nonlinear data.<br />
It uses a combination of linearization <strong>and</strong> multivariable analysis.<br />
You can find all of these nonlinear regression comm<strong>and</strong>s in the<br />
6:Statistics 3:Regressions submenu:<br />
[MATH]<br />
2:ExpReg Exponential: y abx 3:QuadReg Quadratic: y ax2 bx c<br />
4:PwrReg Power: y axb 5:LnReg Logarithmic: y a b ln(x)<br />
7:CubicReg Cubic: y ax3 bx2 cx d<br />
8:QuartReg Quartic: y ax4 bx3 cx2 dx e<br />
9:SinReg Sinusoidal: y a sin(bx c) d<br />
A:Logistic Logistic: y c1 a ebx 2nd<br />
<br />
You enter each comm<strong>and</strong> followed by the names of the lists <strong>for</strong> the x- <strong>and</strong><br />
y-values separated by a comma.<br />
The correlation coefficient, r, is not calculated <strong>for</strong> nonlinear regressions.<br />
However, quadratic, cubic, <strong>and</strong> quartic regressions give the coefficient of<br />
determination, R 2 .Some of the nonlinear regression comm<strong>and</strong>s have special<br />
requirements:<br />
Logarithmic regression must have all x-values greater than zero.<br />
Exponential <strong>and</strong> logistic regressions must have all y-values greater than zero.<br />
Power regression must have all x- <strong>and</strong> y-values greater than zero.<br />
Quadratic <strong>and</strong> logistic regressions require at least 3 points; cubic <strong>and</strong> sinusoidal<br />
regressions require at least 4 points; <strong>and</strong> quadratic regression requires at least<br />
5points. In general, a regression comm<strong>and</strong> needs at least as many points as<br />
there are parameters in the equation.<br />
You can also use the Data/Matrix Editor or the Stats/List Editor to calculate<br />
any of these regression models. Follow the same procedure that you use to<br />
calculate a median-median line (see Note 3D), but choose the appropriate<br />
regression model <strong>for</strong> Calculation Type.<br />
Discovering Advanced Algebra <strong>Calculator</strong> <strong>Notes</strong> <strong>for</strong> the Texas Instruments <strong>TI</strong>-<strong>89</strong>, <strong>TI</strong>-<strong>92</strong> <strong>Plus</strong>, <strong>and</strong> <strong>Voyage</strong> <strong>200</strong> CHAPTER 13 83<br />
©<strong>200</strong>4 Key Curriculum Press