Calculator Notes for TI-89, TI-92 Plus, and Voyage 200
Calculator Notes for TI-89, TI-92 Plus, and Voyage 200
Calculator Notes for TI-89, TI-92 Plus, and Voyage 200

You also want an ePaper? Increase the reach of your titles
YUMPU automatically turns print PDFs into web optimized ePapers that Google loves.
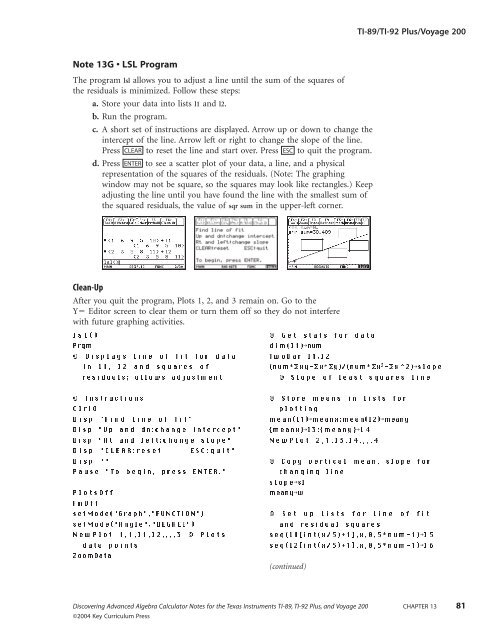
Note 13G • LSL Program<br />
The program lsl allows you to adjust a line until the sum of the squares of<br />
the residuals is minimized. Follow these steps:<br />
a. Store your data into lists l1 <strong>and</strong> l2.<br />
b. Run the program.<br />
c. A short set of instructions are displayed. Arrow up or down to change the<br />
intercept of the line. Arrow left or right to change the slope of the line.<br />
Press CLEAR to reset the line <strong>and</strong> start over. Press ESC to quit the program.<br />
d. Press ENTER to see a scatter plot of your data, a line, <strong>and</strong> a physical<br />
representation of the squares of the residuals. (Note: The graphing<br />
window may not be square, so the squares may look like rectangles.) Keep<br />
adjusting the line until you have found the line with the smallest sum of<br />
the squared residuals, the value of sqr sum in the upper-left corner.<br />
Clean-Up<br />
After you quit the program, Plots 1, 2, <strong>and</strong> 3 remain on. Go to the<br />
Y Editor screen to clear them or turn them off so they do not interfere<br />
with future graphing activities.<br />
lsl()<br />
Prgm<br />
© Displays line of fit <strong>for</strong> data<br />
in l1, l2 <strong>and</strong> squares of<br />
residuals; allows adjustment<br />
© Instructions<br />
ClrIO<br />
Disp "Find line of fit"<br />
Disp "Up <strong>and</strong> dn:change intercept"<br />
Disp "Rt <strong>and</strong> left:change slope"<br />
Disp "CLEAR:reset ESC:quit"<br />
Disp ""<br />
Pause "To begin, press ENTER."<br />
PlotsOff<br />
FnOff<br />
setMode("Graph","FUNC<strong>TI</strong>ON")<br />
setMode("Angle","DEGREE")<br />
NewPlot 1,1,l1,l2,,,,3 © Plots<br />
data points<br />
ZoomData<br />
<strong>TI</strong>-<strong>89</strong>/<strong>TI</strong>-<strong>92</strong> <strong>Plus</strong>/<strong>Voyage</strong> <strong>200</strong><br />
Discovering Advanced Algebra <strong>Calculator</strong> <strong>Notes</strong> <strong>for</strong> the Texas Instruments <strong>TI</strong>-<strong>89</strong>, <strong>TI</strong>-<strong>92</strong> <strong>Plus</strong>, <strong>and</strong> <strong>Voyage</strong> <strong>200</strong> CHAPTER 13 81<br />
©<strong>200</strong>4 Key Curriculum Press<br />
© Get stats <strong>for</strong> data<br />
dim(l1)ánum<br />
TwoVar l1,l2<br />
(num*∑xy-∑x*∑y)/(num*∑x2-∑x^2)áslope © Slope of least squares line<br />
© Store means in lists <strong>for</strong><br />
plotting<br />
mean(l1)ámeanx:mean(l2)ámeany<br />
{meanx}ál3:{meany}ál 4<br />
NewPlot 2,1,l3,l4,,,,4<br />
© Copy vertical mean, slope <strong>for</strong><br />
changing line<br />
slopeásl<br />
meanyáw<br />
© Set up lists <strong>for</strong> line of fit<br />
<strong>and</strong> residual squares<br />
seq(l1[int(x/5)+1],x,0,5*num-1)ál 5<br />
seq(l2[int(x/5)+1],x,0,5*num-1)ál 6<br />
(continued)