Bridge Management System Tall Buildings NDT - The Indian ...
Bridge Management System Tall Buildings NDT - The Indian ...
Bridge Management System Tall Buildings NDT - The Indian ...

Create successful ePaper yourself
Turn your PDF publications into a flip-book with our unique Google optimized e-Paper software.
<strong>Bridge</strong> <strong>Management</strong> <strong>System</strong><br />
<strong>Tall</strong> <strong>Buildings</strong><br />
<strong>NDT</strong><br />
Published by ACC Limited<br />
March 2012, Vol. 86, No. 3, Rs. 65
BASF India Limited<br />
Construction Chemicals Division<br />
Plot No. 37, Chandivali Farm Road, Chandivali<br />
Andheri - East, Mumbai 400072<br />
E-mail: construction-india@basf.com Website: www.basf-cc.co.in<br />
Tel: +9122 28580200 Fax: +9122 28478381
Founded in 1927<br />
Published by ACC Limited, L.B. Shastri Road, Near<br />
Teen Haath Naka, Thane (W) 400604.<br />
<strong>The</strong> contents of this journal are contributions<br />
of individual authors, and reflect their<br />
independent opinions, findings, conclusions<br />
and recommendations and do not necessarily<br />
imply that they reflect the views of the Publisher,<br />
ACC Limited. <strong>The</strong> Publishers are not liable for any<br />
damage or inconvenience, caused to anyone who<br />
may have acted on the information contained in the<br />
publication.<br />
<strong>The</strong> indian Concrete Journal, issn 0019-4565<br />
Copyright © 2012 ACC Limited.<br />
ACC Limited - Registered Office – Cement House,<br />
121, Maharshi Karve Road, Mumbai 400 020.<br />
<strong>The</strong> copyright, database rights and similar rights<br />
in all materials published in <strong>The</strong> <strong>Indian</strong> Concrete<br />
Journal are owned by ACC Limited. None of this<br />
material may be used for any commercial or public<br />
use, other than for the purpose of fair dealing,<br />
research or private study, or review of the contents<br />
of the journal, in part or in whole, and may not<br />
be reproduced or stored in any media for mass<br />
circulation without the prior written consent of the<br />
publisher.<br />
publishing / EdiTorial /<br />
advErTisEmEnT & CirCulaTion offiCE<br />
<strong>The</strong> <strong>Indian</strong> Concrete Journal<br />
ACC Limited<br />
L.B. Shastri Road,<br />
Near Teen Haath Naka<br />
Next to Eternity Mall<br />
Thane (West) 400 604,<br />
Maharashtra, INDIA.<br />
Tel: 00-91-22-33027646<br />
Website: www.icjonline.com<br />
E-mail: info@icjonline.com<br />
icj@acclimited.com<br />
Editor: A.N. Singh<br />
Editorial Team:<br />
Ulhas F. Fernandes<br />
Sushma V. Mathur<br />
for subsCripTion Tariff,<br />
please see page 2<br />
Technical Papers<br />
07<br />
13<br />
33<br />
43<br />
maRch 2012 VOLUmE 86 NUmBER 3<br />
Some studies on the effect of carbonation on the engineering properties<br />
of concrete<br />
B.B. Das, S.K. Rout, D.N. Singh and S.P. Pandey<br />
Review of inspection practices, health indices, and condition states for<br />
concrete bridges<br />
Sanjay S. Wakchaure and Kumar N. Jha<br />
Non destructive evaluation of concrete interlocking paving blocks<br />
M.C. Nataraja and Lelin Das<br />
Superposition principle invalid in IS 13920 design of slender Rc walls<br />
with boundary elements<br />
D.H.H. Rohit, P. Narahari, Arvind Kumar Jaiswal and C.V.R. Murty<br />
Features<br />
03 EdITORIaL<br />
05<br />
27<br />
39<br />
52<br />
53<br />
NEwS & EVENTS<br />
dIScUSSION FORUm<br />
TaLL BUILdINGS: a year in review : Trends of 2011 – Skyscraper<br />
completion reaches new high for fifth year running<br />
Nathaniel Hollister and Antony Wood<br />
LETTER TO ThE EdITOR<br />
POINT OF VIEw: are heritage structures in Tamilnadu seismically<br />
vulnerable?<br />
A. Veerappan<br />
MARCH 2012 ThE INdIaN cONcRETE JOURNaL<br />
1
IndIan tariff, (Rupees) 1 year 2 years 3 years<br />
Online E-Journal 400 800 1200<br />
Paper edition 750 1500 2250<br />
Online E-Journal & paper edition 1100 2200 3300<br />
This is a £ New subscription £ Renewal<br />
My preference is for £ Online E-Journal, £ Paper edition, £ Online E-Journal & paper edition. (see tariff above)<br />
<strong>The</strong> subscription may be started from the month of ____________________<br />
I enclose the payment of Rs. ____________________by cheque/demand draft no._____________________________________<br />
dated__________________ drawn in favour of 'ACC Limited'<br />
S U B S C R I B E T O D A Y!<br />
Tariff for the Year 2012<br />
Subscription Form<br />
OVERSEaS tariff, (US dollars) 1 year 2 years 3 years<br />
Online E-Journal 85 160 240<br />
Paper edition 100 190 275<br />
Online E-Journal & paper edition 120 220 320<br />
Name: _______________________________________________________________________________________________________<br />
(BLOCK LETTERS ONLY)<br />
Delivery address:_____________________________________________________________________________________________<br />
_____________________________________________________________________________________________________________<br />
_____________________________________________________________________________________________________________<br />
City/Town:_______________________________ District:______________________________ State_________________________<br />
Pin Code: ____________________________ Tel: _________________________________ Fax: ______________________________<br />
(PIN CODE IS MANDATORY)<br />
E-mail id:_____________________________________________ Website: ______________________________________________<br />
Signature: ____________________________________________ Date: _________________________________________________<br />
Kindly note that payment by cheques will be accepted for Mumbai (including Navi Mumbai and Thane areas). For those outside Mumbai, kindly<br />
send a Demand Draft of any bank payable at Mumbai. Alternatively, you could either send a cheque adding Rs. 100 (bank charges for outstation<br />
cheques) to the cheque amount. Alternatively you could send a cheque that is authorised as 'Payable at par' in Mumbai without adding bank<br />
charges of Rs. 100.<br />
Kindly send this form to <strong>The</strong> Circulation Manager, <strong>The</strong> <strong>Indian</strong> Concrete Journal, ACC Limited, L.B. Shastri Road, Near Teen Haath<br />
Naka, Next to Eternity Mall, Thane (West) 400 604, Maharashtra, INDIA. Tel: 00-91-22-33027646.<br />
For online payment and other details, please visit www.icjonline.com
Editorial<br />
Utilisation of agricultural residue in housing and<br />
construction has been investigated for many years<br />
with limited commercial success. Rice husk are a residue<br />
produced in significant quantities in India. In broad<br />
terms, one tonne of rice gives 200 kg of husk. For every<br />
1000 kg of rice husk burnt, 200 kg of ash are produced.<br />
This means rice husk ash (RHA) production rate is about<br />
40 kg per ton of rice. 1<br />
In 2009, it was estimated that the world production<br />
of rice was 480 million tonnes. 2 With India currently<br />
producing about 95 million tonnes of rice, the potential<br />
for rice husk ash in our country is about 3.5 million<br />
tonnes. 3 It was estimated that about 1/3 of the available<br />
husk in India can be collected and converted to ash for<br />
use as a Portland cement replacement. So, about one<br />
million tonne of rice husk ash is potentially available as<br />
a mineral admixture.<br />
1. Cement Replacement Materials, Rice Husk Ash, Chapter 6, by D. J. Cook,<br />
Surrey Press (1986)<br />
2. http://www.fao.org/docrep/014/am491e/am491e00.pdf<br />
3. http://www.livemint.com/2011/08/09184142/Rice-production-likely-tosurp.html<br />
Rice husk ash<br />
In the conversion process of rice husk to ash, the<br />
combustion process removes the organic matter and<br />
leaves a silica-rich reside. When rice husks are heated,<br />
weight loss occurs at 100 o C due to evaporation of<br />
absorbed water. At 350 o C, the volatiles ignite, causing,<br />
further weight loss and husks commence to burn. From<br />
400 o C to 500 o C, the residue carbon oxidises with the<br />
majority of the weight loss occurring in this period.<br />
<strong>The</strong> silica in the ash is still in an amorphous form<br />
with high reactivity. Above 600 o C, in some cases the<br />
formation of quartz may be detected. Prolonged heating<br />
at temperatures beyond 800 o C produces essentially,<br />
crystalline silica. 1<br />
<strong>The</strong> relative proportion of the forms of silica in the ash<br />
depends not only on the temperature of combustion but<br />
also the duration. Combusting husk at below 500 o C and<br />
up to 680 o C under oxidising atmosphere can produce<br />
amorphous silica provided the hold time is controlled.<br />
Apart from influencing the degree of crystallinity,<br />
the time-temperature relationship also influences the<br />
specific surface area of the ash, a parameter which is<br />
MARCH 2012 <strong>The</strong> IndIan ConCreTe Journal
closely related to the pozzolanic activity of the ash. <strong>The</strong><br />
pozzolanic behavior of rice husk ash is the ability to react<br />
with calcium hydroxide at ambient temperature in the<br />
presence of moisture to form cementitious hydration<br />
products.<br />
Several researches have offered furnace designs for the<br />
production of this kind of ash. After Mehta described the<br />
effect of pyro-processing parameters on the pozzoloanic<br />
reactivity of RHA, Pitt designed a fluidised bed furnace<br />
for controlled combustion of RHA. 4 Until recently, the<br />
RHA generated by the processes that are on the market<br />
had 3% or more graphitic carbon which gave the dark<br />
color to the material, restricting its use in architectural<br />
applications where color is the driver and leads to<br />
excessive demand from water and chemical admixtures<br />
in order to maintain appropriate slump and other<br />
properties in concrete.<br />
Recently, researchers in the USA have developed a new<br />
continuous production process of manufacturing RHA in<br />
which the rotary tube furnace was maintained in aerobic<br />
conditions at 700 o C with a residence time of 40 min to<br />
obtain off-white RHA with a carbon content of less than<br />
0.3%. 5 Another associated group has achieved this feat<br />
under a different set of conditions; using a rotary kiln<br />
furnace in which incineration of rice husk was done<br />
under oxidizing conditions at 400 o C for 4 h. 6<br />
Generally, the findings reported in the literature highlight<br />
the role of RHA as an effective pozolana that increases<br />
4. Mehta P.K., Siliceous ashes and hydraulic cements prepared therefrom,<br />
Belgium Patent 802, 909 (1973).<br />
5. Ferraro R.M., Nanni A, Vempati R.K. and Matta F., Carbon neutral off-white<br />
rice husk ash as a potential white cement replacement , Journal of Materials<br />
in Civil Engineering, October 2010, pp. 1078 -1083.<br />
6. Harish K.V, Rangaraju P.R and Vempati R.K., Fundamental Investigations<br />
into Performance of Carbon –Neutral Rice Husk Ash as Supplementary<br />
Cementitious Material, Transport Research Record: Journal of Transportation<br />
Research Board, No 2164, Transportation Research Board of the National<br />
Academies, Washington, D.C., 2010, pp 26-35.<br />
7. An V. and Ludwig H.-M, Using rice husk ash and ground granulated blastfurnace<br />
slag to replace silica fume in UHPC, Performance –based Specification<br />
for Concrete Proceedings , Editors Frank Dehn and Hans Beushausen,, MFPA<br />
Leipzig GmbH, Institute for Material Research and Testing, Leipzig, June<br />
2011, pp 80-89<br />
<strong>The</strong> IndIan ConCreTe Journal MARCH 2012<br />
Weight composition<br />
strength and durability of Portland cement mixtures<br />
and that the performance of RHA is very comparable to<br />
that of silica fume. However, the compressive strength<br />
in such reports rarely cross 50 MPa. 6<br />
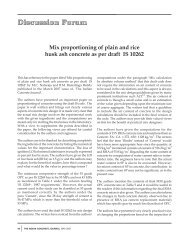
A paper published in 'Performance-based specifications for<br />
concrete' suggests that RHA can be a good supplementary<br />
material to produce ultra high performance concrete<br />
with compressive strength of 120 MPa or more. 7 <strong>The</strong><br />
typical weight composition is given in the Figure.<br />
(Water/binder ratio range : 0.21 -0.23. <strong>The</strong> mix includes<br />
1 % fibres by volume of mixture. Volume of water to<br />
volume of fine material ratio was 0.50 to 0.55.)<br />
<strong>The</strong> combination of RHA and ground granulated blast-<br />
furnace slag (GGBS) improved not only the workability<br />
but also compressive strength.<br />
<strong>The</strong> use of RHA in cement production is essentially<br />
undertaken in small village units. However, the<br />
potential for this material is quite clear from the above<br />
example. Cost reduction, performance , durability and<br />
environmental concerns are the primary characteristics<br />
that can make RHA a valid alternative to partially<br />
substitute Portland cement.<br />
quartz sand, 42%
News & Events<br />
Global Demand for<br />
Construction Aggregates<br />
to Exceed 48 Billion Metric<br />
Tons in 2015<br />
<strong>The</strong> global market for construction<br />
aggregates is expected to increase 5.2<br />
percent per year through 2015 to 48.3<br />
billion metric tons. This represents<br />
a slower rate of growth than during<br />
the 2005-2010 period, reflecting a<br />
moderation in aggregates-intensive<br />
nonbuilding construction activity.<br />
Nevertheless, demand for construction<br />
aggregates will still post solid gains<br />
from 2010 to 2015. <strong>The</strong> Asia/Pacific<br />
region will register the largest increases<br />
in product sales, as construction activity<br />
will rise rapidly, particularly in China<br />
and India. China alone will account<br />
for half of all new aggregates demand<br />
worldwide during the 2010-2015 period.<br />
<strong>The</strong>se and other trends are presented<br />
in World Construction Aggregates, a<br />
new study from <strong>The</strong> Freedonia Group,<br />
Inc., a Cleveland-based industry market<br />
research firm.<br />
Eastern Europe and the Africa/Mideast<br />
region are also expected to undergo<br />
significant growth in consumption of<br />
construction aggregates, stimulated<br />
by infrastructure development projects<br />
and strong growth in general economic<br />
activity. While the Central and South<br />
America market will climb at a somewhat<br />
slower pace, aggregates suppliers will<br />
benefit from gains in regional construction<br />
spending.<br />
Expansions in demand in developed<br />
parts of the world -- the US, Canada,<br />
Japan, Western Europe, South Korea<br />
and Australia -- will not be as strong<br />
as in most industrializing areas. This<br />
is primarily due to the already welldeveloped<br />
infrastructures found in<br />
these countries and the construction<br />
methods utilized, which tend to feature<br />
less concrete.<br />
Demand for crushed stone, sand and<br />
gravel products will post similar growth<br />
rates of just over five percent per<br />
year through 2015. As in 2010, sand<br />
will continue to make up the largest<br />
portion of global sales, followed closely<br />
by crushed stone and then gravel.<br />
Due to more restrictive land use and<br />
environmental regulations, as well as<br />
the depletion of natural aggregates<br />
reserves, sales of recycled, secondary<br />
and other aggregates will climb at an<br />
above-average pace during the 2010-<br />
2015 period. However, despite projected<br />
growth of 7.1 percent per year over this<br />
span, these products will continue to<br />
play a small role in world markets due<br />
World construction aggregates demand (million dollars) % Annual Growth<br />
Item 200 2010 201 200 -2010 2010-201<br />
Construction aggregates demand 27300 37400 48300 6. .2<br />
North America 3280 3010 3710 -1.7 4.3<br />
Western Europe 2920 2630 3050 -2.1 3.0<br />
Asia/Pacific 16000 24750 32600 9.1 5.7<br />
Other 5100 7010 8940 6.6 5.0<br />
© 2012 by <strong>The</strong> Freedonia Group, Inc.<br />
to quality concerns and limitations in the<br />
availability of feed material.<br />
World Construction Aggregates<br />
(published 01/2012, 334 pages) is<br />
available for $5900.<br />
For more details, please contact:<br />
Corinne Gangloff<br />
<strong>The</strong> Freedonia Group, Inc.,<br />
767 Beta Drive, Cleveland,<br />
OH 44143-2326, USA<br />
Tel: 440.684.9600,<br />
Fax 440.646.0484<br />
e-mail: pr@freedoniagroup.com.<br />
Web: www.freedoniagroup.com.<br />
AARCV 2012<br />
<strong>The</strong> School of Architecture and the<br />
Department of Civil Engineering,<br />
M. S. Ramaiah Institute of Technology,<br />
Bangalore, is organising an international<br />
conference on Advances In Architecture<br />
and Civil Engineering (AARCV – 2012)<br />
during June 21 to 23, 2012.<br />
Advances in Civil Engineering and<br />
Architecture are the order of the day<br />
with the rapid industrialization and<br />
urbanization seen in developed and<br />
developing nations. Innovative design and<br />
construction practices are challenging<br />
tasks to the architects and engineers<br />
to meet the ever growing demands<br />
of the society. Keeping these in mind<br />
the present international conference<br />
is being organized. <strong>The</strong> themes of<br />
the conference cover architectural,<br />
structural, geotechnical, transportation,<br />
environmental and urban planning<br />
disciplines.<br />
<strong>The</strong> event is targeted at architects,<br />
engineers, infrastructure and project<br />
managers, academicians, consultants,<br />
designers, builders, equipment and<br />
materials manufacturers, govt.,<br />
semi govt., private and autonomous<br />
MARCH 2012 <strong>The</strong> IndIan ConCreTe Journal
organisations, research scholars and<br />
students.<br />
For more details, please contact:<br />
<strong>The</strong> Convenor<br />
Dept. of Civil Engineering / Architecture<br />
M. S. Ramaiah Institute of Technology<br />
MSR Nagar, MSRIT Post, Bangalore 560 054<br />
Tel: 080-23600822, 23606934<br />
Fax: 23603124, 23606616<br />
Powder & Bulk Solids India<br />
2012<br />
Powder & Bulk Solids India 2012,<br />
formerly known as Bulk Solids India, is<br />
a conference and exhibition, that will be<br />
held from 13th to 15th March, 2012 at<br />
Ahmedabad.<br />
Powder and Bulk Solids India 2012 is a<br />
member of the international Powder &<br />
Bulk Network. <strong>The</strong> event will present<br />
basic processing technologies for powder<br />
and bulk materials, plant engineering and<br />
processing components, as well as a wide<br />
range of specialised products related to<br />
the chemical, food, pharmaceutical,<br />
cement, mining and ports industry<br />
At the powder section of the exhibition,<br />
manufacturers and suppliers of<br />
mechanical processing and material<br />
handling technologies will be showcasing<br />
solutions for conveying, transporting,<br />
storing and size reduction as well as<br />
screening and mixing and the granulation<br />
for powder and bulk solids in the various<br />
industries.<br />
<strong>The</strong>re conference and workshop that will<br />
focus on two main topics: “From Port to<br />
Plant. Challenges in Power Generation”,<br />
which addresses the bulk sector, and<br />
“Powder & Granules in Chemicals<br />
and Plastics Production – Innovative<br />
Approaches for Optimum Results”<br />
addressing the powder sector.<br />
For more details, please contact:<br />
Ms. Priya Sharma<br />
Indo-German Chamber of Commerce<br />
New Delhi, India<br />
Tel: +91-11-47168830<br />
E-mail : priya@indo-german.com<br />
Web: www.powderbulksolidsindia.com<br />
6<br />
<strong>The</strong> IndIan ConCreTe Journal MARCH 2012<br />
Pre-Engineered <strong>Buildings</strong><br />
<strong>The</strong> <strong>Indian</strong> <strong>Buildings</strong> Concrete is holding<br />
its mid term seminar on the theme ‘‘Pre-<br />
Engineered <strong>Buildings</strong> and Innovative<br />
Techniques in Construction Industry’’<br />
during May 25-26, 2012 at Kolkata.<br />
<strong>The</strong> sub-themes of the event are as<br />
follows:-<br />
1.<br />
2.<br />
3.<br />
4.<br />
5.<br />
6.<br />
7.<br />
Scope for use of Pre-<br />
Engineered <strong>Buildings</strong>;<br />
Pre-Engineered Metal<br />
<strong>Buildings</strong>;<br />
Pre-Engineered RCC <strong>Buildings</strong>;<br />
Innovative Techniques in<br />
Construction Industry – Design<br />
Related;<br />
Innovative Techniques<br />
in Construction Industry<br />
– Construction Related;<br />
Innovative Techniques<br />
in Construction Industry<br />
– Maintenance Related and<br />
Case Studies<br />
An abstract of the paper not exceeding<br />
200 words may please be sent to us,<br />
so as to reach us by March 15, 2012.<br />
We expect full paper to be received<br />
within three weeks of communication of<br />
acceptance of the abstract.<br />
For more details, please contact:<br />
P.S. Chadha<br />
<strong>Indian</strong> <strong>Buildings</strong> Congress<br />
Sector VI, R.K. Puram,<br />
New Delhi 110022<br />
Tel: 011-26169531, 26170197<br />
Fax: 011-026196391<br />
Website: www.ibc.org.in<br />
E-mail: info@ibc.org.in<br />
<strong>Indian</strong> carbon nanotubes in<br />
Forbes 30 listing<br />
Vivek Nair, 23, founder, Damascus<br />
Fortune, a Mumbai-based start-up<br />
says "I got listed in Forbes’ ‘30 Under<br />
30’ under the energy category. Carbon<br />
nanotubes are the strongest and stiffest<br />
material known, with a strength-toweight<br />
ratio 117 times greater than<br />
steel. Our company has developed<br />
a technology that converts carbon<br />
emissions from automotive and industrial<br />
plants to produce carbon nanotubes and<br />
nanofibres. One needs to have courage<br />
to initiate things. Due to the cost, I had<br />
to face adminstrative hurdles to make<br />
carbon nanotubes in the university<br />
laboratory. So, I converted flue gas<br />
from Maruti Modern rice mill, and<br />
Neyveli Lignite Corporation’s thermal<br />
power station to carbon nanotubes<br />
and nanofibres. It was a miracle. I<br />
was born in Kerala, and completed<br />
bioengineering in T amil Nadu. Now a<br />
doctoral research student at Singapore’s<br />
Nanyang Technological University. I<br />
am, along with 15 people, working on<br />
developing the technology and finding<br />
new applications such as strong body<br />
parts of buildings, automobiles, ships<br />
and aircraft. Our aim is to install the<br />
technology in almost all flue gas-emitting<br />
industrial plants in India, Middle East,<br />
Africa, Asia Pacific, Europe and US.<br />
This will help reduce global warming on<br />
a large scale and monetise the carbon<br />
nanotubes."<br />
– <strong>The</strong> Economic Times 03.02.2012<br />
Global Cement Expo 2012<br />
Global Cement is pleased to announce<br />
the launch of the Global Cement Expo<br />
2012 (www.GlobalCementExpo.com),<br />
which will take place at the Targi w<br />
Krakowie exhibition centre in Krakow,<br />
Poland, on 14-15 June 2012.<br />
<strong>The</strong> Global Cement Expo will include a<br />
free seminar programme with parallel<br />
sessions that will cover wear and<br />
maintenance, alternative fuels including<br />
RDF and MSW, waste heat recovery<br />
options (ORC and Kalina cycle),<br />
electrical energy efficiency, refractories,<br />
quality control, environmental impact<br />
abatement, mortars and alternatives<br />
to OPC.<br />
For more details, please contact:<br />
Dr. Robert McCaffrey<br />
PRo Publications International Ltd<br />
First Floor, Adelphi Court<br />
1 East Street, Epsom, Surrey<br />
KT17 1BB, UK<br />
e: rob@propubs.com<br />
t: +44-1372840951
Some studies on the effect of<br />
carbonation on the engineering<br />
properties of concrete<br />
This paper reports the effect of carbonation on three<br />
different grades of concrete each cured for 28, 56, 90<br />
and 120 days. Carbonation was carried out by placing<br />
the specimens in a chamber of 10% carbon dioxide for<br />
150 days. <strong>The</strong> tests included compressive strength<br />
and porosity measurement using a compression<br />
testing machine and mercury intrusion porosimeter<br />
respectively. In addition, electrical conductivity was<br />
measured following ASTM C 1202. <strong>The</strong> results indicate<br />
that carbonation increases the compressive strength and<br />
decreases the porosity and electrical conductivity of the<br />
specimen. <strong>The</strong> results give factors for estimating concrete<br />
performance between carbonated and non-carbonated<br />
specimens.<br />
Keywords: Concrete, carbonation, electrical conductivity,<br />
porosity, and laboratory studies.<br />
Introduction<br />
It is well known that carbonation affects the durability<br />
of concrete, involves CO 2 reaction with the hydration<br />
products of cement to reduce the pH of the concrete<br />
pore solution from about 12 to less than 9 and causes<br />
B.B. Das, S.K. Rout, D.N. Singh and S.P. Pandey<br />
the formation of calcium carbonate. 1-3 <strong>The</strong> following<br />
equation describes the reaction. 4<br />
MARCH 2012 <strong>The</strong> IndIan ConCreTe Journal<br />
......(1)<br />
Researchers have found that the reaction consumes<br />
Ca(OH) 2 from the hydrated paste as calcium silicate<br />
hydrates (CSH) liberating CaO to maintain the<br />
equilibrium. In addition, concrete‘s residual unhydrated<br />
cement compounds such as C 3 S and C 2 S react with CO 2<br />
in the presence of H 2 O further carbonating the concrete. 5<br />
In this manner, the reaction destroys the passivity of<br />
concrete making it prone to corrosion. <strong>The</strong> literature<br />
has several reports on changes in concrete’s physicomechanical<br />
and durability properties resulting from<br />
carbonation. 6-13<br />
Concrete’s conductivity is used to determine its<br />
service life in corrosive environments. Both American<br />
Association of State Highway and Transportation<br />
Officials (AASHTO) and American Society for Testing<br />
and Materials (ASTM 2008) have standardised tests<br />
for electrical conduction (Q). Rapid chloride ion
permeability test (RCPT) is one such well known test<br />
that measures the cumulative electrical charge passing<br />
through a specimen subjected to a 60 V potential for 6<br />
hours.<br />
This paper attempts to understand the influence of<br />
carbonation on the compressive strength, electrical<br />
conductivity and microstructure of concrete.<br />
Materials<br />
Ordinary Portland cement (OPC) conforming to<br />
ASTM Type-I cement was used in this study. <strong>The</strong><br />
fine-aggregates conformed to Zone-III of BS 882 and<br />
had a fineness modulus of 1.99. 14 <strong>The</strong> maximum size<br />
of coarse-aggregates was 20 mm. Table 1 presents the<br />
specific gravity of these materials determined using<br />
an ultra-pycnometer (make Quantachrome, USA). <strong>The</strong><br />
particle-size distribution of the cement was determined<br />
using a Granulometer (Model No. 920, CILAS), which<br />
works on the principle of laser diffraction. Figure 1<br />
shows the particle-size distribution of cement and that<br />
of fine and coarse aggregates determined according to<br />
ASTM C 136-01. 15<br />
<strong>The</strong> fineness of the cement was determined using<br />
Blaine’s air-permeability apparatus following ASTM C<br />
204-00 (Table 1). 16<br />
<strong>The</strong> chemical composition of OPC was determined<br />
using an X-Ray Fluorescence setup and the results are<br />
<strong>The</strong> IndIan ConCreTe Journal MARCH 2012<br />
presented in Table 2. <strong>The</strong> mineralogical composition<br />
of the OPC was determined with the help of an X-Ray<br />
diffraction spectrometer (make D8 Advance-Bruker, AXS<br />
Germany), which employed a graphite monochromator<br />
and Cu-Kα source. <strong>The</strong> sample was scanned from 5°<br />
to 60°. <strong>The</strong> various compounds present in the cement<br />
composition were identified with the help of TOPAS<br />
software (Table 3). 17<br />
Table 1. Physical properties of the materials used in the<br />
study<br />
Material Specific<br />
gravity<br />
Fineness,<br />
m 2 /kg<br />
Ordinary Portland Cement 3.16 294<br />
Coarse<br />
aggregate<br />
Fine aggregate 2.71 NA<br />
NA - Not applicable<br />
10 mm 2.79 NA<br />
20 mm 2.77 NA<br />
Table 2. Chemical composition of the ordinary Portland<br />
cement<br />
Oxide % by weight<br />
Al2O3 5.55<br />
CaO 60.46<br />
Fe2O3 4.98<br />
K2O 0.487<br />
MgO 1.27<br />
Na2O 0.232<br />
SiO2 20.89<br />
(SiO2 +Al2O3 +Fe2O3 ) 31.42<br />
(SiO2 +Al2O3 ) 26.44<br />
LOI 2.26<br />
Table 3. Phases present in the ordinary Portland cement<br />
Compound % by weight<br />
C 3 S 59.38<br />
C 2 S 24.58<br />
C 3 A 5.11<br />
C 4 AF 10.37<br />
Table 4. Mix proportions for different grades of<br />
concrete<br />
Mix<br />
Designation<br />
Cement<br />
content,<br />
kg/m 3<br />
w/c Mix proportion<br />
(OPC: W: FA: CA)<br />
Compacting<br />
factor<br />
C1 300 0.55 1:0.55:2.06:4.37 0.90<br />
C2 320 0.45 1:0.48:1.98:4.60 0.84<br />
C3 360 0.40 1:0.40:1.88:4.59 0.82
Testing methodology<br />
<strong>The</strong> details of the mix and their designation are presented<br />
in Table 4. <strong>The</strong> mixing was done in a rotary mixer for<br />
about 2 minutes. <strong>The</strong> desired compaction of concrete was<br />
achieved with the help of a table vibrator. <strong>The</strong> samples<br />
were first cured at 95±5% relative humidity and 27±2 ˚C.<br />
After 24 h, the cubes were de-molded and cured under<br />
water at 27±2˚C. Four curing periods (t = 28, 56, 90 and<br />
120 days) were chosen for this study. <strong>The</strong> compressive<br />
strength of the cubes at the end of each curing period was<br />
determined by employing an automatic compression<br />
testing machine. Table 5 presents the results.<br />
Cubes of 150 mm and 100 mm were used for determining<br />
the compressive strength (f c ) and the carbonation depth<br />
(d), respectively. In addition, 150 mm×150 mm×700<br />
mm beams ( one beam or more than one ?) were cast<br />
for extracting several cylindrical cores for conducting<br />
the rapid chloride ion penetration test; before and after<br />
carbonation.<br />
<strong>The</strong> porosity (η) of concrete was determined with the<br />
help of an auto scan mercury intrusion porosimeter<br />
which operated up to 60,000 psi (414 MPa). <strong>The</strong> technique<br />
involves the intrusion of mercury (Hg) at high pressure<br />
into a specimen through the use of a penetrometer. Hg<br />
does not penetrate into the pores until such a pressure<br />
is applied that forces the liquid into the pores. <strong>The</strong><br />
ratio between the applied pressure and the size of the<br />
pores is defined by Washburn’s equation, where the<br />
pore diameter is inversely proportional to the applied<br />
pressure: the higher the pressure, the smaller are the<br />
pores into which it is possible to intrude the liquid. <strong>The</strong><br />
mercury intrusion porosimetry procedure for concrete<br />
samples was published earlier. 18<br />
accelerated carbonation studies<br />
Cured cubes and cores extracted from the beams were<br />
taken out of the curing tank and stored at 60% relative<br />
humidity and 27˚ C for 15 days to stabilise their internal<br />
humidity. 19 <strong>The</strong>se specimens were next transferred to an<br />
a chamber containing 10% concentration of CO 2 at 27˚ C<br />
Table 5. Compressive strength of different grades of<br />
the concrete<br />
Curing period<br />
Compressive Strength, MPa<br />
days<br />
C1 C2 C3<br />
28 31.76 42.81 51.20<br />
56 38.06 46.14 53.82<br />
90 39.44 46.25 54.13<br />
120 40.12 47.82 56.48<br />
and 65% relative humidity for accelerated carbonation.<br />
(<strong>The</strong> CO 2 concentration in the air is about 0.03%). To<br />
provide an uninterrupted ingress of CO 2 , the specimens<br />
were placed on a wire mesh. After 150 days of exposure<br />
(T=150), cubes were taken out of the chamber and cut<br />
into two equal parts in the direction perpendicular to<br />
the plane of casting. Next, the depth of carbonation was<br />
determined by spraying 1% phenolphthalein in 70%<br />
ethyl alcohol that changes from colourless to purple<br />
when pH is >9. 20<br />
So the colour of the carbonated portion of the specimen<br />
remained unchanged, while that of the uncarbonated<br />
portion became purple. Based on this, the average<br />
depth of the carbonation in the cubes (corresponding<br />
to the four cut faces of the cube) was measured. <strong>The</strong><br />
average of three results gave the carbonation depth d<br />
for a particular grade of concrete. <strong>The</strong> carbonated cores<br />
were subjected to rapid chloride ion permeability test<br />
as described below.<br />
rapid chloride ion penetration test<br />
<strong>The</strong> test apparatus used was from Control, Italy and<br />
conformed to ASTM C-1202. 21 <strong>The</strong> test method involved<br />
obtaining a 100 mm diameter core or cylinder sample<br />
from the concrete being tested. A 50 mm specimen was<br />
cut from the sample. <strong>The</strong> side of the cylindrical specimen<br />
was coated with epoxy, and after the epoxy dried out, it<br />
was put in a vacuum chamber for 3 hours. <strong>The</strong> specimen<br />
was vacuum saturated for 1 hour and allowed to soak<br />
for 18 hours. It was then placed in the test device. <strong>The</strong><br />
left-hand side (–) of the test cell was filled with a 3%<br />
NaCl solution. <strong>The</strong> right-hand side (+) of the test cell<br />
was filled with 0.3N NaOH solution. <strong>The</strong> system was<br />
then connected and a 60-volt potential was applied for 6<br />
hours. Readings were taken every 30 minutes. At the end<br />
of 6 hours the sample was removed from the cell and the<br />
amount of coulombs passed through the specimen was<br />
calculated. Table 6 shows the chloride ion permeability<br />
following ASTM C 1202.<br />
Table 6. Chloride Ion permeability based on charge<br />
passed (ASTM C 1202)<br />
Charge passed,<br />
Coulomb<br />
Chloride<br />
permeability<br />
Typical concrete<br />
>4000 High High w/c (>0.60)<br />
2000-4000 Moderate Moderate w/c (0.40-0.50)<br />
1000-2000 Low Low w/c (
<strong>The</strong> average charge Q (in Coulomb) from three identical<br />
cores of a specific grade of concrete was taken as the<br />
electrical conductivity of that grade of concrete.<br />
results and discussions<br />
Carbonation depth<br />
Table 7 presents the carbonation depth results. <strong>The</strong><br />
carbonation resistance of the concrete can be expressed<br />
using Fick’s first law of diffusion as under 11<br />
d = K (t) 0.5<br />
10<br />
<strong>The</strong> IndIan ConCreTe Journal MARCH 2012<br />
......(2)<br />
where, d is the carbonation depth in mm and t is<br />
the curing period in weeks and K is the carbonation<br />
coefficient expressed in mm/weeks 0.5 .<br />
Table 7. Carbonation depth for different grades of<br />
concrete specimens<br />
t<br />
(days)<br />
Table 8. Compressive strength of different grades of<br />
non-carbonated and carbonated concrete<br />
t<br />
(days)<br />
T=150<br />
Carbonation depth, d (mm) % reduction<br />
C1 C2 C3 C1 C2 C3<br />
28 28.2 24.2 19 NA NA NA<br />
56 25 22.1 16.5 11.35 8.68 13.16<br />
90 22.2 19 13 21.28 21.49 31.58<br />
120 18.6 15.2 10 34.04 37.19 47.37<br />
NA - Not applicable<br />
f c (MPa)<br />
T = 0 (Non- carbonated<br />
concrete)<br />
T = 150 (Carbonated<br />
concrete)<br />
C1 C2 C3 C1 C2 C3<br />
28 31.76 42.81 51.20 41.79 54.19 64.00<br />
56 38.06 46.14 53.82 49.43 56.96 65.63<br />
90 39.44 46.25 54.13 51.22 56.40 66.01<br />
120 40.12 47.82 56.48 50.15 57.61 68.88<br />
Table 9. Ratio of the properties of non-carbonated<br />
concrete to carbonated concrete<br />
t<br />
fc Q η<br />
(Days)<br />
C1 C2 C3 C1 C2 C3 C1 C2 C3<br />
28 0.76 0.79 0.80 3.24 3.06 2.96 1.04 1.12 1.16<br />
56 0.77 0.81 0.82 2.89 2.86 2.78 1.04 1.18 1.18<br />
90 0.77 0.82 0.82 2.75 2.71 2.61 1.05 1.20 1.20<br />
120 0.80 0.83 0.82 2.65 2.62 2.56 1.10 1.20 1.23<br />
Figure 2 is a plot of carbonation coefficient and curing<br />
period at three levels of water to cement ratios. This<br />
figure suggests that w/c ratio has a strong influence<br />
on the carbonation resistance of concrete. With w/c<br />
decreasing from 0.55 to 0.40 carbonation coefficient<br />
K reduced by a factor of 3. <strong>The</strong> data on carbonation<br />
depth and curing in Table 7 suggests that curing period<br />
plays an important role in developing the carbonation<br />
resistance of concrete. <strong>The</strong> reduction in carbonation<br />
ranged from about 8% to about 47%. Considering the<br />
28 day specimen as control, the carbonation depth in the<br />
specimen of w/c ratio 0.55 reduced by 11.35%, 21.28%<br />
and 34% at 56, 90 and 120 day respectively.<br />
Compressive strength<br />
Table 8 presents the compressive strength of both<br />
carbonated and non carbonated specimens. From this<br />
table, it is evident that carbonation leads to an increase<br />
in compressive strength. <strong>The</strong> formation of CaCO 3<br />
which is known to occupy more volume than Ca(OH) 2 ,<br />
reduces the porosity in concrete resulting in a higher<br />
compressive strength. <strong>The</strong> results show the strength<br />
improvement is more in the case of low strength<br />
concrete. <strong>The</strong> compressive strength of the carbonated<br />
concretes increased as compared to the non carbonated<br />
concretes. Table 9 shows that the compressive strength<br />
ratio of non carbonated concrete to carbonated concrete<br />
at 28 days is lower by 0.76, 0.79, and 0.80 for w/c ratio<br />
of 0.55. 0.45 and 0.40 respectively. <strong>The</strong>se ratio reduction<br />
can be considered as the factors to be used to determine<br />
the actual compressive strength of carbonated concretes<br />
in structures. However, Table 9 data is not a clear<br />
function of curing period t. It means the carbonation<br />
has less influence on the compressive strength if the
concrete is cured for a longer time. A lower concrete<br />
porosity resulting from a longer curing time explains<br />
this observation.<br />
electrical conductivity<br />
Figures 3 and 4 show the electrical conductivity of non<br />
carbonated and carbonated specimens respectively. <strong>The</strong><br />
specimens' curing period and water to cement ratios<br />
were varied. It can be observed from the figures that<br />
the electrical conductivity of the carbonated concrete<br />
decreased by a factor of 3 as compared to that of the<br />
non-carbonated concrete. Figure 4 suggests that the<br />
electrical conductivity deceased as the grade of concrete<br />
increased. It can also be noted from Table 9 that the<br />
electrical conductivity of carbonated concrete cured for<br />
28 days decreased by a factor of 3.24, 3.06 and 2.96 for<br />
w/c ratio of 0.55, 0.45 and 0.40 respectively. <strong>The</strong> reducing<br />
chloride ion penetration indicates that carbonation<br />
of higher grades of concrete results in decreasing the<br />
specimen’s porosity. It can be observed from Figure 4<br />
that the electrical conductivity is inversely proportional<br />
to curing period (t). At the w/c ratio of 0.40 the electrical<br />
conductivity of carbonated concrete decreased by a<br />
factor of 2.96, 2.78, 2.61 and 2.56 for curing period of<br />
28, 56, 90 and 120 days respectively. So carbonated<br />
specimens with longer curing periods show reduced<br />
electrical conductivity.<br />
Porosity<br />
Figures 5 and 6 show the effect of carbonation on the<br />
porosity of non-carbonated and carbonated specimens<br />
respectively. It can be observed from the figures that<br />
the porosity is inversely related to w/c ratio for both<br />
carbonated and non-carbonated concretes. <strong>The</strong> porosity<br />
MARCH 2012 <strong>The</strong> IndIan ConCreTe Journal<br />
11
eduction factors of 28 day specimens was 1.04, 1.12 and<br />
1.16 times for w/c ratio of 0.55, 0.45 and 0.40 respectively.<br />
<strong>The</strong> factors for other specimens are given in Table 9.<br />
Based on the porosity of non-carbonated specimens<br />
cured for 28 days, the porosity of both carbonated and<br />
non carbonated concrete decreased with increasing<br />
curing period as tested. In comparison to the noncarbonated<br />
concrete, for the w/c ratio of 0.40 the porosity<br />
for carbonated concrete decreased by a factor of 1.16,<br />
1.18, 1.20 and 1.23 at 28 days, 56 days, 90 days and 120<br />
days respectively (Table 9).<br />
Conclusions<br />
<strong>The</strong> following conclusions can be drawn from this<br />
experimental work:<br />
12<br />
1.<br />
2.<br />
3.<br />
Both carbonation coefficient and depth decreased<br />
with the increase in the curing period. <strong>The</strong><br />
compressive strength increased with the<br />
increase in the curing period and decrease in the<br />
water /cement ratios.<br />
Under these conditions of w/c ratio and curing<br />
periods, the electrical conductivity of the<br />
carbonated concrete decreased by a factor of 3<br />
compared to the non-carbonated specimen.<br />
As the curing period increased, the porosity<br />
decreased in both carbonated and non carbonated<br />
concrete specimens. Also there was a reduction in<br />
the porosity with the lowering of water/cement<br />
ratios. <strong>The</strong> factor of reduction was different for<br />
carbonated and non-carbonated specimens.<br />
<strong>The</strong> difference could be due to the extent of<br />
carbonation and resulting CaCO 3 formation.<br />
references<br />
1.<br />
2.<br />
3.<br />
4.<br />
5.<br />
6.<br />
7.<br />
Haque, M. N., and Kawamura, M., “Carbonation and Chloride-induced<br />
Corrosion of Reinforcement in Fly Ash Concretes,” ACI Materials Journal,<br />
Vol. 89 (1), 1993, pp. 41-48.<br />
Ihekwaba, N. M., Hope, B. B., and Hansson, C. M., “Carbonation and<br />
Electrochemical Chloride Extraction from Concrete”, Cement and Concrete<br />
Research, Vol. 26 (7), 1996, pp. 1095–1107.<br />
Basheer, P. A. M., Chidiac, S. E., and Long, A. E., “Predictive Models for<br />
Deterioration of Concrete Structures”, Construction and Building Materials,<br />
Vol. 10, 1996, pp. 27–37.<br />
Johannesson, B., and Utgenannt, P., “Microstructural Changes Caused by<br />
Carbonation of Cement Mortar”, Cement and Concrete Research, Vol.31, 2001,<br />
pp. 925-931<br />
Claisse, P. A., El-Sayad, H., and Shaaban, I. G., “Permeability and Pore<br />
Volume of Carbonated Concrete”, ACI Materials Journal, Vol.96 (3), 1999,<br />
pp. 378-381.<br />
Jerga, J., “Physico-mechanical Properties of Carbonated Concrete’,<br />
Construction and Building Materials, Vol.18, 2004, pp. 645-652.<br />
Silva, C. A. R., Reis, R. J. P., Lameiras, F. S. And Vasconcelos, W. L.,<br />
“Carbonation-Related Microstructural Changes in Long-Term Durability<br />
Concrete”, Materials Research, Vol. 5 (3), 2002, pp. 287-293.<br />
<strong>The</strong> IndIan ConCreTe Journal MARCH 2012<br />
8. Xiao, J., Li, J., Zhu, B., and Fan, Z., “Experimental Study on Strength and<br />
Ductility of Carbonated Concrete Elements”, Construction and Building<br />
Materials, Vol. 16, 2002, pp. 187-192.<br />
9. Chang, C. F., and Chen, J. W., “Strength and Elastic Modulus of Carbonated<br />
Concrete”, ACI Materials Journal, Vol. 102 (5), 2005, pp. 315-321.<br />
10. Song, H. W., and Kwon, S. J., “Permeability Characteristics of Carbonated<br />
Concrete Considering Capillary Pore Structure”, Cement and Concrete<br />
Research, Article in press.<br />
11. Valcuende,M. and Parra,C., “Natural Carbonation of Self Compacting<br />
Concrete”, Construction and Building Materials, Vol. 24 (5), 2010, pp. 848-<br />
853.<br />
12. Vaysburd, A. M., Sabnis, G. M., and Emmons, P. H., “Concrete Carbonation—<br />
A Fresh Look,” <strong>Indian</strong> Concrete Journal, V. 67, No. 5, May 1997, pp. 215-220.<br />
13. Chi, J.M., Huang, R., and Yang, C. C., “Effects Of Carbonation On Mechanical<br />
Properties And Durability Of Concrete Using Accelerated Testing Method”,<br />
Journal of Marine Science and Technology, Vol. 10, No. 1,2002, pp. 14-20.<br />
14. ______BS 882. “Specification for Aggregates from Natural Source for<br />
Concrete”, British Standards Institution, London, 1992.<br />
15. ______ASTM C 136-01, “Standard Test Method for Sieve Analysis of Fine<br />
and Coarse Aggregates, Annual book of ASTM Standards”, Vol. 04.02, ASTM,<br />
West Conshohocken, PA, 2002.<br />
16. ______ASTM C 204-00, “Standard Test Method for Fineness of Hydraulic<br />
Cement by Air-Permeability Apparatus”, Annual book of ASTM Standards,<br />
Vol. 04.01, ASTM, West Conshohocken, PA, 2002.<br />
17. TOPAZ 2.1, “Diffract Plus”, Bruker AXS GmbH, Karlsruhe, Germany, 2003.<br />
18. Das, B. B., Singh, D. N., and Pandey, S. P., “Characterization of Concrete<br />
by three ASTM Specified Techniques for Determination of Pore Volume”,<br />
<strong>Indian</strong> Concrete Journal, December 2010.<br />
19. Sulapha, P., Wong, S. F., Wee, T. H., and Swaddiwudhipong, S., “Carbonation<br />
of Concrete Containing Mineral Admixtures”. Journal of Materials in Civil<br />
Engineering, ASCE, Vol. 15 (2), 2003, pp. 134-143.<br />
20. ______CPC-18. “Measurement of Hardened Concrete Carbonation Depth”,<br />
Materials and Structures, Vol. 17 (6), 1988, pp. 453-455.<br />
21. ______ASTM C 1202, “Standard test method for electrical indication of<br />
concrete’s ability to resist chloride ion penetration.” Annual book of ASTM<br />
Standards, Vol. 04.02, ASTM, West Conshohocken, PA, 2002.<br />
Dr. B.B. Das is an Associate Professor at KIIT<br />
Deemed University, Bhubaneswar, He has been<br />
a Post-Doctoral Research Associate and Adjunct<br />
Professor in the Department of Civil Engineering<br />
at Lawrence Technological University, Southfield,<br />
Michigan, USA. His areas of research include<br />
microstructure characterization of materials, nondestructive<br />
testing of concrete, corrosion of reinforcement<br />
and durability studies on concrete.<br />
S.K. Rout is a Graduate Student at the<br />
Department of Civil Engineering, Lawrence<br />
Technological University, Southfield, Michigan,<br />
USA. His present area of research interest is in<br />
structural engineering and structural materials.<br />
Dr. D.N. Singh holds a Civil Engineering from<br />
IIT Kanpur and PhD. in Geotechnical Engineering.<br />
He is a Professor in the Department of Civil<br />
engineering, <strong>Indian</strong> Institute of Technology,<br />
Mumbai. His major research focus is in the field<br />
of Environmental Geotechnology.<br />
Dr. S.P. Pandey holds a PhD in solid-state<br />
chemistry from Gorakhpur University, U.P. He is<br />
Vice President of Central R&D, UltraTech Cement<br />
Ltd., Mumbai. His research interests are in<br />
Cement chemistry and material science.
Review of inspection practices, health<br />
indices, and condition states for<br />
concrete bridges<br />
A bridge is a structure built to span physical obstacles<br />
such as a body of water, valley, road or railway for the<br />
purpose of providing passage over the obstacle. A weak<br />
bridge can either reduce the load carrying capacity or<br />
compromise on safety, hindering the flow of traffic and<br />
affecting the economy. Hence, it is necessary to maintain<br />
the traffic-worthiness of bridges with requisite levels of<br />
safety and serviceability. However, those responsible<br />
for such works often feel that the funds made available<br />
to them are insufficient. One of the ways to address<br />
this challenge is to utilise the available resources in an<br />
optimal manner using scientific methods and tools.<br />
Instituting a bridge management system or BMS is a<br />
good way for managing design, construction, operation<br />
and maintenance of bridges. Many countries have<br />
developed such systems. A BMS guides the decision<br />
making processes regarding the maintenance, planning<br />
by ascertaining the present condition and pointing out<br />
the immediate maintenance requirements of a bridge.<br />
It does not wholly rely on the physical condition of<br />
bridges, which is often described by discrete condition<br />
states on the basis of visual inspection. Since the results<br />
of visual inspection are subjective and vary according<br />
to the knowledge and judgment of the bridge inspector,<br />
most BMS systems make use indices as one of the tools<br />
for decision making.<br />
Keywords: <strong>Bridge</strong> management system, bridge inspection,<br />
condition states, bridge health index<br />
Sanjay S. Wakchaure and Kumar N. Jha<br />
This paper compares the condition states and bridge<br />
indices used by various countries. Included in the paper<br />
are definition of a bridge, types of inspection, bridge<br />
health index, and condition states. <strong>The</strong> paper attempts<br />
to point out the limitation and constraints in BMS for<br />
adopting them universally and evolving a structure for<br />
comprehensive condition states and bridge index. <strong>The</strong><br />
study reveals that there is no unanimity among bridge<br />
authorities across the globe regarding length of a bridge,<br />
the condition states and bridge indices. A comprehensive<br />
and universal categorisation of condition scales and<br />
bridge index would go a long way in improving the<br />
understanding about the performance of concrete<br />
bridges regardless of their location.<br />
Introduction<br />
<strong>The</strong> history of bridges is almost as old as that of human<br />
civilisation. <strong>Bridge</strong>s have greatly contributed to the<br />
human endeavour by providing passage over obstacles<br />
such as a body of water, valley, road or railway and<br />
improving mobility. India has one of the largest road<br />
and rail networks in the world, with the total road<br />
length being 4.1 million kilometers (http://www.morth.<br />
nic.in), and rail length being 64,099 km (http://www.<br />
indianrailways.gov.in). Both roads and railways run<br />
across the length and breadth of the country, connected<br />
by many bridges, negotiating the varied terrains and<br />
environmental conditions in the country.<br />
MARCH 2012 <strong>The</strong> IndIan ConCreTe Journal<br />
13
Table 1. Minimum length to be traversed to be classified as a bridge<br />
<strong>The</strong>re are more than 92, 000 bridges and over 1.1 million<br />
culverts (length ≤ 6 m) of different types along <strong>Indian</strong><br />
roads. 1 Out of the 92,000 bridges, about 14,500 bridges<br />
are on the National Highways. Out of these, 1713<br />
bridges are in a ‘distressed’ condition and require<br />
repair/rehabilitation, while 2018 bridges are old, weak<br />
and need reconstruction. 2<br />
Like roads, bridges are inseparable parts of the <strong>Indian</strong><br />
Railways. <strong>The</strong>re are about 1.27 million bridges of<br />
different types and varying spans on <strong>Indian</strong> railway<br />
tracks. About 40 percent of these bridges are over 100<br />
years old and 16 percent are reported to be deficient,<br />
requiring rehabilitation and strengthening. 3,4<br />
<strong>Bridge</strong> owners all over the world face difficulties in<br />
maintaining bridges with the available funds. Before<br />
allocating resources for the maintenance of bridges, it<br />
is necessary to ascertain their present condition, their<br />
immediate and future maintenance requirements. This<br />
need has led to the development of bridge management<br />
system (BMS). BMS consists of various scientific methods<br />
and tools for efficient allocation of funds. Reliable data<br />
on the history of bridge condition and maintenance are<br />
of prime importance to the development of this system.<br />
<strong>The</strong> assessment of bridge condition is mostly based on<br />
visual inspection by inspectors and is expressed in terms<br />
of discrete condition states which often dependent on<br />
the judgment and experience of the inspector. Hence,<br />
the development of a method that does not solely<br />
depend on subjective data is essential. 5 <strong>The</strong> application<br />
of condition states in the assessment of bridges in BMS<br />
and decision making has not been much attended<br />
to by researchers. 6 Further, there is no established<br />
methodology or systematic approach in this regard<br />
though bridge engineers and decision makers routinely<br />
face the problem of prioritizing the maintenance needs.<br />
Ranking of bridges for the purpose of maintenance very<br />
often follows a personal judgment. 6<br />
Considering the importance of inspection, bridge health<br />
index and condition states in efficient allocation of funds,<br />
this paper embarks on reviewing the practices followed<br />
in different parts of world based on the available<br />
literature. As it will be seen in subsequent sections there<br />
is a wide disparity in the manner in which bridges are<br />
maintained and the funds are allocated. In fact there<br />
14<br />
Country Austria Denmark France Norway Slovenia United Kingdom United States India<br />
Length in ‘m’ >2 ≥ 5 > 2 m ≥ 2.5 ≥ 5 > 3 > 6.10 > 6<br />
<strong>The</strong> IndIan ConCreTe Journal MARCH 2012<br />
is no unanimity in the bridge definition itself to start<br />
with. <strong>The</strong> review is aimed at comparing the current<br />
practices, pointing out the limitations and constraints<br />
in the existing practices and thereby proposing suitable<br />
recommendations.<br />
<strong>Bridge</strong> definition<br />
In order to be classified as a bridge, a structure should<br />
be of a minimum length. 7 <strong>The</strong> <strong>Indian</strong> Roads Congress<br />
defines a bridge as a structure having a length of more<br />
than six metres and meant for carrying vehicular<br />
traffic across rivers, canals, viaducts, structures for<br />
interchanges including underpasses and flyovers across<br />
the highway/railways, aqueducts/siphon. 8 National<br />
<strong>Bridge</strong> Inspection Standards published in the Code<br />
of Federal Regulations (23 CFR 650.3), USA, defines a<br />
bridge as ‘a structure including supports erected over a<br />
depression or an obstruction, such as water, highway, or<br />
railway; having a track or passageway for carrying traffic<br />
or other moving loads, and having an opening measured<br />
along the centre of the roadway of more than 20 feet<br />
(6.1 m) between under copings of abutments or spring<br />
lines of arches, or extreme ends of openings for multiple<br />
boxes; it may also include multiple pipes, where the clear<br />
distance between openings is less than half of the smaller<br />
contiguous opening. 9 In simple words, a bridge can be<br />
defined as a structure meant for carrying vehicular traffic<br />
across an artificial or natural obstruction. Although a<br />
structure has to be of a minimum length in order to be<br />
classified as a bridge, there is no unanimity on the exact<br />
length. <strong>The</strong> minimum length of bridge specified by<br />
bridge authorities varies from two to six metres 7 . Table 1<br />
gives the minimum bridge lengths prescribed in select<br />
countries. According to IRC: 5-1998, bridges having<br />
length up to 60 m are classified as minor bridges while<br />
bridges having length more than 60 m are classified as<br />
major bridges.<br />
<strong>Bridge</strong> management<br />
<strong>Bridge</strong>s can be regarded as a separate infrastructural<br />
facility owing to their distinct importance. Infrastructure<br />
management is the process by which agencies monitor,<br />
maintain and repair deteriorating facilities within<br />
stipulated budgets so as to improve their performance. 10<br />
Federal Highway Administration manual (USA) defines<br />
‘asset management’ in the following manner. 11
“Asset management is a systematic process of<br />
maintaining, upgrading, and operating physical assets<br />
cost-effectively. It combines engineering principles with<br />
sound business practices and economic theory and it<br />
provides tools to facilitate a more organized, logical<br />
approach to decision-making”.<br />
A weak bridge in a network of roads leads to either<br />
reduction in load carrying capacity and safety, change<br />
of route(s) thereby increasing the length of transit or<br />
complete stoppage of traffic in the absence of alternate<br />
route(s). This, in turn, adversely affects the movement<br />
of men and goods which may result in an increase in<br />
transportation cost of road users, and thereby affecting<br />
the commerce and economy of the region, or even of the<br />
whole country. Hence, it is necessary to maintain trafficworthiness<br />
of bridges with requisite levels of safety<br />
and serviceability. Like any other structure, bridges<br />
are to be planned, constructed, maintained, operated<br />
and replaced at the end of their service lives. Usually,<br />
concrete bridges are designed for 50-60 years. 12<br />
Often, the funds available for maintaining bridges<br />
are scanty. Hence, the most important task of bridge<br />
engineers is to minimise the cost of maintenance. This<br />
can be accomplished by the application of rational<br />
and scientific methods in all the activities pertaining<br />
to management of bridges throughout their lifespan.<br />
A scientific <strong>Bridge</strong> <strong>Management</strong> <strong>System</strong> (BMS) thus<br />
helps in making right decisions regarding maintenance<br />
and using the available resources in the best possible<br />
manner.<br />
Status of management of road bridges<br />
in India<br />
<strong>Indian</strong> Roads Congress (IRC) is responsible for the<br />
development of guidelines for various aspects of roads<br />
and bridges in India. It has developed a manual to<br />
provide guidelines for Highway <strong>Bridge</strong> Maintenance<br />
Inspection (IRC:SP-18). 13 In addition IRC:SP-35 is being<br />
used as a manual of guidelines on the inspection and<br />
maintenance of culverts, minor bridges, and major<br />
bridges including submersible bridges, but excluding<br />
cable-stayed and suspension bridges. 14 <strong>The</strong> latter<br />
document summarizes the status of bridge management<br />
in the following manner:<br />
•<br />
•<br />
•<br />
Present practices of bridge management vary<br />
from state to state.<br />
Inspection and maintenance are mostly carried out<br />
by State Public Works Departments (PWDs).<br />
Databases are usually inadequate.<br />
•<br />
•<br />
•<br />
•<br />
Maintenance policy is reactive and not<br />
responsive.<br />
Very little funds are allocated for bridge<br />
maintenance and repair.<br />
No organization exists exclusively for inspection<br />
and maintenance of bridges.<br />
<strong>The</strong>re are no avenues of formal institutional<br />
training.<br />
IRC:SP-35 also summarises the requirements for research<br />
and development in the maintenance of bridges as the<br />
need to: 14<br />
•<br />
•<br />
•<br />
•<br />
Investigate the effectiveness of present methods<br />
of maintenance.<br />
Develop criteria for evaluating the performance/<br />
efficacy of different maintenance strategies.<br />
Develop improved materials and techniques for<br />
bridge maintenance.<br />
Study of the economics of maintenance of bridges<br />
of various ages and types.<br />
Jain has highlighted the issues in the development<br />
and implementation of scientific BMS in India. Some<br />
important ones are: 4<br />
•<br />
•<br />
•<br />
<strong>The</strong> study of the desirability and practicality<br />
of application of BMS to highway and railway<br />
bridges in India.<br />
<strong>The</strong> development of procedures for compilation<br />
of data on bridges, particularly old and deficient<br />
ones.<br />
<strong>The</strong> development of procedures for bridge<br />
inspection and rating.<br />
<strong>The</strong> following characteristics of the current maintenance<br />
practices of the National Highways in India are mentioned<br />
in the Guidelines for Maintenance <strong>Management</strong> of<br />
Primary, Secondary and Urban Roads. 15<br />
•<br />
•<br />
•<br />
•<br />
<strong>The</strong> maintenance work is based on subjective<br />
judgment and engineering experience.<br />
Analytical tools are generally not used in decision<br />
making.<br />
Life cycle cost analysis is not a criterion for the<br />
selection of the best strategies of maintenance.<br />
<strong>The</strong> causes of deterioration of bridges and of the<br />
effectiveness of different maintenance strategies<br />
are often unevaluated due to non-availability of<br />
requisite data.<br />
MARCH 2012 <strong>The</strong> IndIan ConCreTe Journal<br />
15
On the basis of the study of bridge inventory and<br />
inspection reports of 5237 bridges spread across various<br />
National Highways in 20 States of India managed by<br />
different State Public Works Departments, the following<br />
observations were made: 2<br />
16<br />
•<br />
•<br />
•<br />
•<br />
•<br />
•<br />
<strong>The</strong> inventory of bridges was not updated.<br />
<strong>The</strong> year of construction of about 30 per cent of<br />
the bridges studied was not known.<br />
In the majority of cases, the condition of bridge<br />
components was mentioned as good without any<br />
quantitative criteria for such assessment.<br />
<strong>The</strong> types of distresses of various bridge<br />
components were mentioned, but their extent<br />
and severity were not.<br />
<strong>The</strong> history of inspections and maintenance works<br />
was either missing or not properly recorded.<br />
<strong>The</strong> lack of data was found to be the main hurdle<br />
in developing a scientific BMS.<br />
<strong>The</strong> fund allocation for bridge maintenance was about<br />
2% of the total allocation for the total highway budget. 16<br />
Table 2. Objectives, activities and modules of BMS<br />
Objectives of BMS Activities associated<br />
with BMS<br />
To maintain a bridge or a network of<br />
bridges in a satisfactory condition<br />
To guarantee the safety of the users<br />
with specified risk<br />
To ensure a targeted level of service<br />
To allocate and use limited resources<br />
in a judicious manner<br />
To determine present needs for<br />
maintenance, rehabilitation, and<br />
replacement of bridges<br />
To predict future needs among the<br />
various alternatives<br />
To prioritize bridges for<br />
maintenance, rehabilitation and<br />
replacement<br />
To predict the remaining service life<br />
and minimize life cycle costs<br />
To ensure collection of objective<br />
information on all bridges<br />
To ensure techno-economical<br />
feedback<br />
To provide information to the road<br />
users<br />
Maintaining an<br />
appropriate data base<br />
Inspecting bridges<br />
Defining bridge<br />
conditions<br />
Predicting bridge<br />
requirement<br />
Prioritizing bridges for<br />
maintenance, repair,<br />
rehabilitation and<br />
replacement<br />
Allocation of funds<br />
Identifying bridges for<br />
posting (monitoring and<br />
rating of bridges)<br />
Cost-effective alternative<br />
for each bridge<br />
Scheduling maintenance<br />
Accounting for actual<br />
bridge expenditure, and<br />
Tracking minor<br />
maintenance activities<br />
<strong>The</strong> IndIan ConCreTe Journal MARCH 2012<br />
In the case of India, only 40 % of the amount required<br />
for maintenance of highways is generally available. As<br />
the funds allocated are meagre, it is imperative that they<br />
are spent judiciously.<br />
objectives, activities and modules of<br />
bridge management system<br />
A scientific <strong>Bridge</strong> <strong>Management</strong> <strong>System</strong> (BMS) helps<br />
in making right decisions regarding maintenance and<br />
optimal utilization of the available resources. <strong>The</strong><br />
Organization for Economic Cooperation and Development<br />
(OECD) report on bridge management defines BMS as a<br />
tool for assisting highway and bridge agencies in making<br />
the right choice of optimum improvements to the bridge<br />
network that is consistent with their policies, long-term<br />
objectives, and budgetary constraints. 7 Scherer and<br />
Glagola have defined BMS as a rational and systematic<br />
approach to organizing and carrying out all the activities<br />
relating to managing a network of bridges. 17 <strong>The</strong><br />
literature on bridges mentions a number of functions<br />
of BMS. <strong>The</strong> various BMS objectives and associated<br />
activities with various BMS modules are summarised in<br />
Table 2. 7, 14, 17 to 24 <strong>The</strong> BMS is purported to optimize the<br />
selection of maintenance and improvement activities<br />
BMS Modules<br />
<strong>Bridge</strong> inventory – It contains all administrative and technical<br />
information pertaining to a bridge or a network of bridges e.g., location,<br />
type, age, etc.<br />
Inspection and reports – Collection and maintenance of reports of all<br />
inspections and maintenance work carried out since opening to traffic.<br />
Many of the BMS modules are developed by using this information.<br />
Condition state – Present physical state indicating soundness of a bridge<br />
determined on the basis of an inspector’s judgment and/or testing<br />
Deterioration rate – How the structure has deteriorated since opening to<br />
traffic due to increasing age and erosive effect of traffic and environment?<br />
Prediction of life – Minimum expected life at the time of design/<br />
maximum period up to which bridge can be subjected to traffic flow to<br />
serve as intended function<br />
Requirement of inspection, maintenance, repair, rehabilitation and<br />
replacement – when, what and how much?<br />
Cost of inspection, maintenance, repair, rehabilitation and replacement<br />
of a bridge or a network of bridges<br />
Estimation of LCC of bridge/bridge stock considering both direct and<br />
indirect costs<br />
Rating - Method by which ability of a bridge to safely bear the present<br />
volume of traffic is ascertained<br />
Prioritization of maintenance, repair, rehabilitation and replacement – By<br />
ranking of bridges based on rating and/or LCC<br />
Optimal utilization of funds for maintenance, repair, rehabilitation and<br />
replacement, reprioritization depending on the availability of funds
in order to maximize the benefits and minimize the<br />
costs. BMS assists decision making, but does not replace<br />
human judgment. Though the requirements and general<br />
principles of bridge management remain same, the art<br />
and practice vary from country to country and even from<br />
state to state within a country owing to factors, such<br />
as goals and objectives of the concerned organization,<br />
bridge stock and its characteristics, environmental<br />
factors, the type of personnel employed, availability<br />
of funds, construction and maintenance practices,<br />
availability of materials, minimum serviceability<br />
requirement and so on.<br />
<strong>Bridge</strong> inspection practices<br />
For effective repair and rehabilitation of bridges, proper<br />
understanding of their existing conditions is required<br />
and this starts with inspection. 25 Environmental factors<br />
perennially impact the condition of bridges and are<br />
beyond human control. A newly built bridge requires<br />
due attention right from the day it is opened to traffic.<br />
Due consideration may also be required in the upkeep<br />
of the constructed parts of bridges if the construction<br />
period spans more than a year as otherwise by the time<br />
construction is completed some components might have<br />
been deteriorated. Eventually, the condition at the time<br />
of opening a bridge to traffic may not be the same as<br />
anticipated and will impact the overall performance of<br />
the bridge.<br />
Table 3. Types of inspection in different countries<br />
No. Country Type of inspection<br />
1 Austria 7<br />
2 Denmark 7<br />
3 France 7<br />
4 Germany 7<br />
5 Norway 7<br />
6 Slovenia 7<br />
7 United Kingdom 7<br />
8 United States 26<br />
9 Vietnam 27<br />
10 Taiwan 28<br />
11 Ireland 29<br />
12 Sweden 30<br />
13 India (a) Road bridges 13,14<br />
14 India (b) Railway bridges 3<br />
Initial /<br />
Preliminary /<br />
Acceptance<br />
Superficial /<br />
Routine / Regular /<br />
Assessment<br />
Visual inspection is the cheapest and easiest way of<br />
assessing the condition of bridges although a better<br />
appraisal can be done only with detailed testing<br />
and/or sophisticated health monitoring means, tools<br />
and equipments. Regular inspection ensures sound<br />
performance of a bridge, timely identification of<br />
distresses and remedial measures, creation, updating<br />
and maintenance of data base, and right feedback to the<br />
3, 13<br />
designer, owner, and road user.<br />
Depending on the objective of inspections, the type<br />
of inspection and its frequency vary. <strong>The</strong> inspection<br />
may be daily patrol, preliminary inspection, and end<br />
of guarantee inspection, routine inspection, general<br />
inspection, major inspection, special inspection and<br />
exceptional inspection.<br />
Routine inspection is performed after extreme seasonal<br />
variations and consists of visual inspection of all parts<br />
of a bridge. Detailed inspection, on the other hand, is<br />
performed after every 5-10 years and consists of visual<br />
inspection with or without testing of all parts of a bridge.<br />
Special inspection is carried out first before opening<br />
to the traffic and in case of extraordinary events and<br />
justification of funds. It consists of detailed inspection<br />
with non destructive testing of all parts of a bridge. <strong>The</strong><br />
types of inspection prevalent in different countries are<br />
summarized in Table 3.<br />
General /<br />
Detailed<br />
Major /<br />
Principal<br />
Special Exceptional<br />
<br />
<br />
<br />
<br />
<br />
<br />
<br />
<br />
<br />
<br />
<br />
<br />
<br />
<br />
MARCH 2012 <strong>The</strong> IndIan ConCreTe Journal<br />
17
<strong>Bridge</strong> health index<br />
<strong>The</strong> use of indices is one of the easiest means of<br />
determining the priority of bridge maintenance. <strong>Bridge</strong><br />
indices may be broadly classified into: (1) <strong>Bridge</strong> health<br />
index, and (2) Maintenance priority index / Priority<br />
ranking functions.<br />
<strong>The</strong> general form of a bridge health index (BHI) may be<br />
given by equation (1).<br />
18<br />
<strong>The</strong> IndIan ConCreTe Journal MARCH 2012<br />
......(1)<br />
where, BHI = bridge health index, K i = weight of the<br />
i th component, C i = condition of the i th component, n =<br />
number of bridge components<br />
Maintenance priority index has the general form as per<br />
equation (2). 18<br />
......(2)<br />
Where, MPI = Maintenance priority index, K i = Weight of<br />
the i th deficiency, F i = i th deficiency, a, b, c, …. = Attributes<br />
of the deficiency<br />
<strong>The</strong> application of maintenance priority index is<br />
quite common in some countries. However, not<br />
many systematic studies have been carried out on the<br />
development of bridge health index. <strong>The</strong> development<br />
of these indices invariably involves evaluation of various<br />
bridge components in order to arrive at their relative<br />
importance. 32 Also, from equations (1) and (2) it is<br />
evident that the determination of K i ’s is paramount in<br />
the development of both the indices.<br />
<strong>The</strong> description and characteristics of some specific<br />
bridge indices used in different countries are given.<br />
united States of america<br />
Roberts and Shepard have developed a health index (HI)<br />
for the state of California in the USA. 33 <strong>The</strong> expressions<br />
used to calculate the HI are given in equations (3) to<br />
(5):<br />
......(3)<br />
where,<br />
and<br />
......(4)<br />
......(5)<br />
FC = Failure cost of element; WF i = Condition state<br />
weighting factor<br />
In equation 3, HI is defined as the ratio of current element<br />
value (CEV) to the total element value (TEV) of all the<br />
elements of a bridge. <strong>The</strong> value of HI varies from 0 to<br />
100. <strong>The</strong> CEV is the sum of the weighted product of<br />
quantities of elements in various conditions and the<br />
failure cost of elements. TEV is the product of the total<br />
element quantity and the failure cost of elements. In this<br />
equation, relative importance of bridge components is<br />
computed on the basis of their quantity and failure cost<br />
of elements. Cost may not be the criteria while assessing<br />
the condition of bridge components. <strong>The</strong> bridge<br />
attributes, such as strength, safety and serviceability<br />
are the basis of determining the relative importance of<br />
bridge components.<br />
In the USA, many states are implementing PONTISBMS<br />
in which the above mentioned <strong>Bridge</strong> Health Index<br />
(BHI) is used as a diagnostic tool to assess bridge health<br />
condition. POINTIS was developed in the early 1990s<br />
for the FHWA and became an AASHTO product in<br />
1994. POINTIS is a Windows-based BMS that performs<br />
functions such as recording bridge inventory and<br />
inspection data, simulating conditions and suggesting<br />
actions, developing preservation policy etc. However,<br />
while implementing this BHI to the bridges in City and<br />
County of Denver (CCD), Jiang and Rens observed that<br />
it does not take into cognizance all the defects in a bridge<br />
and is subjective to imprecise cost data. 34 Engineers<br />
at the CCD were of the opinion that the current BHI<br />
neglects the effect of element damage on bridge health,<br />
function, and safety. <strong>The</strong> study carried out by Jiang and<br />
Rens pointed out the following issues in the use of the<br />
above BHI: 34<br />
•<br />
<strong>The</strong> accuracy of BHI value was not conservative.<br />
Most bridges rated in the highest BHI level<br />
(between 90 and 100 percent) even after they<br />
had served for many years and suffered element<br />
damage to various degrees.
•<br />
•<br />
•<br />
<strong>The</strong> BHI variation was not sensitive to individual<br />
element distresses. Even when a bridge had<br />
suffered from heavy element damage between<br />
two inspections, the BHI was found to be<br />
decreasing by an extremely minimal amount.<br />
<strong>The</strong> uniformity of bridge distribution based on<br />
BHIs was suspect.<br />
PONTIS BHI gave the percentage of residual<br />
element value and had no relationship to bridge<br />
health condition.<br />
In order to remove these drawbacks, a new index called<br />
Denver <strong>Bridge</strong> Health Index (DBHI) was developed by<br />
Jiang and Rens with the following three modifications<br />
resulted in a more conservative BHI estimate: 34<br />
•<br />
•<br />
<strong>The</strong> element quantity and cost were removed<br />
from the formula and<br />
a non-linear health index coefficient was<br />
introduced. ; and<br />
In addition, the weight coefficient adjustment method<br />
was incorporated. In DBHI, weights of the bridge<br />
components are still dependent on the condition state of<br />
the components. To make the index more conservative,<br />
weight coefficients are adjusted in consultation with<br />
the practicing engineers of CCD. However, adjustment<br />
factors may not be same for all the components. For<br />
example, adjustment factor for girders may not be same<br />
as that for railing.<br />
McClure and Hoffman have described the deficiency<br />
rating system used in the state of Pennsylvania, USA. 23<br />
<strong>The</strong> system consists of activity ranking, activity urgency,<br />
bridge criticality, and bridge adequacy. Depending on<br />
the condition of a bridge, points are assigned on the<br />
basis of the aforesaid four parameters and they add up<br />
to 100. In a network, each bridge has its deficiency score,<br />
which can be used to decide the urgency of maintenance.<br />
Priority of rehabilitation and replacement is decided on<br />
the basis of the degree of deficiency. Deficiencies are<br />
evaluated in following three categories:<br />
a) Level of service deficiencies: Four characteristics<br />
are included in level of service, viz., load capacity<br />
(LCD), clear deck width (WD), vertical clearance<br />
above the bridge (VCOD), and vertical clearance<br />
below the bridge (VCUD).<br />
b) <strong>Bridge</strong> condition deficiencies (BCD): Deficiency<br />
points for the primary elements, viz., superstructure<br />
(SPD), substructure (SBD) and bridge deck (BDD)<br />
are given on the basis of condition ratings. <strong>The</strong>se<br />
three are then added up to give the bridge<br />
condition deficiency.<br />
c) Other deficiencies: <strong>The</strong>y are related to remaining<br />
life (RLD), approaches (AAD) and waterway<br />
adequacy (WAD). <strong>The</strong>se, in turn, are directly<br />
related to the condition ratings in the database<br />
and calculated by prescribed equations.<br />
Total Deficiency Rating (TDR): It is the sum total of all<br />
deficiency points multiplied by functional classification<br />
factor and is given by equation (6) below:<br />
(LCD + WD + VOCD + VCUD + BCD +<br />
RLD + AAD + WAD) ......(6)<br />
Functional classification factor (φ) is used as per the<br />
importance of the road, for example, value of φ for<br />
interstate: 1.0, arterial: 0.95, collector: 0.85 and local:<br />
0.75<br />
TDR, combined with the cost information and other<br />
factors, will help in listing of the bridges that are in<br />
need of rehabilitation and replacement, in the order of<br />
priority.<br />
<strong>The</strong> sufficiency rating formula given by Federal<br />
Highway Administration , USA, is a method of<br />
evaluating Highway <strong>Bridge</strong> by calculating four separate<br />
factors to obtain a numeric value which is indicative<br />
of bridge sufficiency, i.e., serviceability. 9 This method<br />
yields a percentage of sufficiency in a scale wherein 100<br />
percent represents an entirely sufficient bridge and zero<br />
percent, an entirely insufficient or deficient bridge. <strong>The</strong><br />
sufficiency rating is given by equation (7) below:<br />
MARCH 2012 <strong>The</strong> IndIan ConCreTe Journal<br />
......(7)<br />
Where, S1 stands for structural adequacy and safety;<br />
S2 for serviceability and functional obsolescence; S3 for<br />
essentiality for public use and S4 for special reductions<br />
(used only when (S1 + S2 + S3) > 50). However,<br />
sufficiency rating involves several equations and is<br />
rather a tedious system.<br />
Taiwan<br />
Tserng and Chung have reported the condition index<br />
used in Taiwan. 35 In Taiwan, 20 main bridge components<br />
19
and corresponding weights are considered to calculate<br />
the condition index. Condition of the main component<br />
is the average condition of sub-components. <strong>The</strong><br />
expressions used therein are given by equations (8) to<br />
(10):<br />
where,<br />
and<br />
20<br />
<strong>The</strong> IndIan ConCreTe Journal MARCH 2012<br />
......(8)<br />
......(9)<br />
......(10)<br />
where, IC i is the condition of component ‘i’, W i is the<br />
weights of importance of component ‘i’, IC ij is the index<br />
of the ‘j’ part of component ‘i’ and ‘n’ is the number of<br />
parts. <strong>The</strong> factor ‘a’ is dependent on the importance of<br />
road. For example, a=1 stands for the highway bridge,<br />
and a=2 for the freeway bridge.<br />
<strong>The</strong> above model is based on a deduct point system<br />
ranging from a perfect score of 100 to zero.<br />
<strong>The</strong> condition of a sub-component is determined by<br />
rating it on a scale of 0-4 on the basis of degree (D),<br />
extent (E) and relevancy (R) of the defects. In case any<br />
element has more than one defect, the most severe<br />
defect is chosen for the rating. However, it would<br />
have been prudent to consider the effects of all types<br />
of distress affecting the condition of a bridge element.<br />
Moreover, D, E, and R are taken as same for all types<br />
of distress. This may not be true for all the defects and<br />
every possible defect would have a different degree,<br />
extent and severity corresponding to condition states<br />
of bridge components.<br />
It is also observed by Tserng and Chung that there<br />
is no relation between the index obtained by the<br />
above mentioned equations and the age of the bridge,<br />
Sothey proposed a new performance index called Net<br />
Performance Index (NPI). 35 <strong>The</strong> index is based on a<br />
point deduction system that is subtracted from a perfect<br />
score of 100.<br />
Vietnam<br />
Priority Maintenance Index (PMI) in Vietnam is the<br />
combination of <strong>Bridge</strong> Health Index (BH) and <strong>Bridge</strong><br />
Importance (BI). 27 <strong>The</strong> index BH represents physical<br />
and serviceable conditions of a bridge and comprises<br />
three components: safe degree of bridge structures<br />
(SF), bridge serviceability (SV) and bridge impact on<br />
third parties (TP). BI index represents the important<br />
characteristics of an individual bridge in terms of its<br />
location, serviceability, and traffic demand in the road<br />
network. <strong>The</strong> factors used in the computation of BH are<br />
based on the suggestions of key personnel of the bridge<br />
owners and their agencies, academic researchers and<br />
field specialists in Vietnam. PMI is given by equation<br />
(11):<br />
......(11)<br />
∝ 1 and ∝ 2 are relative importance and health factors,<br />
respectively and (∝ 1 + ∝ 2 =1).<br />
BI has a maximum value of 100 in accordance with the<br />
equation (12) below:<br />
......(12)<br />
I L , I W and I T are practical indexes of location, width and<br />
traffic volume respectively.<br />
<strong>The</strong> index BH represents physical and serviceable<br />
conditions of the bridge and has a maximum value<br />
of 100. <strong>The</strong> expression for BH is given in equation<br />
(13). <strong>The</strong> maximum value of the safe degree of bridge<br />
structures (SF) is 50 while those of bridge serviceability<br />
(SV) and bridge impact on third parties (TP) are 40 and<br />
10 respectively.<br />
europe<br />
......(13)<br />
<strong>The</strong> expression and the details for the computation of<br />
condition rating in Austria, Slovenia, and the United<br />
Kingdom are discussed briefly in the following<br />
sections. 7<br />
<strong>The</strong> condition rating is calculated by the equation (14)<br />
in Austria.
where,<br />
......(14)<br />
G i - Type of damage: <strong>The</strong>re are 32 types of damages. G i<br />
varies from 1 to 5 representing the severity of damage.<br />
K 1i - It is the extent of damage expressed by numerical<br />
values between 0 and 1 and described by words: few or<br />
some, frequent and very frequent or large and usually<br />
refers to components of the bridge or to the whole<br />
bridge structure. <strong>The</strong> extent K 1i is not quantified by the<br />
measured sizes (length, area, etc.) of the damage.<br />
K 2i - It is the intensity of damage expressed by numerical<br />
values between 0 and 1 and also described by words:<br />
little or insignificant, medium, heavy and very heavy.<br />
K 3i – It is the importance of the structural component<br />
or member: K 3i varies between 0 and 1. <strong>The</strong> structural<br />
components are classified as primary, secondary and<br />
other parts.<br />
Depending on the value of condition rating ‘S’, severity<br />
of deterioration is prescribed.<br />
In equation (14), the type of damage, the extent and<br />
severity of damage and the relative importance of bridge<br />
components are taken into consideration. However, for<br />
each damage type, the extent, severity, and importance<br />
of component have been given values in the range of 0<br />
to 1. It would have been more appropriate to consider<br />
the actual values of distress, as is the case in the method<br />
used in Taiwan. <strong>The</strong> condition of a bridge is dependent<br />
on its components which may be affected by a number<br />
of distress types. <strong>The</strong> effect of various damages on<br />
components should be considered during assessment.<br />
Moreover, severity of damage may not be represented<br />
by numbers 1-5 implicitly.<br />
<strong>The</strong> condition rating R for assessing the condition of<br />
a bridge structure is expressed by equation (15) in<br />
Slovenia.<br />
......(15)<br />
Where, ∑V D is the effective sum of the damage values<br />
calculated for the observed structure or its part (e.g.,<br />
bridge component), related to the detected damage types<br />
and given by equation (16) below.<br />
MARCH 2012 <strong>The</strong> IndIan ConCreTe Journal<br />
......(16)<br />
where, V D is damage type value, B i is basic value (1-4)<br />
associated with the effect of damage type on the safety<br />
and/or durability of the observed structural element.<br />
K 1i – Factor which describes the extent of damage and is<br />
expressed by numerical values ranging from 0 to 1. <strong>The</strong><br />
extent is not described by the measured sizes (length,<br />
area, etc.) of the damage on the affected component or<br />
structure.<br />
K 2i – Factor which describes the intensity of damage and<br />
is expressed by values ranging from 0 to 1. In the field,<br />
only the intensity grades I to IV (I – light, II – medium,<br />
III – severe, IV – very severe) are recorded.<br />
K 3i – Factor which describes the importance of the<br />
structural component or member for the safety of the<br />
entire structure. <strong>The</strong> values range between 0 and 1.<br />
K 4i – Factor which describes the urgency of intervention.<br />
<strong>The</strong> values range between 0 and 1.<br />
∑V Dref is the sum of damage values obtained by taking<br />
into account every damage type from the same list<br />
of damages that could potentially occur on the same<br />
observed structure or its part, multiplied by unit<br />
values of factors of intensity and extent (K 2i = K 3i = K 4i<br />
= constant = 1).<br />
On the basis of the calculated condition rating the<br />
inspected structure is classified into one of the<br />
deterioration classes I (R=0-5), II (R=3-10), III (R=7-15),<br />
IV (R=12-25), V (R=22-35) and VI (R≥30).<br />
In the United Kingdom, Total Assessment Rating (TA) is<br />
calculated by the equation (17). 7 Thirty three structural<br />
items are considered in terms of estimated costs, extent,<br />
severity, work and priority.<br />
......(17)<br />
where, R a (1 - 5): Age of bridge rating depends on the<br />
year of bridge construction; R f (1, 3, 4 or 5): <strong>Bridge</strong> form<br />
rating depends on the type of construction; R d (1 - 5):<br />
Vulnerable detail rating depends on the number of<br />
vulnerable details (few-1, many-5); R v : Traffic volume<br />
assessment rating (R v is 1 up to 20,000 vehicles per day<br />
21
and 5 for over 80,000 vehicles per day), depends on the<br />
daily traffic flow, i.e., the number of vehicles per day; R u :<br />
Annual average daily flow below or adjacent to bridge<br />
(same as R v ), and R i : Route importance rating (0 – 5), i.e.,<br />
strategic importance of the route.<br />
<strong>The</strong> value of TA varies between 8 and 50. <strong>The</strong> priority<br />
rating (PR) is determined on basis of the TA rating value<br />
into five classes viz. 1(TA=43-50), 2(TA=36-42), 3(TA=29-<br />
35), 4(TA=22-28), and 5(TA=8-21).<br />
Total assessment rating consists of six ratings relating<br />
to bridge age, bridge form, vulnerable detail, traffic<br />
volume, annual average daily flow and importance of<br />
route. <strong>The</strong> priority rating (PR) is determined on basis of<br />
the range of values for TA classified into five categories.<br />
It is primarily a priority ranking wherein age of the<br />
bridge, the type of construction, traffic volume and the<br />
importance of the route are taken into consideration for<br />
determining priority rather than the condition rating of<br />
a bridge.<br />
Chile<br />
Valenzuela et al presented an integrated bridge index<br />
(IBI) describing it as a function of the structure condition,<br />
the bridge importance and the natural risk factors that<br />
can affect bridge serviceability. 36 <strong>The</strong> main factors in<br />
the IBI are strategic importance (SI), bridge condition<br />
(BCI), hydraulic vulnerability (HV), and Seismic risk<br />
(SR) and. <strong>The</strong> IBI, whose value varies between 1 and 10,<br />
is computed using equation (18):<br />
IBI = -1.411+1.299BCI+0.754HV+0.458SR - 0.387SI<br />
......(18)<br />
In the above equation BCI relates to the condition of a<br />
bridge and is given by equation (19):<br />
22<br />
<strong>The</strong> IndIan ConCreTe Journal MARCH 2012<br />
......(19)<br />
Where, ECI i is element condition index of the element ‘i’;<br />
w i is weight of the element ’i’ with respect to the whole<br />
structure; and m i is material factor of each element.<br />
ECI is computed on the basis of visual inspection and<br />
the description for condition states and its value ranges<br />
from 1 to 5. <strong>The</strong> weights are strongly dependent on the<br />
type of structure and should be defined case by case.<br />
From the above it may be concluded that different<br />
countries and researchers have used select components<br />
for development of bridge indices. Due to this, although<br />
the aim of all these indices remains the same which is<br />
to predict the present status of the bridge condition, the<br />
principles and approaches behind developing them are<br />
quite different.<br />
In all the health indices described above, condition states<br />
of bridge components are invariably used. Condition<br />
states are described by using qualitative terms. <strong>The</strong>y<br />
are detailed in next section. In addition to the condition<br />
states, the models used in Taiwan, United Kingdom,<br />
and Slovania stress on the importance of the extent and<br />
severity of a distress on the condition of various bridge<br />
components. However, the models do not specify the<br />
various distress types and the extent and severity of<br />
each.<br />
BHI may exclusively consider bridge components<br />
and corresponding distress types. For each type of<br />
distress, its characteristics, extent, severity, urgency<br />
of maintenance, type of maintenance task should be<br />
considered for evaluating BHI. Priority indices include<br />
factors causing the distress of a bridge as well as those<br />
influencing the priority of maintenance.<br />
<strong>Bridge</strong> condition states<br />
It is expected that a bridge made of certain materials (e.g.<br />
concrete, steel etc.) of specific structural configuration<br />
would behave in the same manner in spite of variations<br />
in site condition and severity of environment. Site<br />
conditions and severity of environment would affect<br />
the performance of a bridge. <strong>The</strong>y may be factored<br />
in while ascertaining the condition of a bridge.<br />
Infrastructure condition is often represented by discrete<br />
condition states. 37 Condition at a point is the function<br />
of past condition and other factors, such as age, traffic,<br />
weather, and maintenance. Condition rating reflects<br />
physical deterioration due to environmental effects<br />
and traffic while appraisal rating indicates changes in<br />
traffic volume, existing load capacities, and compliance<br />
with safety standards related to bridge geometry and<br />
clearances.<br />
<strong>The</strong>re are two approaches to the evaluation of the<br />
condition of the whole structure. 7 <strong>The</strong> first one is based<br />
on a cumulative condition rating, wherein the most<br />
severe damage to each element is summed up for each<br />
span of the superstructure, each part of the substructure,<br />
the carriageway and accessories. <strong>The</strong> second method<br />
uses the highest condition rating of the bridge<br />
components as the condition rating for the structure as a
whole. <strong>The</strong> highest (most unfavourable) condition rating<br />
assigned to one of the components is not necessarily<br />
the condition rating of the whole structure. In the final<br />
assessment of the structure, damaged components, type<br />
and extent of damages, expected growth of the damage<br />
and its influence on the traffic flow and safety should<br />
be identified. <strong>The</strong> condition rating for the whole bridge<br />
cannot be higher than the one assigned to the most<br />
deteriorated component and cannot be lower than the<br />
one assigned to either of the main components, such as<br />
abutments, piers, bearings, slabs and girders. 7<br />
Clearly, different countries and researchers have adopted<br />
different scales of rating condition states for assessing<br />
the state of bridge health. In spite of the single objective<br />
of representing the overall condition of a bridge based<br />
on the visual inspection, there is no unanimity on the<br />
number of scales and their description. From the analysis<br />
of the scales of rating condition state, it is observed that<br />
following three main objectives are to be included in the<br />
definition of condition state:<br />
•<br />
•<br />
•<br />
Strength of various elements of a bridge- Strength<br />
refers to the ability of a bridge element to sustain<br />
all the forces that are likely to occur due to its own<br />
weight and environment, interdependencies and<br />
its usage. It can be achieved by using appropriate<br />
materials and providing requisite dimensions.<br />
<strong>The</strong> strength also indicates the soundness of a<br />
bridge.<br />
Safety to road users- Safety refers to the passage<br />
of users through a bridge without any harm or<br />
discomfort. Safety can be ensured by proper<br />
alignment, adopting appropriate geometric<br />
standards and providing auxiliary means of<br />
protection.<br />
Serviceability – Serviceability indicates the ability<br />
of a bridge to serve the intended function, or in<br />
other words, to satisfy the present requirement<br />
of users. Serviceability can be enhanced by<br />
providing adequate width, number of lanes and<br />
clearances over and/or under the bridge.<br />
Condition states also include the type of distresses<br />
causing bridge failure and the urgency of maintenance.<br />
Some countries and researchers tried to accommodate<br />
one or two types of distresses while defining the scales of<br />
rating condition states. Condition states are the relative<br />
qualitative measures of the condition of a bridge on the<br />
basis of visual inspection. Condition states are described<br />
by terms, such as excellent, fair, critical etc. <strong>The</strong>y are<br />
designated by numeric/roman numbers ranging from<br />
3 to 10, either in the ascending or descending order of<br />
degree of the fitness of a bridge. Majority of countries<br />
use five-point scale of rating for condition states. While<br />
higher number of condition states are difficult to judge,<br />
lesser numbers are inadequate to completely describe<br />
all the conditions.<br />
Condition ratings are important to automate decisions<br />
on maintenance, repair and replacement of bridges. <strong>The</strong><br />
relation of condition states to decisions and planning<br />
activities has been increasingly recognized, prompting<br />
new definitions of condition states as a part of the<br />
development of bridge management systems. 38 Each<br />
factor, damage, function, and vulnerability, can be<br />
expressed as condition, and can be reported as condition<br />
ratings. 38<br />
Table 4 shows the details of condition scales followed<br />
by different countries. <strong>The</strong> condition states adopted in<br />
all the countries except the USA are in the ascending<br />
order, i.e., a bigger number is ascribed to a more severe<br />
condition. 7, 19, 27, 39, 40 It may be noted that many condition<br />
states prescribe the severity of damage while describing<br />
condition states. 7, 19, 27, 35, 39, 40, 42 <strong>The</strong> type of distress,<br />
extent of distress, maintenance actions, urgency of<br />
maintenance, etc., are also considered by some countries<br />
7, 35<br />
while defining the scales of rating condition states.<br />
Condition state also includes the types of distress<br />
causing bridge failure in combination with other factors<br />
including the urgency of maintenance. Although some<br />
countries and researchers have tried to accommodate<br />
one or two types of distresses while defining the<br />
condition state scales, these are still insufficient as they<br />
do not capture all the factors discussed above. Moreover,<br />
these condition states are unable to quantify the extent<br />
and severity of all possible distress types.<br />
Another limitation of condition states is that they are<br />
subjective and likely to vary according to the judgment<br />
and experience of a bridge inspector. Ambiguity and<br />
subjectivity is unavoidable in the results of visual<br />
inspection. Subjectivity can be reduced with the help of<br />
non-destructive evaluation but such evaluation reports<br />
are required to be interpreted cautiously. <strong>The</strong>re is hardly<br />
any method which is capable of predicting the composite<br />
behaviour of all components of a bridge. A judicious<br />
combination of visual inspection and non-destructive<br />
testing is required to reduce the subjectivity.<br />
It is not possible to accurately evaluate serviceability<br />
and safety on the basis of visual inspection. 43 Visual<br />
MARCH 2012 <strong>The</strong> IndIan ConCreTe Journal<br />
23
inspections and the resulting condition states are not<br />
accurate measures of the safety and serviceability<br />
of a bridge, as they do not take into consideration<br />
the initial safety of the bridge component, the effect<br />
of the deterioration on the safety, and the relevance<br />
of component safety to the safety of the overall<br />
structure. 3<br />
Reliability and Life Cycle Cost (LCC) methods depend<br />
on quantitative rather than qualitative information.<br />
Development of method that does not rely solely on<br />
subjective data is essential. Many uncertainties and<br />
ambiguities exist in the interpretation of inspection<br />
data for reinforced concrete bridges. 5 It is necessary<br />
to redefine the comprehensive condition states so as<br />
to minimize the draw backsin health assessment of<br />
bridges.<br />
Condition-ratings are subjective and do not always<br />
reflect the actual serviceability or vulnerability of a<br />
bridge. 44 <strong>The</strong> quality of results obtained necessarily<br />
depends on the skill, experience and theoretical<br />
Table 4. Type of condition states<br />
No. BMS/Country<br />
24<br />
Number of<br />
condition state<br />
<strong>The</strong> IndIan ConCreTe Journal MARCH 2012<br />
knowledge of the inspector. It is possible to get consistent<br />
results from visual inspection if the bridge inspectors are<br />
well qualified and trained. Subjectivity can be reduced<br />
to a certain extent if visual inspection is aided by nondestructive<br />
evaluation. Variability of observations<br />
can be reduced by supplying standard forms of all<br />
distress types for the sake of uniformity in evaluation.<br />
Subjectivity and variability can also be reduced to a<br />
greater extent by considering the combination of distress<br />
types and condition states. In view of the above, it is<br />
necessary to develop the condition states combined with<br />
distress types and range of values predicting the extent<br />
and severity of each distress type.<br />
Concluding remarks<br />
A comparative study for bridge definitions, types of<br />
inspection, condition states and bridge indices has been<br />
presented. Results of visual inspection are prescribed<br />
by the condition states which are further used for<br />
development of bridge indices. Condition states as<br />
expressed now are unable to predict the combined effect<br />
of defects and hence need to be modified.<br />
Scale Damage/condition based on<br />
Urgency of<br />
maintenance<br />
included?<br />
Maintenance<br />
actions included?<br />
1 Austria 7 1-6 severity No No<br />
2 Denmark 6 0-5 severity Yes No<br />
3 France 4 0-3 severity Yes No<br />
4 Germany 5 1-4 severity Yes Yes<br />
5 Norway 5 1-4 severity Yes No<br />
6 Slovenia 5 1-5 distress type, severity, extent No No<br />
7 Slovenia (Modified) 6 I-VI distress type, severity, extent Yes Yes<br />
8 United Kingdom 4 1-4 severity Yes No<br />
9 United States 10 9-0 distress type, severity, extent Yes No<br />
10 PONTIS 4 1-4 distress type, severity, extent No No<br />
11<br />
<strong>The</strong> United States Army Corps of<br />
Engineers (USACE)<br />
6 0-5 distress type, severity, extent No No<br />
12 Quebec, Canada 6 6-1 severity No No<br />
13 Vietnam 4 0-III severity No No<br />
14 Taiwan 5 0-4 distress type, severity, extent Yes Yes<br />
15 KUBA-MS, Switzerland 5 1-5 severity<br />
16 EIRSPAN, Ireland 6 0-5 severity Yes No<br />
17 J-BMS, Japan 5 0-4 severity Yes Yes<br />
18 DISK, Netherlands 7 0-6 severity Yes No<br />
19<br />
Swedish National Road<br />
Administration<br />
4 0-3 severity Yes No
<strong>The</strong> model used in Taiwan stresses on the importance<br />
of the extent and severity of distress on the condition<br />
of various bridge components. However, the model<br />
does not specify the various distresses in terms of type,<br />
extent and severity.<br />
<strong>Bridge</strong> index is used for presenting the condition<br />
of a bridge and deciding the ranking of bridges for<br />
maintenance planning. <strong>The</strong>re is not a single bridge<br />
index which takes into consideration different types of<br />
distresses causing ineffective performance of a bridge.<br />
It is thus appropriate to take into consideration the<br />
different components, their relative weights and the<br />
types of distresses affecting the bridge components for<br />
the development of BHI. From the review of literature<br />
presented in previous sections, the following conclusions<br />
can be derived:<br />
Present inspection data in India are not updated<br />
and hence not useful for the development of<br />
BMS modules especially deterioration and LCC<br />
modules. It is, therefore, necessary to develop<br />
an appropriate format for visual inspection of<br />
bridges.<br />
Funds provided for bridge maintenance in<br />
India are scarce and therefore should be used<br />
scientifically and rationally.<br />
A description of condition states is yet to be<br />
prescribed by the <strong>Indian</strong> Roads Congress. It is<br />
necessary to develop comprehensive definitions<br />
of various condition states.<br />
It is also necessary to correlate the condition states<br />
with different types of distresses/defects and<br />
work out their corresponding numerical values,<br />
i.e., quantify the distress types. <strong>The</strong>re is a need<br />
to develop a BHI which takes into consideration<br />
bridge components and distress types.<br />
In India, bridges are ageing and there is a need<br />
for a ranking method for deciding the priority of<br />
maintenance tasks.<br />
references<br />
1.<br />
2.<br />
3.<br />
•<br />
•<br />
•<br />
•<br />
•<br />
Basic Road Statistics of India, 1999-2002, Ministry of Shipping, Road<br />
Transport and Highways, Government of India, New Delhi, 2004.<br />
Kushwaha, S. K. and Abhijeet Kumar, personal communication, Executive<br />
Engineers, Department of Road Transport and Highways, Government of<br />
India, New Delhi December, 2007.<br />
<strong>Indian</strong> Railway Institute of Civil Engineering, Pune, Non Destructive Testing<br />
of <strong>Bridge</strong>s, 2005. http://www.iricen.gov.in/books/<strong>NDT</strong>.pdf<br />
4.<br />
5.<br />
6.<br />
7.<br />
8.<br />
9.<br />
10.<br />
11.<br />
12.<br />
13.<br />
14.<br />
15.<br />
16.<br />
17.<br />
18.<br />
19.<br />
20.<br />
21.<br />
22.<br />
23.<br />
Jain, S.S., <strong>Bridge</strong> engineering, some issues of research interest, Edited by<br />
Krishna, P., Department of Civil Engineering, <strong>Indian</strong> Institute of Technology,<br />
Roorkee, India, 2002, pp. 181-214.<br />
Enright, M.P. and Frangopol, D.M.,Condition prediction of deteriorating<br />
concrete bridges using Bayesian updating, Journal of Structural Engineering,<br />
1999, Vol. 125, No. 10, pp. 1118–25.<br />
Sasmal, S., and Ramanjaneyulu, K., Condition evaluation of existing<br />
reinforced concrete bridges using fuzzy based analytic hierarchy approach,<br />
Expert <strong>System</strong> Applications, 2008, Vol. 35, pp. 1430-43.<br />
BRIME—<strong>Bridge</strong> <strong>Management</strong> in Europe, Final report. European Commission.<br />
www.trl.co.uk/brime; 2001.<br />
Project Preparation Manual for <strong>Bridge</strong>s, Special Publication SP 54: 2000,<br />
<strong>Indian</strong> Road Congress, New Delhi.<br />
Federal Highway Administration (FHWA), U.S. Department of<br />
Transportation, Recording and coding guide for the structure inventory<br />
and appraisal of the nation’s bridges, 1995, Report No. (FHWA-PD-96-001),<br />
< www.fhwa.dot.gov/mtguide.pdf >.<br />
Robelin, C.A., and Madanat, S.M., Dynamic programming based maintenance<br />
and replacement optimization for bridge decks using history-dependent<br />
deterioration models, AATT, Proceedings of the ninth international<br />
conference, 2006, ASCE, Reston, VA.<br />
Federal Highway Administration (FHWA), U.S. Department of<br />
Transportation, (1999). “Assets management primer.” www.fhwa.dot.<br />
gov/infrastructure/asstmgmt/amprimer.pdf ><br />
De Brito, J. and Branko, F., Concrete bridge management: from design to<br />
maintenance, Practice periodical on structural design and construction, 1997,<br />
Vol. 3, No. 2, pp. 68-75.<br />
Manual for Highway <strong>Bridge</strong> Maintenance Inspection, Special Publication<br />
SP 18: 1996, <strong>Indian</strong> Road Congress, New Delhi.<br />
Guidelines for Inspection and Maintenance of <strong>Bridge</strong>s, Special Publication<br />
SP 35: 1990, <strong>Indian</strong> Road Congress, New Delhi.<br />
Guidelines for maintenance management of Primary, Secondary and Urban<br />
Roads, Ministry of Road Transport and Highways, 2004.<br />
Singh, D., personal communication, Executive Engineer, Department of<br />
Road Transport and Highways, Government of India, New Delhi, December,<br />
2008.<br />
Scherer, W.T., and Glagola, D.M., Markovian models for bridge maintenance<br />
management, Journal of Transportation Engineering, 1994, Vol. 120, No. 1,<br />
pp. 37-51.<br />
Darbani, B.M. and Hammad, A., Critical review of new directions in bridge<br />
management systems, Proceedings of International Workshop on Computing<br />
in Civil Engineering, 2007, ASCE, Reston, VA.<br />
El-Marasy, M., Data Information <strong>System</strong> for Structures, <strong>Bridge</strong> <strong>Management</strong>:<br />
Inspection, Maintenance, Assessment and Repair, Edited by J.E. Harding,<br />
G.A.R. Parke and M.J. Ryall, Elsevier Science Publishers Ltd. London, 1990,<br />
pp. 89-99.<br />
Fang, Z., Yong-jiu, Q., and Man-mei, L., <strong>The</strong> state bridge management system<br />
under the development of modern transportation, International Conference<br />
on Transportation Engineering, 2007, ASCE, 2007.<br />
Frangopol, D.M., Kong, J.S., and Gharaibeh, E.S., Reliability-based life-cycle<br />
management of highway bridges, Journal of Computing in Civil Engineering,<br />
2001, Vol. 15, No. 1, pp. 27-34.<br />
Hudson, R.W., Carmichael III, R.F., Hudson, S.W., Diaz, M.A., and Moser,<br />
L.O., Microcomputer bridge management system, Journal of Transportation<br />
Engineering, 1993, Vol. 119, No. 1, pp. 59-76.<br />
McClure, R.M. and Hoffman, G.L., <strong>The</strong> Pennsylvania <strong>Bridge</strong> <strong>Management</strong><br />
<strong>System</strong>.” <strong>Bridge</strong> <strong>Management</strong>: Inspection, Maintenance, Assessment and<br />
Repair, Edited by J.E. Harding, G.A.R. Parke and M.J. Ryall, Elsevier Science<br />
Publishers Ltd. London, 1990. pp. 75-87.<br />
24.<br />
Sorensen, A.B., and Berthelsen, F., Implementation of <strong>Bridge</strong> <strong>Management</strong><br />
and Maintenance <strong>System</strong>s (BMMS) in Europe and the Far East, <strong>Bridge</strong><br />
MARCH 2012 <strong>The</strong> IndIan ConCreTe Journal<br />
25
25.<br />
26.<br />
27.<br />
28.<br />
29.<br />
30.<br />
31.<br />
32.<br />
33.<br />
34.<br />
35.<br />
36.<br />
37.<br />
38.<br />
39.<br />
40.<br />
41.<br />
42.<br />
43.<br />
44.<br />
26<br />
<strong>Management</strong>: Inspection, Maintenance, Assessment and Repair, Edited by<br />
J.E. Harding, G.A.R. Parke and M.J. Ryall, Elsevier Science Publishers Ltd.<br />
London, 1990, pp. 29-38.<br />
Haque, M., Uniform bridge management interaction system for database<br />
management for roadway bridges, Journal of <strong>Bridge</strong> Engineering, 1997,<br />
Vol 2, No. 4, pp. 183-88.<br />
Minchin Jr., R.E., Zayed, T., Boyd, A.J., and Mendoza, M., Best Practices<br />
of <strong>Bridge</strong> <strong>System</strong> <strong>Management</strong>—A Synthesis, Journal of <strong>Management</strong> in<br />
Engineering, 2006, Vol. 22, No. 4, pp. 186–195.<br />
Hai, D.T., Computerized Database for Maintenance and <strong>Management</strong> of<br />
Highway <strong>Bridge</strong>s in Vietnam, Journal of <strong>Bridge</strong> Engineering, 2008, Vol. 13,<br />
No. 3, pp. 245–257.<br />
Yau, N.-J and Liao, H.-K, 5th International conference on construction project<br />
management and 2nd International conference on construction engineering<br />
and management, 2007.<br />
Hajdin, R., BMS development in Switzerland, Structures, 2000, ASCE,<br />
2004.<br />
Lindbladh, L., <strong>Bridge</strong> <strong>Management</strong> within the Swedish National Road<br />
Administration, <strong>Bridge</strong> <strong>Management</strong>: Inspection, Maintenance, Assessment<br />
and Repair, Edited by J.E. Harding, G.A.R. Parke and M.J. Ryall, Elsevier<br />
Science Publishers Ltd. London, 1990. pp. 51-61.<br />
Hearn, G., <strong>Bridge</strong> safety and reliability” Edited by Frangopol, 1999, ASCE,<br />
pp. 189-209.<br />
Hsu, H. C., Chang, W. P., Wang, R. D, Cho, C. H., Jiang, D. H. Small and<br />
medium size bridge maintenance sequence analysis by optimization<br />
technique in Cruz, Frangopol and Neves (ed.) Advances in <strong>Bridge</strong><br />
Maintenance, Safety <strong>Management</strong> and Life-cycle Performance and cost<br />
(Balkema: Proceedings and Monographs in Engineering, Water and Earth<br />
Sciences), Taylor & Francis Group, London, 2006, pp. 99.<br />
Roberts, J. E., and Shepard, R. (2001) <strong>Bridge</strong> <strong>Management</strong> for the 21st Century,<br />
in Proceedings Health Monitoring and <strong>Management</strong> of Civil Infrastructure<br />
<strong>System</strong>s, Edited by Steven B. Chase; A. Emin Aktan, 4337, SPIE, pp. 48-59.<br />
Jiang, X., Rens, K.L., <strong>Bridge</strong> health index for the city and county of Denver,<br />
Colorado. II: Denver bridge health index, Journal of Performance of<br />
Constructed Facilities, 2010, Vol. 24, No. 6, pp. 588-596.<br />
Tserng, H.P., and Chung, C-L., Health assessment and maintenance strategy<br />
for bridge management systems: lessons learned in Taiwan, Journal of<br />
Infrastructure <strong>System</strong>s, 2007, Vol. 13, No. 3, pp. 235–246.<br />
Valenzuela, S., Solminihac, H. and Echaveguren, T., Proposal of an integrated<br />
index for prioritization of bridge maintenance, Journal of <strong>Bridge</strong> Engineering,<br />
2010, Vol. 15, No. 3, pp. 337–343.<br />
Madanat, S., Mishalani, R. and Ibrahim, W.H.W, Estimation of infrastructure<br />
transition probabilities from condition rating data, Journal of Infrastructure<br />
<strong>System</strong>s, 1995, Vol. 1, No. 2, pp. 120-25.<br />
Hearn, G., Condition States for Highway <strong>Bridge</strong>s, Structures, 2000, ASCE,<br />
2004.<br />
Hajdin, R., KUBA-MS: <strong>The</strong> Swiss bridge management system.” Proceedings<br />
of Structures Congress, 2001, ASCE, 2004, Reston, VA.<br />
Morcous, G., and Lounis, Z., Probabilistic and mechanistic deterioration<br />
models for bridge management, Proceedings of the International Workshop<br />
on Computing in Civil Engineering, 2007, ASCE, Reston, VA.<br />
Collins, T.J. and Breen, R.P., Ireland’s <strong>Bridge</strong> <strong>Management</strong> <strong>System</strong>,<br />
Proceedings of the Structures Congress, 2006, ASCE, Reston, VA.<br />
Miyamoto, A., Kawamura, K., and Nakamura, H., Development of bridge<br />
management system for existing bridges, Advances in Engineering Software,<br />
2001, Vol. 32, pp. 821-33.<br />
Aktan, A.E., Farhey, D.N., Brown, D.L., Dalal, V., Helmicki, A.J., Hunt, V.J.,<br />
and Shelley, S.J., Condition assessment for bridge management, Journal of<br />
Infrastructure <strong>System</strong>s, 1996, Vol.2, No.3, pp.108-17.<br />
Dunker, K.F. and Rabbat, B.G., Assessment infrastructure deficiency: the<br />
case study of highway bridges, Journal of Infrastructure systems, 1995, Vol.<br />
1, No. 2, pp. 100-19.<br />
<strong>The</strong> IndIan ConCreTe Journal MARCH 2012<br />
Dr. Sanjay S. Wakchaure received his civil<br />
engineering degree from Government College<br />
of Engineering, Shivajinagar, Pune, Masters in<br />
structural engineering from the <strong>Indian</strong> Institute<br />
of Technology Bombay, Mumbai, and PhD<br />
from the <strong>Indian</strong> Institute of Technology Delhi.<br />
He is an Executive Engineer in the Ministry of<br />
Road Transport and Highways, Government of India and is<br />
responsible for planning and monitoring of World Bank/Asian<br />
Development Bank funded Highway and <strong>Bridge</strong> Projects<br />
being carried out in different states of the country.<br />
Dr. Kumar N. Jha is with the Department of<br />
Civil Engineering, <strong>Indian</strong> Institute of Technology<br />
Delhi. He started his career with Larsen and<br />
Toubro Ltd. He has been involved with a number<br />
of construction projects and specialises in project<br />
management and formwork. He has published in<br />
a number of international and national journals<br />
and conference proceedings. His book on construction<br />
project management has recently been published by Pearson<br />
Education. He teaches various courses in construction<br />
technology and management. He has conducted a number<br />
of training programs for industry and has also been involved<br />
with a number of consultancy projects.<br />
COST EFFECTIVE SOFTWARES in ENGINEERING<br />
SUPER CIVIL CD<br />
SINGLE POINT SOLUTION TO YOUR CIVIL<br />
ENGINEERING NEEDS. COST : Rs 2000<br />
R C F :<br />
ANALYSIS, DESIGN, COSTING & DRAWING OF<br />
RC MULTISTOREY BUILDINGS. COST : Rs 3500<br />
SUPER RATE ANALYSIS<br />
RATE ANALYSIS OF 1294 NOS. OF BUILDING ITEMS<br />
AS PER IS 7272: + CPWD SPECS. COST : Rs 2500<br />
AUTOQTY<br />
Direct scanning & Estimation of Quantities<br />
from AUTOCAD Drawings COST : Rs. 3000<br />
ROAD ESTIMATION<br />
QUANTITY, COST & PROJECT PLANNING OF ROADS,<br />
A/V Calc. + L & X SEC IN AUTOCAD. COST : Rs 2500<br />
FLAT SLAB<br />
ANALYSIS, DESIGN, COSTING AND DRAWINGS OF<br />
RC BUILDINGS WITH FLAT SLABS COST : Rs. 5000<br />
Other Softwares: Site Control, RA Bill, Steel 2007, 2D Frame<br />
QTY, Bid Analysis, Builders Bill, Valuation, Raft, Roads, SSF,<br />
Composite, Insta Cost, HVAC Cost, Electric Cost, Billingji,<br />
Des & Drg Control, Optimize Bar & Flat Raft Foundation<br />
DD favouring Mr. Y. A. Agboatwala may be sent to : 1802,<br />
Jamuna Amrut, 219, Patel Estate, S.V. Road, Jogeshwari (W),<br />
Mumbai 400102. Tel: 26783525, Cell : 9820792254<br />
URL: www.supercivilcd.com Email: yaa@supercivilcd.com
Discussion Forum<br />
Dear Sir,<br />
Discussion Forum<br />
Effect of improper casting sequence<br />
on compressive strength<br />
Please refer to the paper titled ‘Effect of improper casting<br />
sequence on compressive strength’ published in <strong>The</strong> <strong>Indian</strong><br />
Concrete Journal, January 2012, Vol. 86, No. 1, pp. 30-41. I wish<br />
to congratulate the authors for choosing this topic. I find that<br />
the cube test results are exceeding the 28 days compressive<br />
strengths, prescribed in the IS 456:2000. I used to be very strict<br />
for not having any cold joints in the case of vertical cement mill<br />
bed concrete. This was many years ago. Now, after reading this<br />
paper, I am more reassured about the idea of cold joints.<br />
Under Table 1, in Sr. No. 6, the authors have given the ‘fineness<br />
of cement’ as 4%. But as per BIS specification IS 12269:1987,<br />
the fineness of cement should be not less than 225 m 2 /kg.<br />
I request you to get the correct information from the authors.<br />
I also request you to get the information of the weight of<br />
the cement used per cubic meter of concrete for the various<br />
concrete mixes used in the experiment.<br />
Thanking you,<br />
S. Lakshmanan<br />
Ovium Apartment,<br />
Block 3, Flat I, Door No 3-3- F1,<br />
2nd Street, Ponnuvelnagar,<br />
Narasothypatti, Salem 636004.<br />
<strong>The</strong> author replies<br />
Dear Sir,<br />
I would like to clarify that the cement fineness<br />
test was the sieve analysis fineness, conducted<br />
using a 90 microns sieve. According to<br />
IS 122269:2007, the fineness should not exceed<br />
10% by weight. <strong>The</strong> Blaine’s Air permeability<br />
test that gives fineness in m 2 /kg was not<br />
carried out by us.<br />
For other queries I would like to have the<br />
reader's direct contact details.<br />
with best regards,<br />
Ms. Amitha. N.R<br />
Assistant Professor<br />
Acharya Institute of Technology<br />
Acharya Dr. Sarvepalli Radhakrishnan Road,<br />
Soldevanahalli, Hesarghatta Main Road,<br />
Bangalore 560 090<br />
MARCH 2012 <strong>The</strong> IndIan ConCreTe Journal<br />
27
Mumbai, India<br />
15. March 2012<br />
<strong>The</strong> Second<br />
<strong>Indian</strong><br />
Drymix Mortar<br />
Conference<br />
Further informations available on<br />
www.drymix.info<br />
Early registration (incl. discounts)<br />
is possible in our shop<br />
from 01. November 2011<br />
REGISTER ONLINE<br />
www.drymix.info<br />
Organizer‘s Office:<br />
drymix.info<br />
Ferdinand Leopolder<br />
Tegernsser Landstraße 26<br />
81541 München, Germany<br />
Phone: +49-89-62000232<br />
Fax: +49-89-62009911<br />
e-mail: info@drymix.info<br />
<strong>Indian</strong><br />
dmmc<br />
two<br />
Building on the success of our<br />
previous conference in 2009<br />
<strong>The</strong> Second <strong>Indian</strong> Drymix<br />
Mortar Conference and Industry<br />
Showcasewill bring together<br />
drymix mortar experts from<br />
the <strong>Indian</strong> Subcontinent<br />
<strong>The</strong> conference is being<br />
organized by drymix.info,<br />
conference language is<br />
English.<br />
l 12 excellent technical<br />
lectures<br />
l additional technical papers<br />
in conference proceedings<br />
l Drymix Mortar Yearbook<br />
and other handouts<br />
l international drymix mortar<br />
professionals<br />
l industry showcase<br />
<strong>The</strong> conference is endorsed by<br />
<strong>The</strong> Construction Chemicals<br />
Manufacturers Association of<br />
India CCMAI and SEADMA, <strong>The</strong><br />
South East Asia Drymix Mortar<br />
Association. Media Partner is<br />
ZKG International.<br />
Join us for this amazing<br />
conference.<br />
<strong>The</strong> Second <strong>Indian</strong><br />
Drymix Mortar Conference<br />
and Industry Showcase<br />
<strong>Indian</strong> dmmc two<br />
Mumbai, India<br />
15. March 2012<br />
09:00 - 17:00<br />
<strong>The</strong> Leela Kempinski Hotel<br />
near Mumbai<br />
International Airport
Non destructive evaluation of concrete<br />
interlocking paving blocks<br />
Concrete interlocking blocks (CIBs) are used in<br />
commercial, municipal, and industrial constructions.<br />
Good engineering properties, low maintenance cost,<br />
ease of placement, removal, and reuse, aesthetic appeal,<br />
and easy availability make them a preferred paving<br />
material. However, often their quality leaves much to<br />
be desired. This paper presents the results of a non<br />
destructive testing exercise undertaken using both<br />
ultrasonic pulse velocity and rebound hammer tests to<br />
assess the compressive strength of commercially available<br />
paver blocks.<br />
Keywords: Interlocking paver blocks, <strong>NDT</strong>, rebound hammer,<br />
ultrasonic pulse velocity, compression test.<br />
With their increasing use in commercial, municipal<br />
and industrial projects, paving blocks are getting<br />
popular in the construction market. As a result, many<br />
manufacturers have mushroomed in the country.<br />
Although following IS 15658:2006 and paying attention<br />
to the quality are their prime concerns, sometimes the<br />
products being sold in the market show inconsistent<br />
strength development.<br />
Uncontrolled use of quarry waste and unconventional<br />
materials in the manufacturing process could cause<br />
the blocks’ compressive strengths to vary with some<br />
M.C. Nataraja and Lelin Das<br />
cases becoming unacceptable for construction. This<br />
paper reports the results from non destructive tests<br />
such as ultrasonic pulse velocity and rebound hammer<br />
and a destructive test namely compressive strength<br />
test performed on concrete blocks. Based on the<br />
results, graphs correlating the compressive strength<br />
with ultrasonic pulse velocity and rebound number<br />
were made for predicting the compressive strength<br />
of unknown samples. <strong>The</strong> correlation successfully<br />
predicted the compressive strengths quite close to the<br />
measured ones.<br />
literature review<br />
Although many factors affect the compressive strength<br />
of concrete paver blocks, some important ones are<br />
casting method, curing shape and size of the specimens.<br />
So, the calibration chart developed using standard cubes<br />
and cylinders [IS 13311 (Part-2):1992] and supplied with<br />
the rebound hammer are not suitable for determining<br />
their strength. As the blocks are relatively thin with a<br />
lower aspect ratio than the cubes, one needs to develop<br />
a separate calibration chart for paver blocks. In this<br />
regards, the influence of the shape and size of the<br />
specimens on the compressive strength of concrete is<br />
well documented. 1-3 It is also well known that the crack<br />
pattern in paver blocks is different from that in the<br />
standard cubes and cylinders. <strong>The</strong> extent of cracking<br />
in paver blocks is denser compared that in cubes and<br />
MARCH 2012 <strong>The</strong> IndIan ConCreTe Journal<br />
33
cylinders. In cylinders, a main inclined fracture surface<br />
is nucleated, whereas in cubes the lateral sides get<br />
spalled. In paver blocks, the failure is gradual with the<br />
central core getting fragmented due to crushing, in some<br />
cases exhibiting a dense columnar cracking in the bulk<br />
of the specimen. <strong>The</strong> compaction pressure also affects<br />
the strength of paver blocks. Wattanasiriwech et al. 4<br />
found that increasing the compaction pressure enhanced<br />
the densification and thus increased the compressive<br />
strength. <strong>The</strong> compaction pressure is therefore expected<br />
to significantly affect the rebound hammer number and<br />
the ultra sonic pulse velocity. As the blocks are thin<br />
and relatively strong, the conventional velocity ratings<br />
meant for structural concrete cannot be applied. A poorly<br />
compacted paver may give a higher rebound number, a<br />
relatively lower pulse velocity rating and strength than a<br />
150 mm cube of the same concrete. Hence it is advisable<br />
to develop separate correlation curves for assessing the<br />
quality of paver blocks.<br />
<strong>The</strong> use of recycled aggregates (RA) also affects the<br />
quality and strength of paver blocks .Although such<br />
aggregates have been successfully introduced in both<br />
structural and non structural concrete products , Poon<br />
and Chan studied the properties of concrete paving<br />
blocks prepared with contaminated recycled concrete<br />
aggregates (tiles, clay bricks, glass, wood) commonly<br />
found in the construction and demolition wastes and<br />
reported that density, compressive strength, tensile<br />
splitting strength, water absorption value, abrasion<br />
resistance, skid resistance and some durability<br />
parameters were greatly affected. 5-9 <strong>The</strong> use of RA as<br />
a replacement of conventional aggregates reduced the<br />
density and strength but increased the water absorption<br />
of the blocks. 10 <strong>The</strong>refore, the waste generated from<br />
building activities is generally considered unsuitable<br />
for this application. Some other wastes that may be used<br />
include brick powder and fine-grained solid gasification<br />
residues. 11, 12 As ascertaining the quality of blocks made<br />
Table 1. Properties of blocks<br />
34<br />
Proportions Shape and size<br />
L x B, mm<br />
w/c= 0.4 1: 5.9 : 3.4<br />
190 x 160<br />
Thickness,<br />
mm<br />
<strong>The</strong> IndIan ConCreTe Journal MARCH 2012<br />
Plan area,<br />
mm 2<br />
with such materials is difficult, their use is restricted to<br />
non structural applications. Under such a quality matrix,<br />
having a set of non destructive tests (<strong>NDT</strong>) to control the<br />
blocks’ quality both at the manufacturing plants and at<br />
site seems desirable. 13,14<br />
When CIPBs manufactures lack technical experience,<br />
they tend to produce the blocks by trial and error,<br />
resulting in an uneconomical process and blocks of<br />
low engineering properties. 15 Applying their expertise<br />
and experience, however, Aticin et al have developed a<br />
process prescription (optimum parameters of aggregate<br />
proportion, water/cement (w/c) ratio and dosage) for<br />
producing CIPB based on destruction specific energy<br />
(SE des ), strength, hardness and abrasion resistance of<br />
the blocks. 15 <strong>The</strong> destructive specific energy (SE des ) is<br />
estimated from the area under the stress-strain envelope<br />
in compressive strength test. <strong>The</strong> authors claim that the<br />
application of destruction specific energy for production<br />
of CIPB results in a lower cost and better engineering<br />
properties.<br />
A classical example of this application is the SONREB<br />
method developed by RILEM Technical committee<br />
and widely adopted in Romania. 22 It is gives a<br />
relationship between UPV, rebound hammer number<br />
and compressive strength of concrete in the form of a<br />
nomogram. <strong>The</strong> accuracy of the estimated strength is in<br />
the range of 15 to 20 percent.<br />
In addition, several other linear and non linear multiple<br />
correlation equations are available in the literature. 23,24<br />
Arioglu et al. obtained best strength prediction by using<br />
the non linearity of rebound number R and UPV, V in<br />
the form of power products. 24 Such regression models<br />
based on power products were used to correlate the<br />
compressive strength of concrete to its UVP (V) and<br />
rebound hammer number (N). In order to optimise the<br />
correlation, the mass density (MD) and class strength<br />
Porosity, at 28<br />
days, %<br />
Average Strength, at 28 days, MPa<br />
Compression Splitting Flexure<br />
70 28240 7.98 48.92 2.94 4.83
(CS) were also used in the model. Equation 1 is a typical<br />
regression model using these variables.<br />
c d e f<br />
y = a + b x1 . x2 . x3 . x4<br />
......(1)<br />
where y is the concrete strength (true or potential)<br />
and x 1 , x 2 , x 3 , x 4 , the quantitative variables UPV, RHN,<br />
MD and CS, when present, and a, b, c, d, e, f the model<br />
parameters.<br />
As many unconventional materials are used in<br />
the production of blocks which affect their quality<br />
significantly, research is continuing to assess engineering<br />
properties without destructively testing the blocks. This<br />
paper represents one such attempt<br />
Present study<br />
Two hundred paver blocks were procured from a single<br />
source and subjected to conventional curing and testing<br />
following the provisions of IS 13311 (Part 1 and 2):1992<br />
for rebound hammer number and the ultrasonic pulse<br />
velocity and IS 15658:2006 for compressive strength. 17-19<br />
A total of 72 blocks were tested, 36 blocks pertaining to<br />
7 and 28 day specimens each. Graphs were generated<br />
correlating the results of these measurements. <strong>The</strong><br />
charts were later used for checking the quality of other<br />
blocks. Multiple correlations were also developed<br />
among compressive strength, rebound hammer number<br />
and ultrasonic pulse velocity for the same purpose.<br />
<strong>The</strong> mixture proportion of the concrete used in the paver<br />
block production was as follows:<br />
Cement: crushed granite rock fines: 10 mm and down<br />
granite chips is 1: 5.9:3.4 with w/c = 0.6. Some of the<br />
properties of the paver blocks such as shape, size,<br />
porosity and tensile strength are presented in Table 1.<br />
Schmidt rebound hammer test<br />
<strong>The</strong> most satisfactory way of establishing a correlation<br />
between the compressive strength of concrete and its<br />
rebound number is to measure both the properties<br />
simultaneously on concrete blocks. So the blocks were<br />
held in a compression testing machine under a fixed<br />
load of about 7 MPa and nine rebound numbers were<br />
taken on each of the two accessible faces. <strong>The</strong> average<br />
of 18 readings following IS 8900:1978 gave the rebound<br />
index for the block. 20 . Here the procedure given in IS<br />
13311(Part-2):1992 was followed. Subsequently, the<br />
blocks were tested for compressive strength following<br />
17, 21<br />
IS 15658:2006.<br />
MARCH 2012 <strong>The</strong> IndIan ConCreTe Journal<br />
35
ultrasonic pulse velocity test<br />
In this test, the direct transmission method was<br />
employed across the thickness of the blocks. This test<br />
was performed following IS 13311(Part-1):1992 at<br />
the centre of the specimen, as the core of the block is<br />
vulnerable to bending. From the path length and the<br />
transit time, the ultrasonic pulse velocity was calculated.<br />
<strong>The</strong> testing was done at the same spot twice and the<br />
average velocity was reported. <strong>The</strong> variation between<br />
two measurements was within about 5 percent.<br />
Compression test on paver blocks<br />
<strong>The</strong> most commonly used dumble shaped paver blocks<br />
(140 mm x 200 mm x 75 mm) were tested following<br />
IS 15658:2006.<br />
results and discussion<br />
Based on the destructive and non destructive results,<br />
calibration correlations were developed using the method<br />
of least squares. Figures 1 to 3 correlate compressive<br />
strength with rebound number, compressive strength<br />
with ultrasonic pulse velocity and rebound number with<br />
ultrasonic pulse velocity respectively.<br />
<strong>The</strong>se figures give the calibration correlation as<br />
a straight line. In such expressions, the degree of<br />
correlation and its efficiency is evaluated in terms of ‘r’<br />
the correlation coefficient. For practical applications,<br />
‘r’≥0.85 is acceptable. Figures 1 to 3 show a high degree<br />
of correlation between the parameters considered<br />
and hence these graphs can be used for practical<br />
applications.<br />
Table 2. Calculated and estimated compressive strength of paver blocks<br />
36<br />
Source Calculated<br />
actual<br />
compressive<br />
strength, MPa<br />
Calculated<br />
average<br />
rebound<br />
number, R<br />
<strong>The</strong> IndIan ConCreTe Journal MARCH 2012<br />
Calculated<br />
average<br />
ultrasonic pulse<br />
velocity UPV,<br />
m/s<br />
Sample-1 35.5 30 3520<br />
Sample-2 42.8 42 3810<br />
Combined method<br />
In the present work, an effort also was made to develop<br />
multiple correlation of the type<br />
C = k + a N + b V ......(2)<br />
where k, a and b are constants of the equation.<br />
<strong>The</strong> constants k, a and b are 57.31, 0.692 and 20.584<br />
respectively. N is the calculated rebound number and V<br />
is the UPV value in km/s. Here the r 2 is 0.94 and standard<br />
error is 2.02. As the r 2 is higher than that obtained in the<br />
other cases, the combined method represents a better<br />
correlation.<br />
use of calibration charts<br />
In order to check the applicability of these charts, three<br />
sets of paver blocks were tested; two sets were from the<br />
same manufacturer (Sample 1) and the third set was from<br />
a different source (Sample 2). Eight blocks were tested at<br />
the age of 21 days by the non destructive and destructive<br />
methods and the corresponding compressive strength<br />
was determined as explained above. Table 2 presents<br />
the results. <strong>The</strong> strength variation based on the rebound<br />
number was within ±7 percent.<br />
<strong>The</strong> compressive strength variation based on the UPV<br />
was about +17 percent for the blocks from the same<br />
manufacturer. However, the variation increased to 33%<br />
when the samples were from the second manufacturer.<br />
Clearly, the calibration charts give incorrect strengths<br />
if the blocks are not manufactured under the same<br />
conditions.<br />
Estimated<br />
compressive<br />
strength from Fig.1<br />
based on N, MPa<br />
Estimated<br />
compressive<br />
strength from Fig. 2<br />
based on UPV, MPa<br />
Estimated<br />
compressive<br />
strength from<br />
equation 1,<br />
combined method<br />
MPa<br />
33.3, 41.49, 35.90<br />
-6.2% +16.9% +1.1%<br />
45.7, 56.9, 50.18<br />
+6.8% +32.9% +14.70%
Table 3. Calculated and estimated compressive strength of paver blocks using charts and equations<br />
Source Calculated<br />
actual<br />
compressive<br />
strength, MPa<br />
use of combined method<br />
Calculated<br />
average<br />
rebound<br />
number, R<br />
Calculated<br />
average<br />
ultrasonic pulse<br />
velocity UPV,<br />
m/s<br />
Sample-3 41.04 38 3455<br />
Sample-4 44.46 45 3605<br />
<strong>The</strong> compressive strength estimated using the combined<br />
method based on equation 2 was close to the actual value<br />
for sample 1 but +14.7 percent for sample 2. However,<br />
the variation in the combined method was less than that<br />
in the individual method.<br />
<strong>The</strong> analysis was extended to include two more samples.<br />
<strong>The</strong>se additional blocks were again procured from two<br />
different sources and were designated Sample 3 and<br />
Sample 4. Ten blocks from each source were tested<br />
following the same sequence as described before. Table 3<br />
summarises an estimate of the compressive strength<br />
made using the charts. <strong>The</strong> UPV is the average of all<br />
10 values based on direct transmission method. <strong>The</strong><br />
Rebound numbers are average for each block and the<br />
average of 10 such averages was taken for strength<br />
evaluation. <strong>The</strong> ’V’ values shown in the brackets are<br />
from the equations shown in the graphs. <strong>The</strong> combined<br />
method was also applied using equation 2. Table 3 gives<br />
the calculated compressive strength for the observed<br />
values of R and V. <strong>The</strong> strength estimated by the<br />
rebound method was higher by 2.3 percent and 10.2<br />
percent for samples 3 and 4 respectively. However, UPV<br />
gave a lower estimate for samples 3 (by 7.4 percent)<br />
and a marginally higher estimate for sample 4 (by 1.2<br />
percent). However, these variations were within the<br />
limits permitted by the codes.<br />
<strong>The</strong> combined method based on the equation 2 gave a<br />
lower strength for samples 3 (2.3 percent lower) and a<br />
higher strength (about 8.1 percent) for sample 4 than the<br />
actual strength. However, these variations were within<br />
the limits permitted by the codes and were significantly<br />
less than the individual methods.<br />
Conclusions<br />
<strong>The</strong> compressive strength prediction by knowing two<br />
<strong>NDT</strong> parameters namely the UPV and rebound number<br />
appears to be practicable. <strong>The</strong> strength assessment is<br />
rather quick and gives initial information about the<br />
Estimated<br />
compressive<br />
strength from<br />
Figure 1 based on<br />
N, MPa<br />
quality of the blocks. Since the factors such as the type<br />
of cement and mineral admixtures, aggregates, surface<br />
condition, moisture condition, age of concrete influence<br />
the test results, they are to be kept in mind while<br />
interpreting the results. If these factors change separate<br />
calibration charts are to be developed. <strong>The</strong> combined<br />
method of predicting the compressive strength the based<br />
on both rebound number and UPV gave better results<br />
than the individual methods.<br />
references<br />
Estimated<br />
compressive<br />
strength from<br />
Figure 2 based on<br />
UPV, MPa<br />
Estimated<br />
compressive<br />
strength from<br />
equation 1,<br />
combined method<br />
MPa<br />
42 (41.6), 38 (38.02), 40.10<br />
+2.3% -7.4% -2.3%<br />
49 (48.9) 45 (46.02), 48.04,<br />
+10.2% +1.2% +8.1%<br />
1. Neville, A.M. Properties of Concrete, Fourth edition, Pearson education,<br />
India, 2006.<br />
2. Mehta P.K., Concrete- structure, Properties and Materials, Prentice Hall Inc,<br />
Engle wood cliffs, New Jersey, 1985.<br />
3. del Viso JR, Carmona JR and Ruiz R., Shape and size effects on the<br />
compressive strength of high-strength concrete, Cement and Concrete<br />
Research, Volume 38, Number 3, 2008, pp. 386-395.<br />
4. Wattanasiriwech D., Saiton A. and Wattanasiriwech S., Paving blocks from<br />
ceramic tile production waste, Journal of Cleaner Production, Volume 17,<br />
Number 18, 2009, pp 1663-1668.<br />
5. Nataraja M.C., Nagaraj T.S., Bavanishankar S., Reddy B.M. Ramalinga,<br />
Proportioning cement based composites with burnt coal, International Journal<br />
of Materials and Structures, Volume 40, Number 6, 2007, pp. 543-552.<br />
6. Nataraja M.C. and Nagaraj T.S., Exploiting potential use of partiallydeteriorated<br />
cement in concrete mixtures, International Journal of Resources,<br />
Conservation and Recycling, Vol 51, No. 2, 2007, pp. 355-366<br />
7. Nataraja M.C. and Nalanda Y. Performance of industrial by-products in<br />
controlled low strength materials (CLSM), International Journal of Waste<br />
management, 2008, Vol 28, No. 7, pp. 1168-1181.<br />
8. Nataraja M.C., Rahman S.S., Lelin Das, Richard Sandeep, Nagaraj T.S.<br />
Proportioning concrete mixtures with crushed concrete paver blocks as<br />
recycled aggregates, Proceedings of the international conference, Role of concrete<br />
in global development, Edited by R.K. Dhir et al., University of Dundee,<br />
2008, pp. 511-522.<br />
9. Chi-Sun Poon and Dixon Chan, Effects of contaminants on the properties<br />
of concrete paving blocks prepared with recycled concrete aggregates,<br />
Construction and Building Materials, 2007, Vol. 21, No. 1, pp. 164-175.<br />
10. Poon C.S. and Lam C.S., <strong>The</strong> effect of aggregate-to-cement ratio and types<br />
of aggregates on the properties of pre-cast concrete blocks, Cement and<br />
Concrete Composites, Volume 30, Number 4, 2008, pp. 283-289.<br />
11. Poon, C.S. and Chan D. Paving blocks made with recycled concrete aggregate<br />
and crushed clay brick, Construction and Building Materials, Volume 20,<br />
Number 8, 2006, pp. 569-577.<br />
12. Chen D. and Poon C.S., Using recycled construction waste as aggregates<br />
for paving blocks, Waste and Resource <strong>Management</strong>, 2006, Vol 159, No. 2,<br />
pp. 83-91.<br />
13. Brozovsky J., Matejka O. and Martinec P. Concrete interlocking paving<br />
blocks compression strength determination using non destructive methods,<br />
MARCH 2012 <strong>The</strong> IndIan ConCreTe Journal<br />
37
14.<br />
15.<br />
16.<br />
17.<br />
18.<br />
19.<br />
20.<br />
21.<br />
22.<br />
23.<br />
38<br />
<strong>The</strong> 8th international conference on the Slovenian Society for non destructive<br />
testing, application of contemporary non destructive testing in engineering, 2005,<br />
Slovenia, pp. 91-97.<br />
Breysse D, Klysz G, Dérobert X, Sirieix C and Lataste JF. How to combine<br />
several non-destructive techniques for a better assessment of concrete<br />
structures, Cement and Concrete Research, Volume 38, Number 6, 2008,<br />
pp. 783-793.<br />
Atici U., Ersoy A. and Ozturk B. Application of destruction specific energy for<br />
characterization of concrete paving blocks, Magazine and concrete research,<br />
Volume 61, Number 3, 2009, pp 193-199.<br />
IS 456:2000, Plain and Reinforced Concrete – Code of practice, (Fourth<br />
Edition), Bureau of <strong>Indian</strong> Standards, New Delhi, India.<br />
IS 15658:2006. Pre cast concrete blocks for paving-Specifications, Bureau of<br />
<strong>Indian</strong> Standards, New Delhi, India.<br />
IS 13311(Part-1):1992. Non destructive testing of concrete - Methods of test,<br />
Ultrasonic pulse velocity, Bureau of <strong>Indian</strong> Standards, New Delhi, India.<br />
IS 13311(Part- 2):1992. Non destructive testing of concrete - Methods of test,<br />
Rebound hammer, Bureau of <strong>Indian</strong> Standards, New Delhi, India.<br />
IS 8900:1978. Criteria for rejection of outlying observations, Bureau of <strong>Indian</strong><br />
Standards, New Delhi, India.<br />
Proceq-Concrete test hammer, Operating instructions, Type N, PROCEQ<br />
SA Zurich, Switzerland, 1977.<br />
RILEM, 1994, RILEM technical recommendations for testing and use of<br />
concrete construction materials, E & FN Spon.<br />
Qasrawi, HY. ‘Concrete strength by combined nondestructive methods<br />
simply and reliably predicted’, Cement and Concrete Research, Volume<br />
30, 2000, pp. 739-746.<br />
<strong>The</strong> IndIan ConCreTe Journal MARCH 2012<br />
24. Arioglu, E., Arioglu, N., Girgin, C. A. Discussion of the paper “Concrete<br />
strength by combined nondestructive methods simply and reliably<br />
predicted” by H.Y. Qasrawi’, Cement and Concrete Research, Volume 31,<br />
2001, pp. 1239-1240.<br />
Dr. M.C. Nataraja holds a PhD from <strong>Indian</strong><br />
Institute of Technology, Kharagpur. Presently,<br />
he is a Professor in the department of civil<br />
engineering at Sri Jayachamarajendra College of<br />
Engineering, Mysore. He has research experience<br />
of 25 years and has published over 100 technical<br />
papers in national and international journals and<br />
conferences. His areas of interest are SFRC, concrete mix<br />
design and controlled low strength materials. He is in the<br />
international technical committee of PROTECT in connection<br />
with international conferences.<br />
Mr. Lelin Das received his BE in Civil Engineering,<br />
M.Tech in Structural Engineering and is pursuing<br />
his PhD at Sri Jayachamarajendra College of<br />
Engineering, Mysore. Presently, he is a Technical<br />
Officer at Ultratech Cement Ltd. at Mysore.<br />
His research interests include use of marginal<br />
materials in concrete, special concretes and<br />
concrete mix design.<br />
Statement about ownership particulars about newspaper ('<strong>The</strong> <strong>Indian</strong> Concrete Journal') to be published in the first issue every year after the<br />
last day of February.<br />
ForM IV<br />
(See rule 8)<br />
1 Place of Publication ACC Limited, L.B. Shastri Road, Near Teen Haath Naka, Thane (W) 400604.<br />
2 Periodicity of the Publication Monthly<br />
3 Printer's Name A.N. Singh<br />
Whether citizen of India Yes<br />
If foreigner, state the country -<br />
Address ACC Limited, L.B. Shastri Road, Near Teen Haath Naka, Thane (W) 400604.<br />
4 Publisher's Name A.N. Singh<br />
Whether citizen of India Yes<br />
If foreigner, state the country -<br />
Address ACC Limited, L.B. Shastri Road, Near Teen Haath Naka, Thane (W) 400604.<br />
5 Editor A.N. Singh<br />
Whether citizen of India Yes<br />
If foreigner, state the country -<br />
Address <strong>The</strong> <strong>Indian</strong> Concrete Journal, ACC Limited, L.B. Shastri Road, Near Teen Haath Naka, Thane (W) 400604.<br />
6 Name and addresses of<br />
individuals who own the<br />
newspaper and partners or<br />
shareholders holding more<br />
than one percent of the total<br />
capital.<br />
1.<br />
2.<br />
3.<br />
4.<br />
5.<br />
6.<br />
Ambuja Cement India Private Limited, 106, Maker Chambers III, Nariman Point, Mumbai 400 021.<br />
Life Insurance Corporation of India, Investment Department, 6th floor, West Wing, Central Office,<br />
Yogak Shema, Jeevan Bima Marg, Mumbai – 400 021.<br />
ICICI Prudential Life Insurance Company Limited, Deutshce Bank AG, DB House, Hazarimal Somani Marg,<br />
Post Box No. 1142, Fort, Mumbai – 400 001.<br />
J. P. Morgan Funds – Emerging Markets Equity Fund, J P Morgan Chase Bank N.A., India Sub Custody,<br />
6th Floor, Paradigm B, Mindspace, Malad West,Mumbai - 400 064.<br />
<strong>The</strong> Growth Fund of America, Inc., Deutsche Bank AG, DB House, Hazarimal Somani Marg,<br />
Post Box No. 1142, Fort, Mumbai – 400 001.<br />
Flagship <strong>Indian</strong> Investment Company (Mauritius) Ltd, J.P. Morgan Chase Bank N.A., India Sub Custody, 6th<br />
Floor, Paradigm B, Mindspace, Malad West, Mumbai 400064.<br />
I, A.N. Singh, hereby declare that the particulars given above are true to the best of my knowledge and belief.<br />
Dated : March 1, 2012 A.N. Singh<br />
Publisher, Printer and Editor
<strong>The</strong> annual story of tall building construction is<br />
becoming a familiar one: 2007, 2008, 2009, 2010, and<br />
now 2011 have each sequentially broke the record for<br />
the most 200 meter or higher buildings completed in a<br />
given year. Once again, more 200 m+ buildings were<br />
completed in 2011 than in any year previous, with a total<br />
of 88 projects opening their doors. Shenzhen’s Kingkey<br />
100, at 442 meters, tops the 2011 list.<br />
Continuing shifts<br />
<strong>The</strong> buildings completed in 2011 have effected a<br />
significant change in the world’s tallest 100 buildings,<br />
with 17 new buildings added to the list. Perhaps most<br />
significantly, for the first time in history the number of<br />
office buildings in the tallest 100 has diminished to the<br />
50% mark, as mixed-use buildings continue to increase,<br />
jumping from 23 to 31. As recently as the year 2000, 85%<br />
of the world’s tallest were office buildings – meaning<br />
that a 35% change has occurred in just over a decade. In<br />
terms of location, Asia, now with 46 of the 100, continues<br />
to edge toward containing half of the world’s tallest<br />
buildings. <strong>The</strong> Middle East region saw an increase of<br />
three, while Europe diminished to only one building in<br />
the tallest 100: Capital City Moscow Tower.<br />
dominant and emerging markets<br />
<strong>The</strong> eighty-eight 200 m+ projects completed in 2011<br />
(the tallest 20 of which are profiled in Figure 1) provide<br />
a helpful insight into where this expected increase in<br />
international building development will take place. On<br />
the one hand, statistics show that several of the major<br />
markets in recent years continue to thrive – and drive<br />
a significant percentage of the tall building market.<br />
China and the UAE contain a total of 39 of the projects<br />
– over 44% of the world’s completions in 2011. However,<br />
<strong>Tall</strong> <strong>Buildings</strong><br />
A year in review : Trends of 2011<br />
Skyscraper completion reaches new high for fifth year running<br />
Nathaniel Hollister and Antony Wood<br />
several cities, not previously seen as centers of tall<br />
building construction, are quite evident in this group<br />
of projects. In fact, the three cities to complete the most<br />
200 m+ buildings in 2011 are all relative newcomers to<br />
the list: Panama City (10 completions), Abu Dhabi (9<br />
completions), and Busan (9 completions). Before 2011,<br />
these cities had a combined total of six 200 m+ buildings.<br />
Together, they now contain 34 such buildings and<br />
accounted for 32% of completions in 2011, surpassing<br />
traditional tall building centers such as Dubai, Shanghai,<br />
and Singapore.<br />
China<br />
When discussing skyscraper completion, it is impossible<br />
to neglect the market of China, which contributed 23<br />
completions in 2011.<br />
However, quite surprisingly given the region’s<br />
impressive market, we have seen China’s global<br />
percentage of building completions begin to drop off<br />
slightly. In 2009, China contained 45% of the buildings<br />
completed and 33% in 2010. In 2011, China contained<br />
only 26% of the global total of 200 m+ completions.<br />
This decreasing figure demonstrates that, despite the<br />
continued increase in building construction in China and<br />
relatively tame historical markets, other new markets<br />
are immerging.<br />
Shenzhen’s Kingkey 100, at 442 meters (1,449 feet), was<br />
the tallest to complete in 2011, opening in December.<br />
<strong>The</strong> 100-story building is topped by a 38-meter (125-foot)<br />
sky garden which serves as the lobby of the building’s<br />
hotel and contains three levels of restaurants/ bars. Also<br />
completed in 2011 was the Longxi International Hotel,<br />
located near the Chinese village of Huaxi. <strong>The</strong> village,<br />
rumored to be the richest in China, sees the building as a<br />
MARCH 2012 <strong>The</strong> IndIan ConCreTe Journal<br />
39
40<br />
<strong>The</strong> IndIan ConCreTe Journal MARCH 2012<br />
<strong>Tall</strong> <strong>Buildings</strong><br />
Figure 1. <strong>The</strong> tallest 20 buildings completed in 2011, 10 of which, for the first time in history, are supertalls. © CTBUH<br />
mark of their economic development over the past halfcentury,<br />
with its height symbolically matching (within<br />
two meters) the height of the tallest building in Beijing,<br />
the capital of China.<br />
dubai<br />
Another significant existing market is the city of Dubai,<br />
which added six 200 m+ buildings in 2011. It is helpful to<br />
recall that, just a decade ago, the entire UAE contained a<br />
total of only three 200 m+ buildings. It now contains 60<br />
such buildings, behind only China and the USA. Within<br />
ten years, the country has established itself as a centre<br />
of tall building construction, and has completed more<br />
200 m+ buildings than any other country except China<br />
in the past two years.<br />
In 2011, Dubai’s 23 Marina became the world’s<br />
tallest residential building, at 393 meters (1,289 feet).<br />
Coincidentally, the building sits near both <strong>The</strong> Torch (the<br />
previous world’s tallest residential for a short time) and<br />
the under construction Princess Tower (set to become<br />
the world’s tallest in 2012), making the Dubai Marina the<br />
tallest residential skyscraper cluster in the world.<br />
Panama<br />
Before 2008, no 200 m+ buildings existed in all of<br />
Panama. <strong>The</strong>n, between 2008 and 2010, three buildings<br />
opened. In 2011, Panama City completed ten 200 m+<br />
skyscrapers, more than any other city and more than<br />
double the number of completions in all of North<br />
America. With these completions, there are now 12 such<br />
buildings in Panama, perhaps signalling a new day for<br />
the tall building in this region.<br />
One of these buildings, the Trump Ocean Club<br />
International Hotel & Tower, became the tallest<br />
building in Central America when it completed in<br />
2011 at 284 meters (932 feet) in height. Additionally,<br />
there are another eight buildings currently under<br />
construction and set for completion by the end of 2012,<br />
an impressive figure for a country of only 3.5 million<br />
inhabitants. While these numbers are easily dwarfed by<br />
the immense number of completions in China or other<br />
major tall building markets, they point to an immerging<br />
tall building market. Panama is not the only emerging<br />
market in this region: Mexico also completed its third<br />
200 m+ building in 2011 and currently has three other<br />
significant tall building projects under construction.
Figure 1. continued<br />
abu dhabi<br />
Another emerging market in 2011 was Abu Dhabi,<br />
Dubai’s neighbour. This city added nine 200 m+<br />
buildings in 2011, remarkable as it contained only<br />
two such buildings at the beginning of the year.<br />
Another thirteen 200 m+ buildings are currently under<br />
construction in Abu Dhabi, showing that the city will<br />
continue to be an important market for the next several<br />
years.<br />
Abu Dhabi’s largest project to complete in 2011 was<br />
Etihad Towers, a complex comprised of five towers<br />
ranging between 218 meters to 305 meters. <strong>The</strong> complex<br />
provides a significant amount of residential, office, and<br />
hotel space to the city. <strong>The</strong> tallest of the towers, Etihad<br />
Towers 2, became the city’s tallest building and first<br />
supertall.<br />
Busan<br />
<strong>The</strong> Korean tall building market has also seen significant<br />
development in recent years, containing twenty-four 200<br />
m+ buildings by the end of 2010. However, only one<br />
such building existed in the country’s second largest<br />
<strong>Tall</strong> <strong>Buildings</strong><br />
city, Busan. 2011 saw all this change with 9 of the 11<br />
Korean completions taking place in Busan. This included<br />
the completion of the Doosan Haeundae We’ve the<br />
Zenith Tower complex and Studio Daniel Libeskind’s<br />
Haeundae I’Park complex. <strong>The</strong>se two projects, which<br />
sit directly next to each other, added five 250-meter<br />
(820-foot) residential buildings to Busan.<br />
2011 also saw the completion of Korea’s tallest building,<br />
the Northeast Asia Trade Tower. <strong>The</strong> building is located<br />
in Incheon which, since it became Korea’s first free<br />
economic zone in 2003, has seen significant tall building<br />
development.<br />
united States and europe<br />
What role do developed regions, like the United States<br />
and Europe, play in the future of the tall building? Are<br />
these markets expanding or expended?<br />
Historically speaking, the United States experienced its<br />
skyscraper “heyday” in the 1980s, when forty-nine 200<br />
m+ buildings were completed. To put this in perspective,<br />
during the same decade China and South Korea each<br />
completed only two such buildings, while Europe and<br />
MARCH 2012 <strong>The</strong> IndIan ConCreTe Journal<br />
41
the UAE completed none. This building boom continued<br />
into the early 90s, until it ended in 1994, after which the<br />
US did not complete any 200 meter buildings for a full<br />
five years.<br />
In 2011, two 200 m+ buildings were completed in the<br />
US: New York’s Eight Spruce Street and Cincinnati’s<br />
Great American Tower. Eight Spruce Street, recipient of<br />
the CTBUH 2011 Best <strong>Tall</strong> Building Americas Award,<br />
uses its façade to create a draping fabric-like quality, a<br />
unique addition to the city’s skyline.<br />
Europe, another significantly developed tall building<br />
market, completed four 200 m+ buildings in 2011,<br />
matching its record set in 2008. <strong>The</strong>se buildings, spread<br />
through the UK, France, Germany, and Russia, seem<br />
to point to a possible resurgence of the tall building<br />
in continental Europe. <strong>The</strong>re are currently 20 such<br />
buildings under construction in Europe, with some ten<br />
set to complete in the next two years.<br />
France’s Tour First building, completed in 2011, took a<br />
40-story building completed in the 1970s and completely<br />
refurbished it. <strong>The</strong> project retains the integrity of the<br />
original tower while providing a modern interpretation<br />
of the concept and vastly improving the environmental<br />
performance, internal conditions, and circulation. With<br />
the addition of ten floors, the project became France’s<br />
tallest building at 231 meters (758 feet). This reuse and<br />
reinvigoration of an existing building can be seen as<br />
a model for what is likely to become a common event<br />
around the world. As buildings age and become in<br />
42<br />
<strong>The</strong> IndIan ConCreTe Journal MARCH 2012<br />
<strong>Tall</strong> <strong>Buildings</strong><br />
danger of becoming obsolete, significant renovations<br />
can be more effective than complete demolition.<br />
Conclusion<br />
Having examined the history and status of a variety of<br />
tall building markets, several assumptions can be made<br />
about the next decade of tall building construction.<br />
Existing skyscraper markets, particularly China and the<br />
Middle East, are predicted to continue to play a major<br />
role in the tall building industry. China currently has<br />
over 180 projects under construction that are over 200<br />
meters in height, and thus will undoubtedly play the<br />
primary role in tall building development for the rest<br />
of this decade. However, the tall building typology<br />
continues to diversify, and we can expect to see the<br />
further development of a number of new markets over<br />
the next few years. Cities like Panama City, Abu Dhabi,<br />
Busan, and many others in Central and South America,<br />
Asia, and the Middle East will continue to play an<br />
increasing role in tall building development.<br />
With over 300 projects above the 200-metre mark<br />
currently under construction internationally, the tall<br />
building community is set to continue to develop at an<br />
incredible pace. As new markets continue to discover<br />
and develop the tall building, it is quite possible that<br />
this pace will continue through the end of this decade.<br />
Without a doubt, the skylines of the world will see<br />
tremendous change by the year 2020.<br />
For the detailed report, readers are requested to get in<br />
touch with the authors at info@ctbuh.org<br />
Nathaniel Hollister, BArch, received his<br />
professional Bachelor’s degree in architecture<br />
from the Illinois Institute of Technology. He is<br />
the Production Coordinator at the Council on<br />
<strong>Tall</strong> <strong>Buildings</strong> and Urban Habitat (CTBUH), USA<br />
and is primarily responsible for contributing to<br />
the research, design, and production of various<br />
CTBUH publications and press releases, including the 2010<br />
CTBUH Reference Guide — a book documenting current tall<br />
building statistics. In addition, he facilitates the research and<br />
organization necessary for the production of the “CTBUH in<br />
Numbers” articles and other technical reports.<br />
Dr. Antony Wood, PhD RIBA, is Executive<br />
Director of the CTBUH, responsible for the dayto-day<br />
running of the Council and steering in<br />
conjunction with the Board of Trustees. Based<br />
at the Illinois Institute of Technology, Antony<br />
is also an Associate Professor in the College of<br />
Architecture at IIT, where he convenes various<br />
tall building design studios. A UK architect by training,<br />
his field of specialism is the design, and in particular the<br />
sustainable design, of tall buildings.
Superposition principle invalid in<br />
iS 13920 design of slender rc walls<br />
with boundary elements<br />
D.H.H. Rohit, P. Narahari, Arvind Kumar Jaiswal and C.V.R. Murty<br />
Current code IS 13920:2002 for ductile detailing of<br />
concrete structures assumes that moment capacity of a<br />
RC structural wall with boundary elements is the sum of<br />
moment capacity of the web portion of the wall and that<br />
due to the couple using axial capacity of the boundary<br />
elements and lever arm between them. This assumption<br />
leads to gross over-estimation of design moment capacity<br />
of the wall. In this paper, provisions are reviewed and<br />
improvements suggested eliminating this deficiency in<br />
the code provisions. A nonlinear method is suggested<br />
based on principles of mechanics for estimating the<br />
combined P u-M u strength envelope, considering the<br />
combined contribution of the web and boundary elements<br />
of the wall. Using this, a numerical study was performed<br />
of moment capacity of RC structural walls (both with<br />
and without boundary elements) to demonstrate that<br />
superposition principle is not acceptable in the design<br />
of RC structural walls with boundary elements.<br />
Key words: RC frame buildings; RC structural walls; design<br />
code; moment capacity; superposition.<br />
rC Walls with boundary elements<br />
RC structural walls in RC frame buildings can be<br />
designed without or with boundary elements (Figure 1).<br />
Often, a uniform column grid is maintained and walls<br />
MARCH 2012 <strong>The</strong> IndIan ConCreTe Journal<br />
43
44<br />
Notations<br />
A si = Area of steel reinforcement bar i<br />
A st = Area of uniformly distributed vertical<br />
reinforcement<br />
be = Boundary element<br />
BE = Boundary element<br />
CA = Centroidal axis<br />
d = Cover to steel reinforcement bar<br />
E s = Elastic modulus of steel<br />
f ck = Characteristic compressive strength of<br />
concrete<br />
f scx = Stress in concrete at depth x from extreme<br />
compression fibre<br />
f si = Stress in steel reinforcement bar i<br />
f y = Characteristic strength of steel<br />
h w = Vertical height of wall<br />
l w = Length of wall inclusive of boundary elements<br />
P u = Axial compression on whole wall crosssection<br />
P be = Axial compression on boundary element<br />
only<br />
P uz = Axial capacity of whole wall cross-section<br />
(with M u =0)<br />
M u = Moment on whole wall cross-section<br />
M uv = Moment on wall web only<br />
M uz = Moment capacity of whole wall cross-section<br />
(with P u =0)<br />
NA = Neutral axis<br />
t w = Thickness of wall<br />
x u = Depth of neutral axis from extreme compression<br />
fibre<br />
x i = Depth of steel reinforcement bar i from neutral<br />
axis<br />
ε c = Strain in concrete<br />
ε si = Strain in steel reinforcement bar i<br />
ρ t = Percentage of vertical steel reinforcement<br />
σ c = Stress in concrete<br />
σ si = Stress in steel reinforcement bar i<br />
built between two column lines (placed symmetrically<br />
in the two plan directions to avoid twisting in the<br />
building). 1 <strong>The</strong> boundary elements provide the needed<br />
confinement at the wall ends as well as offer a consistent<br />
architectural form at the exterior surface, in addition to<br />
providing for a uniform structural grid. 2<br />
Conventionally, Reinforced Concrete (RC) structural<br />
elements should be designed to behave in an underreinforced<br />
manner; steel should yield before concrete<br />
crushes, and this gives enough warning before the<br />
<strong>The</strong> IndIan ConCreTe Journal MARCH 2012<br />
structural element fails. But, a critical review of the<br />
current design provisions in the IS 456 confirm that this<br />
desired mode of failure is not realised analytically. 3 IS<br />
456 specifies that the limiting state in compression of<br />
concrete is reached when compression strain in the<br />
extreme concrete fibre reaches 0.0035. But, many text<br />
books and handbooks on the subject take this strain of<br />
0.0035 in the calculation of moment capacity M u of the<br />
section to occur under all circumstances, irrespective of<br />
whether the RC section is in compression or in tension.<br />
<strong>The</strong> negative consequence of this is that academics,<br />
students and practitioners involved in design of RC<br />
structures do not internalise the importance of making<br />
RC structures under-reinforced. In the specific context<br />
of structural walls, being made under-reinforced means<br />
tension steel reaches the limiting strain in tension before<br />
the extreme fibre in compression reaches limiting strain<br />
in compression. M u calculated by the textbooks and<br />
handbooks is not far from the exact intent when the RC<br />
section is shallow, e.g., RC columns or beams. 4-7 But,<br />
the said misinterpretation leads to M u estimates that<br />
are significantly off from those obtained from the exact<br />
interpretation of the clause, when the RC sections are<br />
deep, e.g., RC walls. 1,2,3,8 In RC slender walls with low<br />
elevation aspect ratio (h w /t w ), the under-estimation of<br />
M u is even more amplified by the linear super-position<br />
suggested in IS 13920 in the calculation of M u . 9-11 This<br />
paper explains the above mentioned misinterpretation;<br />
lays down the exact method of estimating M u that<br />
is based on fundamentals of mechanics, namely<br />
equilibrium, compatibility and constitutive law; and<br />
argues in favour of discontinuing the use of principle<br />
of superposition for estimating M u of RC walls as laid<br />
down in IS 13920.<br />
estimating moment capacity M u of<br />
structural walls<br />
<strong>The</strong> moment capacity of RC structural walls subjected<br />
to compression and flexure is governed by Clauses
38.1 and 39.1 of IS 456 and based on the following<br />
considerations: 3<br />
•<br />
•<br />
•<br />
•<br />
•<br />
•<br />
Plane section normal to the axis of bending<br />
remains plane even after bending<br />
Bending compressive strength of concrete is<br />
0.67 times the characteristic cube compressive<br />
strength. Design stress-strain curves of concrete<br />
and steel are shown in Figure 2.<br />
Maximum compressive strain at the highly<br />
compressive extreme fibre in concrete is 0.002 in<br />
pure compression, 0.0035 in bending compression,<br />
and 0.0035 minus 0.75 times the strain at the least<br />
compressive extreme fibre under combined axial<br />
compression and bending (when there is no<br />
tension on the cross-section)<br />
Tensile strength of concrete is ignored<br />
Maximum strain in tension reinforcement at<br />
failure is not less than 0.002 + (f y /1.15E s ), where f y<br />
is characteristic strength of steel, and E s modulus<br />
of elasticity of steel; and<br />
Partial safety factors for material strengths are 1.5<br />
for concrete and 1.15 for steel.<br />
Using these considerations, Annex A of IS 13920<br />
provides the following closed-form expression to<br />
estimate ultimate moment capacity M u of RC structural<br />
walls without boundary elements: 11-13<br />
(a) When ,<br />
where<br />
; and<br />
......(1)<br />
(b) When ,<br />
where<br />
and .<br />
MARCH 2012 <strong>The</strong> IndIan ConCreTe Journal<br />
......(2)<br />
In Eq.(2), (x u /l w ) is obtained by solving the quadratic<br />
equation<br />
and .<br />
, where<br />
Eq.(2) has an error; the expression for α 2 should read<br />
as:<br />
......(3)<br />
<strong>The</strong> assumptions and limitations behind expressions<br />
for M u are: 7,12,13<br />
1.<br />
2.<br />
<strong>The</strong> stress–strain curve for steel is assumed to be<br />
the bilinear one (Figure 2(b)).<br />
Reinforcement bars are assumed to be distributed<br />
uniformly along the wall length. If any other<br />
distribution is adopted, the expression may not<br />
help in obtaining M u .<br />
45
46<br />
3.<br />
4.<br />
5.<br />
6.<br />
7.<br />
<strong>The</strong> extreme compressive fibre<br />
of concrete always develops a<br />
strain of 0.0035. Assuming the<br />
concrete fails first even when<br />
the structural wall section is<br />
under-reinforced, results in<br />
violation of basic mechanics.<br />
Annex A of IS 13920 does<br />
not provide expression for<br />
M u when neutral axis is<br />
located outside the section<br />
[Figure 3 (d)].<br />
<strong>The</strong> minimum value of<br />
maximum tension strain in<br />
reinforcement bars is 0.0020<br />
+ (0.87f y /E s ).<br />
When boundary elements are provided, Clause<br />
9.4 of IS 13920 uses principal of superposition to<br />
determine the total M u contributed by structural<br />
wall and boundary element, even though the<br />
stress-strain curves are nonlinear for both steel<br />
and concrete.<br />
Under pure axial compression, the axial<br />
strain is 0.002 throughout the section. In the<br />
expression of P uz , the contribution of concrete, i.e.,<br />
0.446 f ck l w t w with 0.446 f ck being the stress in<br />
concrete throughout the section, is consistent<br />
with the axial strain of 0.002, but that of steel is<br />
not. At a strain of 0.002, the stress in steel must<br />
be 0.79f y , but is taken as 0.75f y for Fe 415 steel<br />
(Table 1) in IS 456:2000 and SP 16; and it is about<br />
0.75f y for Fe 500.<br />
Suggested improvements in<br />
calculation of M u of structural walls<br />
Changes are required in both interpretation and<br />
assumptions made in the <strong>Indian</strong> Codes for calculating<br />
the ultimate moment of resistance M u of RC structural<br />
walls. <strong>The</strong> following improvements are suggested:<br />
•<br />
Principles of Mechanics should be employed to<br />
arrive at M u of RC structural walls, which are<br />
consistent with the basic tenets of Limit State<br />
Method of design for strength. This approach<br />
will provide a general method to arrive at M u for<br />
any location of neutral axis; this will eliminate<br />
the incorrect assumption that concrete will<br />
always fail first and that too at axial-cum-bending<br />
<strong>The</strong> IndIan ConCreTe Journal MARCH 2012<br />
Table 1. Calculation of stress in steel during pure axial<br />
compression for different steels (from Table A of SP 16)<br />
•<br />
•<br />
Design Stress<br />
Strain<br />
Fe 415 Fe 500<br />
0.85 × 0.87f y = 0.7395f y 0.00163 0.00195<br />
0.90 × 0.87f y = 0.7830f y 0.00192 0.00226<br />
0.95 × 0.87f y = 0.8265f y 0.00241 0.00277<br />
compression strain of 0.0035. Also, exact stressstrain<br />
curves can be used of concrete and steel.<br />
When boundary elements are provided at ends<br />
of RC structural walls, the whole cross-section<br />
should be considered together in arriving at M u ,<br />
thereby eliminating the need to apply principles<br />
of superposition on individual contributions<br />
of moments of resistance of wall web and wall<br />
boundary elements.<br />
Instead of specifying the minimum value<br />
of maximum strain (of 0.0020+0.87f y /E s ) in<br />
reinforcement bars with highest tension strain,<br />
a limiting strain (of 0.0020+0.87f y /E s ) should be<br />
specified. This will complete the definition of limit<br />
state design by specifying the limiting strain on<br />
the tension side.<br />
<strong>The</strong> advantage of such an approach is that a section can<br />
be designed to be under-reinforced, and thereby have<br />
adequate warning, before failure of the wall.<br />
Principles of mechanics for estimating M u<br />
Rectangular RC structural wall sections (Figure 4) have<br />
two equilibrium equations, one for axial force on the<br />
section (Eq. (4)) and another for bending moments about<br />
axis of bending (Eq. (5)):
and ......(4)<br />
where N is the number of steel reinforcement bars in the cross-section.<br />
MARCH 2012 <strong>The</strong> IndIan ConCreTe Journal<br />
......(5)<br />
Stress-strain constitutive relations of concrete (Eq.(6)) and Fe 415 steel (Eq.(7)) can be expressed respectively<br />
(Figure 2) as:<br />
......(6)<br />
......(7)<br />
<strong>The</strong> RC structural wall section consists of two materials, namely concrete and steel bars. As per Limit State Method of<br />
design, either or both of them can reach the limiting strain first; the limiting strains of concrete and steel bars are:<br />
......(8)<br />
47
and<br />
If concrete reaches the limiting strain first,<br />
and , then<br />
and if steel reaches the limiting strain first,<br />
and , then<br />
numerical study and discussion<br />
48<br />
<strong>The</strong> IndIan ConCreTe Journal MARCH 2012<br />
......(9)<br />
......(10)<br />
......(11)<br />
As per Clause 9.1 of IS 13920, the thickness of wall shall<br />
not be less than 150 mm, and the reinforcement shall<br />
be provided along the plane of the wall. <strong>The</strong> thickness<br />
of the web of the wall is taken as 300 mm. <strong>The</strong> material<br />
properties of RC structural walls are taken as per IS 456<br />
[IS 456:2000] (Figure 2). 6 <strong>The</strong> percentage of minimum<br />
longitudinal reinforcement used is 0.25% of the gross<br />
cross-sectional area in accordance with IS 13920. This<br />
minimum longitudinal reinforcement is distributed<br />
across the cross-section as per literature. 14 This study<br />
uses the basis of minimum longitudinal reinforcement<br />
as proposed in the said publication (Figure 5). <strong>The</strong><br />
discussion is based on P-M interaction curves of chosen<br />
wall sections.<br />
Walls without boundary elements<br />
Some changes are needed in the current code design<br />
philosophy as well as provisions. To establish the same,<br />
a comparative study between IS 13920 and the proposed<br />
Table 2. Error in Mu of a RC structural wall with crosssection<br />
aspect ratio 5.0 and reinforcement 0.25% as per<br />
IS 13920 and method given in literature 14<br />
ρ t<br />
Error in estimating M u (%)<br />
P u /P uz =0 P u /P uz =0.1 P u /P uz =0.2 P u /P uz =0.3 P u /P uz =0.4<br />
0.25 13.6 5.05 1.13 -1.64 -2.46<br />
0.3 12.46 4.67 0.95 -1.97 -2.75<br />
0.4 12.4 4.51 0.65 -2.57 -3.03<br />
0.5 11.11 4 0.6 -3.18 -3.29<br />
0.75 8.79 2.64 -1.08 -4.88 -7.69
method on estimating the strength of the structural<br />
element with aspect ratios 1.5 and 5.0 was carried out.<br />
To begin with, the error in the expression for M u (as<br />
given by Eqs.(1), (2) and (3)) is emphasised (Figure 6<br />
and 7). Figure 6 shows a kink due to the error, which is<br />
eliminated by using Eq.(3) and reflected in Figure 7; this<br />
kink occurs at the balanced section.<br />
MARCH 2012 <strong>The</strong> IndIan ConCreTe Journal<br />
49
Consider an RC column with cross-section aspect ratio<br />
of 1.5 and vertical reinforcement of 0.8%. Figure 8a<br />
shows that expression from IS 13920 (with correction)<br />
estimates a lower moment capacity of the section when<br />
compressive axial load P u is below the balanced level<br />
(and failure occurs by steel reaching the limiting strain in<br />
tension). Now, consider a RC structural wall with crosssection<br />
aspect ratio of 5.0 and vertical reinforcement of<br />
0.25%. Figure 8b shows that expression from IS 13920<br />
(with correction) estimates higher moment capacity of<br />
the section when compressive axial load P u is below the<br />
balanced level; Table 2 shows the error in estimating M u<br />
by IS 13920. <strong>The</strong> maximum error is 13.6%.<br />
Walls with boundary elements<br />
For RC structural walls with boundary elements, the<br />
axial compressive load demand on the boundary<br />
element as per IS 13920 is:<br />
50<br />
<strong>The</strong> IndIan ConCreTe Journal MARCH 2012<br />
......(12)<br />
where M u and M uv are the moment demand on the RC<br />
wall and moment capacity of the web alone of the RC<br />
wall, respectively. Eq.(12) is based on the assumption<br />
that the boundary elements of the RC wall (a) resist<br />
only pure axial load without any bending moment on<br />
it, and (b) contribute to overall wall moment capacity<br />
through moment couple between the axial loads on<br />
the boundary elements at wall ends separated by the<br />
distance C w (Figure 9).<br />
In IS 13920, the moment capacity of a wall with boundary<br />
elements is required to be calculated as a sum of the<br />
moment capacity of the web alone and moment couple<br />
due to axial capacity of boundary elements as shown<br />
in Figure 9; this procedure hereinafter is referred as the<br />
Principle of Superposition. But, it is to be noted that<br />
in order to fully comply with the assumptions behind<br />
this principle, the strain variation has to be linear and<br />
continuous across the cross-section whereas IS 13920<br />
considers separate strain conditions for wall/web and<br />
boundary elements. Hence, the Superposition Principle<br />
is invalid.<br />
<strong>The</strong> axial load capacity P uz under pure compression is<br />
given by:<br />
......(13)
where<br />
A c,BE is area of concrete in the boundary element, and<br />
A st,BE area of steel in the boundary element. Rewriting<br />
Eq.(12),<br />
......(14)<br />
This superposition approach for estimating the moment<br />
capacity of RC structural walls is not acceptable<br />
even when cross-sectional aspect ratio of wall is 20.0.<br />
Figure 10 shows P-M interaction diagrams of walls of<br />
different cross-sectional aspect ratios l w /t w of 3, 5, 10, 15<br />
and 20. Four curves are shown representing:<br />
1.<br />
2.<br />
3.<br />
4.<br />
IS 13920 : Web only<br />
Method given in literature Web only 14<br />
IS 13920 : Web and boundary elements<br />
Method given in literature: Web and boundary<br />
elements 14<br />
IS 13920 estimates higher moment of resistance of RC<br />
structural walls than method given in literature that<br />
is based on principles of mechanics; 14 for small crosssectional<br />
aspect ratios l w /t w , moment capacity of RC wall<br />
with web and boundary elements is amplified by use of<br />
the principle of superposition (Eq.(14)). <strong>The</strong> difference<br />
reduces with increase in cross-sectional aspect ratio l w /t w .<br />
<strong>The</strong> code expression for calculating M u for RC walls with<br />
boundary elements should be replaced with a rational<br />
approach similar to that suggested in this paper. Also,<br />
SP 16 1978 provides details for P-M interaction curves for<br />
rectangular column cross-sections with reinforcement<br />
distributed equally on two sides parallel to the axis<br />
of bending, and reinforcement distributed equally on<br />
four-sides. 4 Similar curves should be made available for<br />
use in design of RC structural walls with reinforcement<br />
distributed equally on two sides perpendicular to the<br />
axis of bending.<br />
Concluding remarks<br />
This analytical study on moment of resistance of RC<br />
structural walls discusses IS 13920:2008 provisions.<br />
Rational interpretation is suggested on the provisions<br />
available in IS 13920 for design of structural walls.<br />
Expressions are presented, which are consistent<br />
with fundamental principles of mechanics, namely<br />
equilibrium, compatibility and constitutive law. A<br />
numerical study is performed to study P-M interaction<br />
curves of structural walls of different cross-sectional<br />
aspect ratio. This study suggests that:<br />
Superposition principle should not be used to<br />
estimate moment capacity of RC structural walls<br />
with boundary elements as given in IS 13920;<br />
and strength of wall web and boundary elements<br />
should be estimated considering composite action<br />
of wall and web elements.<br />
IS 13920 provision as given in Annex A, should<br />
be corrected related to estimating moment<br />
capacity of RC structural walls without boundary<br />
elements; the error is in the expression for α 2 as<br />
given in Eq.(3).<br />
Consistent with the limiting states specified in<br />
Limit State Method of design for RC structural<br />
walls (when high yield strength deformed steel<br />
bars are used), in the derivation of the expression<br />
for ultimate moment capacity M u of the wall<br />
section, the limiting strain for steel should be<br />
taken as 0.002+0.87 f y /E s and not just 0.87 f y /E s<br />
as taken in Annex A of IS 13920. This should be<br />
reflected eventually in the expressions of two<br />
parameters β and , as<br />
and ......(15)<br />
MARCH 2012 <strong>The</strong> IndIan ConCreTe Journal<br />
......(16)<br />
IS 13920 provisions on expression for M u of structural<br />
walls needs to be revised accordingly. Eqs.(15) and (16)<br />
are purely based on strain variation across the section<br />
and position of neutral axis as shown in Figure 3.<br />
references<br />
1.<br />
2.<br />
3.<br />
1.<br />
2.<br />
3.<br />
Dasgupta,K., (2008), Improvement of Geometric Design of Reinforced Concrete<br />
Structural Wall to resist Earthquake Forces, Ph.D <strong>The</strong>sis, IIT Kanpur, June<br />
2008.<br />
Dasgupta,K., (2002), Investigation of IS Code Provisions on Seismic design of<br />
Reinforced Concrete Structural Wall, M.Tech thesis, IIT Kanpur, August 2002<br />
IS:456, (2000), <strong>Indian</strong> Standard Code of Practice for Plain and Reinforced Concrete,<br />
Bureau of <strong>Indian</strong> Standards, New Delhi<br />
51
4.<br />
5.<br />
6.<br />
7.<br />
8.<br />
9.<br />
10.<br />
11.<br />
12.<br />
13.<br />
14.<br />
52<br />
SP:16, (1978), Design Aids for Reinforced Concrete to IS: 456-1978, Bureau of<br />
<strong>Indian</strong> Standards, New Delhi<br />
SP:24, (1983), Explanatory Handbook on <strong>Indian</strong> Standard Code of Practice for<br />
Plain and Reinforced<br />
Sinha,S.N., (2008), Reinforced Concrete Design, Tata Mc-Graw Hill, 2008<br />
Varghese,P.C., (2007), Advanced Reinforced Concrete Design, Prentice Hall (India),<br />
New Delhi<br />
Dasgupta,K., and Murty,C.V.R., (2005), “Seismic Design of RC Columns and<br />
Wall Sections, Part I: Consistent Limit State Design Philosophy,” <strong>The</strong> <strong>Indian</strong><br />
Concrete Journal, March 2005, pp 33-42<br />
Dasgupta,K., Murty,C.V.R., and Agarwal,S.K., (2003), “Seismic Shear Design<br />
of RC Structural Walls – Part I: Review of Code Provisions,” <strong>Indian</strong> Concrete<br />
Journal, November 2003, pp 1423-1430<br />
Dasgupta,K., Murty,C.V.R., and Agarwal,S.K., (2003), “Seismic Shear Design<br />
of Reinforced Concrete Structural Walls - Part II: Numerical Investigation<br />
of IS:13920-1993 Provisions,” <strong>Indian</strong> Concrete Journal, November 2003, pp<br />
1459-1468<br />
IS:13920, (2008), <strong>Indian</strong> Standard Code of Practice for Ductile Detailing of<br />
Reinforced Concrete Structures subjected to Seismic Forces, Bureau of <strong>Indian</strong><br />
Standards, New Delhi<br />
Medhakar,M.S., and Jain,S.K., (1993), “Seismic Behavior, Design and<br />
Detailing of RC Shear Walls, Part I: Behaviour and Strength,” <strong>The</strong> <strong>Indian</strong><br />
Concrete Journal, July 1993, Vol.7, pp 311-318<br />
Medhakar,M.S., and Jain,S.K., (1993), “Seismic Behavior, Design and<br />
Detailing of RC Shear Walls, Part II: Design and Detailing,” <strong>The</strong> <strong>Indian</strong><br />
Concrete Journal, September 1993, pp 451-457<br />
Rohit,D.H.H., Narahari,P., Sharma,R., Jaiswal,A., Murty,C.V.R., (2011),<br />
“When RC columns become RC Structural Walls,” <strong>The</strong> <strong>Indian</strong> Concrete Journal,<br />
May 2011, Vol. 85, No. 5, pp 35-45<br />
D.H.H. Rohit is Graduate Pway Engineer at<br />
WS Atkins (India) Private Limited. His research<br />
interests include design and analysis of concrete<br />
structures, and earthquake engineering.<br />
P. Narahari is a Field Engineer at NTPC-<br />
BHEL Power Projects Ltd., currently posted in<br />
Mannavaram, Andhra Pradesh. His research<br />
interests include seismic analysis and design of<br />
steel and RC structures.<br />
Arvind Kumar Jaiswal is Chief Consulting<br />
Engineer at EON Designers, Secunderabad.<br />
He is also a Visiting Faculty at Engineering<br />
Staff College, National Council for Cement &<br />
Building Materials, and National Academy of<br />
Construction. His areas of interests include 3D<br />
computer modelling of structures, behaviour<br />
of RC frames due to earthquake loads, structural design<br />
software validation, large span structures, continuing<br />
education, and capacity building in earthquake engineering<br />
education for professional engineers.<br />
C.V.R. Murty is a Professor in Department of Civil<br />
Engineering at the <strong>Indian</strong> Institute of Technology<br />
Madras, Chennai. His research interests include<br />
the non-linear behaviour of reinforced concrete<br />
and steel buildings and bridges, and of limit<br />
state design of reinforced concrete, relevant to<br />
earthquake-resistant structures. He is a member<br />
of the Earthquake Engineering Committee of the Bureau of<br />
<strong>Indian</strong> Standards.<br />
<strong>The</strong> IndIan ConCreTe Journal MARCH 2012<br />
Letter to the Editor<br />
Design of confinement<br />
reinforcement for RC columns<br />
Dear Sir,<br />
This has reference to the Point of View by<br />
Dr. N. Subramanian titled " Design of confinement<br />
reinforcement for RC columns" published in<br />
the ICJ issue of August 2011, Vol. 85, No. 8.<br />
<strong>The</strong> topic of Dr. Subramanian is nice and<br />
informative. I feel that confinement of stirrups is<br />
required at the supporting junctions to withstand<br />
more shear forces. This statement is missing in<br />
IS codes. On the other hand, ACI 318 clearly states<br />
that confined stirrups is required at supporting<br />
points, for example, in columns junctions between<br />
footing and column and at the floor level to<br />
handle the horizontal forces transferring due to<br />
diaphragm effect. I suggest that we take up this<br />
in the next revision of IS codes. <strong>The</strong> same type<br />
confinement of stirrups required in the beams<br />
supporting points also.<br />
Thanking you and with regards,<br />
Shridhar<br />
Technical Manager<br />
TEEMAGE PRECAST IN<br />
39/2, N.G. Palayam Pirivu, <strong>The</strong>kkalur,<br />
Avinashi, Tirupur 641 654, Tamilnadu
Point of View<br />
Are heritage structures in Tamilnadu seismically vulnerable?<br />
This article is written with the sole purpose of starting<br />
a healthy discussion and providing a different point<br />
of view on the earthquake vulnerability of Chennai’s<br />
historical buildings such as Fort St. George and Madras<br />
High Court, following the revision in IS 1893:2002<br />
changing Chennai’s earthquake proneness from Zone<br />
II to Zone III.<br />
<strong>The</strong> basis for this discussion is a report published in a<br />
Chennai daily using somewhat debatable observations<br />
made by a well-known Professor and structural<br />
engineering consultant. <strong>The</strong> expert is reported to have<br />
said that:<br />
From colonial structures such as Fort St. George to single<br />
pier flyovers and 20-storey high rise buildings springing<br />
up in the suburbs, there is a need to check their earthquake<br />
resistance and carry out seismic retrofitting<br />
While delivering a lecture at a well known University<br />
in Chennai, the expert is reported to have further stated<br />
that:<br />
Fort St. George, seat of power in the state, would not<br />
withstand earth quakes of Zone 2 intensity”. (When the<br />
codes for the earthquake were revised in 2002, Chennai was<br />
moved up to Zone 3 up from Zone 2 as it was found to be<br />
more vulnerable). “No effort has been made to strengthen<br />
it” said the expert.<br />
A. Veerappan<br />
Similar is the case of the Madras High Court buildings.<br />
In Ripon <strong>Buildings</strong>, modifications have been suggested as<br />
part of extensive rehabilitation, but as of today it was also<br />
vulnerable, said the retired professor.<br />
<strong>The</strong> thickness of the shear walls, the ground floor car<br />
park and the use of flat slabs in high-rises were also quite<br />
vulnerable to earthquakes, as they would not be able to<br />
resist the “lateral load”.<br />
MARCH 2012 <strong>The</strong> IndIan ConCreTe Journal<br />
53
<strong>The</strong> expert claims that his study on eight modern<br />
apartment buildings in the city has revealed that seven<br />
of them were not earthquake-resistant. He further states<br />
that the single-pier bridges in the city on Pantheon<br />
Road, Royapettah High Road and TTK Road would<br />
suffer from “functional vulnerability” in the event of<br />
an earthquake. To reinforce his point he showed slides<br />
featuring quake damaged bridges that were designed<br />
with single-piers. For some other bridges in Chennai his<br />
recommendation was for providing seismic arresters to<br />
prevent their collapse in the event of an earthquake. He<br />
listed inadequate planning, design and application, poor<br />
code compliance, non-engineered buildings, inadequate<br />
detailing of reinforcements, extensions, alterations and<br />
encroachment as the reasons for the vulnerability of<br />
the Chennai monuments and buildings of historical<br />
importance to earthquake forces.<br />
54<br />
<strong>The</strong> IndIan ConCreTe Journal MARCH 2012<br />
Point of View<br />
In my opinion these observations must be examined in<br />
detail and the context understood.<br />
Perhaps these statements were made with the purpose of<br />
creating an awareness among civil engineering students<br />
and faculty about the importance of designing structures,<br />
both load bearing and RC framed structures, taking the<br />
seismic forces into account and following IS 1893 : 2002.<br />
Perhaps the expert was also right in pointing out that<br />
many of the multi-storeyed apartment buildings with<br />
stilt (soft storey) constructed recently were not designed<br />
to resist even an earthquake of moderate intensity.<br />
However, to me most of the observations appeared to<br />
be generalised statements made without any specific<br />
data on building distresses and corresponding past<br />
earthquakes.
In my opinion, even though many of buildings the<br />
expert referred to were designed 100 years ago, without<br />
taking earthquake forces into consideration, they might<br />
not get distressed in the event of an earthquake simply<br />
because their layout, wall thickness and other systems<br />
for transmitting loads were adequately constructed<br />
based on the knowledge available then.<br />
And it is not only true for Chennai buildings, throughout<br />
the world century old buildings and monuments were<br />
not designed constructed considering earthquake<br />
forces.<br />
However, renowned architects and builders of the yester<br />
years constructed buildings by designing them following<br />
the norms prevailing then. <strong>The</strong>y especially included<br />
wider foundation base, thicker walls (say min 1’6” to<br />
5’0”) that distributed loads more or less uniformly;<br />
more particularly they ensured that the centre of<br />
gravity (CG) of the load system was below 1/3 height<br />
of the structure, thereby providing stability, safety and<br />
serviceability to the structure. <strong>The</strong>y also made sure that<br />
the buildings were without any tilt or overtapping. Many<br />
such constructions have performed well until now.<br />
Chennai‘s previous classification of earthquake<br />
proneness was under zone II. In 2002, it was changed to<br />
zone III in IS 1893 (Part – I): 2002 based on the digitised<br />
data of Survey of India.<br />
Would such a re-rating of earthquake proneness cause<br />
any severe effect on the existing century old structures?<br />
Should a mere change in the classification be the basis for<br />
worrying about the stability of century old structures?<br />
Point of View<br />
<strong>The</strong> answer to these questions lies in examining the<br />
structures and analysing their construction data. To<br />
begin with, TN never experienced an earthquake<br />
exceeding 6 on the Richter scale. <strong>The</strong> quakes of 1966<br />
and 2001 measured 5.4 and 5.6 on the Richter scale<br />
respectively.<br />
<strong>The</strong> change in classification means that in future the<br />
buildings have to be planned, designed and constructed<br />
providing adequate safety against the likely Zone III<br />
seismic forces (3.5 to 4.20 in Ritcher Scale)..<br />
In order to effectively resist the seismic and lateral forces,<br />
one of the important criteria specified in the building<br />
construction in general and in the framed structures in<br />
particular is the provision of strong column and weak<br />
beams. In other words, the stiffness of columns, piers<br />
or pillars should always be greater than the stiffness of<br />
beams and supporting floor or roof slabs.<br />
An examination of the old buildings in Tamil Nadu<br />
suggests that this theory was indeed followed in<br />
Chennai’s Fort. St.George Secretarial buildings, Rajaji<br />
Hall, Cheppakkam PWD <strong>Buildings</strong>, Presidency College,<br />
High Court <strong>Buildings</strong>, Madurai’s Thirumalai Nayakkar<br />
Mahal, Thanjavur’s Serfoji Palace and in many<br />
multitiered Hindu Temples.<br />
In sizing piers and the thickness of the load bearing<br />
walls the engineers of yester years have taken care to<br />
effectively prevent distress in the structure due to lateral<br />
loads including from seismic forces by constructing<br />
stronger pillars, piers, walls compared to floor, roof<br />
beams and slabs.<br />
MARCH 2012 <strong>The</strong> IndIan ConCreTe Journal<br />
55
Similarly, the foundation base of these buildings are<br />
symmetrical either as a square or rectangular, without<br />
any eccentricity or cantilever projections. Building such<br />
foundations is one of the criteria specified for earthquake<br />
resistant structures. <strong>The</strong> Fort St. George Secretariat<br />
buildings and multistoreyed Building (MSB) satisfy this<br />
important criterion and thereby minimize the effect of<br />
earthquake forces. Many of them are supported on a<br />
serried of well foundations?<br />
To resist lateral forces, some other factors that play an<br />
important role in the foundation system are the width of<br />
the foundation and thickness of the load bearing walls.<br />
In many of Tamil Nadu’s historical and monumental<br />
buildings including the palaces and temples, the base<br />
width of the foundation is in the range of 5’0” to 10’0”<br />
or more and the ground floor wall thickness is in the<br />
range of 1’6” to 3’0”. Further the CG of the entire load<br />
system is ingeniously arranged to be at 1/3 rd of the<br />
height of the buildings. Further, Height/Breadth/Width<br />
or Length/Breadth value is also kept well within 2 to<br />
56<br />
<strong>The</strong> IndIan ConCreTe Journal MARCH 2012<br />
Point of View<br />
impart safety and stability to the structure against lateral<br />
forces including earthquake.<br />
•<br />
<strong>The</strong> Fort St.George and New MSB Secretariat<br />
buildings also satisfy these criteria. <strong>The</strong>y are<br />
therefore are not likely to get distressed due to<br />
earthquake forces of the intensity as experienced<br />
in the past.<br />
Yet another important aspect in these structures is the<br />
load bearing masonry construction with allowable<br />
compressive and tensile bearing stresses.<br />
•<br />
<strong>The</strong> factor of safety in many of these old<br />
constructions is 10 (not 3) in compression and 8<br />
in bending /tension as against ( 1.5 x 1.5 =2.25)<br />
2.25 specified in IS: 456 - 2000. Due to this higher<br />
factor of safety adopted in the load bearing<br />
masonry structures such as Fort St. George<br />
Secretariat and other historical buildings, the<br />
safety and stability of these structures against
seismic forces is adequate.<br />
<strong>The</strong>se details explain why<br />
these buildings did not<br />
get affected during the<br />
earthquakes of 1966 and<br />
2001.<br />
<strong>The</strong> design concept for structural<br />
use of unreinforced masonry is<br />
given in TN Building Practice,<br />
NBC of India – 2005 , IS 1905<br />
– 1985 - Code of Practice and<br />
SP : 20 (S & T) – 1991 Hand<br />
book on Masonry Design and<br />
Construction – BIS. Although the<br />
present day structural engineers<br />
and design experts are highly knowledgeable about<br />
framed RC structures, their exposure to the nuances of<br />
load bearing masonry structures is not enough. It would<br />
not be a surprise if many of them are not even aware of<br />
what the guidelines provide in IS : 1905 – 1985 and SP<br />
: 20 (S&T) – 1991.<br />
Point of View<br />
More than theory, analysis and design of structures<br />
conforming to the latest codal provisions, the<br />
performance of the structure during its life time<br />
should be the basis for vulnerability comments.<br />
Needless to say that buildings such as St. George,<br />
Chennai High Court and other Secretariat buildings<br />
MARCH 2012 <strong>The</strong> IndIan ConCreTe Journal<br />
57
withstood and performed excellently<br />
during the earthquake in 1966 and<br />
2001.<br />
<strong>The</strong> expert’s comment about the<br />
vulnerability of single piered flyovers<br />
on Pantheon Road and TTK Road,<br />
casting doubts on the ability of<br />
these structures to withstand the<br />
earthquake forces corresponding to<br />
Zone II / III is also debatable. Those<br />
involved in the construction of these<br />
structures were expected to follow the<br />
applicable design codes in designing<br />
and constructing the flyovers’<br />
structural elements including<br />
single piered columns (with double<br />
cantilevers). <strong>The</strong> design of these<br />
structures follows IRC Standards<br />
and includes seismic forces. Only<br />
after satisfying themselves about<br />
the competitiveness of the designs<br />
do the authorities approve them for<br />
execution. <strong>The</strong>refore, these flyovers<br />
are also not likely to suffer from any<br />
distress during earthquakes of the<br />
intensity as experienced in the past.<br />
For the sake of this discussion it<br />
is presumed that the expert has<br />
analysed and checked the stability<br />
of these single piered columns as<br />
free standing cantilever. However,<br />
design practices suggest that these<br />
single piered columns, from their<br />
real edge conditions, are to be treated<br />
as propped cantilever (since sway is<br />
adequately resisted and restrained<br />
by the heavy beam elements, under<br />
which the intensity of moment due<br />
to lateral load is reduced to ¼ of that<br />
of the free standing cantilever). In<br />
view of this fact, the approving civic<br />
authorities are encouraged to check<br />
the design details of the structures<br />
and reply to the expert based on the<br />
data.<br />
Notwithstanding the above, it is<br />
necessary to check the safety and<br />
stability of the historical buildings<br />
and present day RC framed structures<br />
with respect to likely earthquake<br />
58<br />
<strong>The</strong> IndIan ConCreTe Journal MARCH 2012<br />
Point of View
forces and take suitable measures as specified in the<br />
following codes.<br />
1.<br />
2.<br />
3.<br />
4.<br />
IS 1893:2002 <strong>Indian</strong> Standard criteria for<br />
Earthquake Resistant Design of Structures<br />
IS 4326:1993 COP – Earthquake Resistant Design<br />
and Construction of <strong>Buildings</strong>.<br />
IS 13828:1993 <strong>Indian</strong> Standard – Guidelines for<br />
improving Earthquake resistance of Low strength<br />
masonry buildings<br />
IS 13920:1993 Ductile Detailing of RC Structures<br />
subjected to Seismic forces.<br />
In this connection it is worthwhile to consider the<br />
opinion of Prof. S.K.Duggal, Prof of Civil Engineering,<br />
Motilal Nehru National Institute of Tech, Allahabad<br />
and author of the book titled “Earthquake Resistant<br />
Design of Structures” published Oxford University of<br />
Press (2007).<br />
Point of View<br />
“Severity of ground shaking at a given location during an<br />
earthquake may be minor (occurs frequently), moderate<br />
(occurs occasionally) or strong (occurs rarely). <strong>The</strong><br />
probability of a strong earthquake occurring within the<br />
expected life of a structure is very low. Statistically,<br />
about 800 earthquakes of magnitude 5.0-5.9 occur in<br />
the world, while only about 18 of magnitude above 7.0<br />
are registered annually. If a building is designed to be<br />
earthquake – proof for a rare but strong earthquake, it will<br />
be robust but too expensive. <strong>The</strong> most logical approach to<br />
the seismic design problem is to accept the uncertainly of<br />
the seismic phenomenon. Consequently, the main elements<br />
of the structure are designed to have sufficient ductility,<br />
allowing the structure to sway back and forth during a<br />
major earthquake, so that is withstands the earthquake<br />
with some damage, but without collapse. An earthquakeresistant<br />
structure resists the effects of ground shaking;<br />
although it may get severely damaged, it does not collapse<br />
during a strong earthquake. This implies that the damage<br />
should be controlled to acceptable levels, preserving the<br />
lives of the occupants of the building at a reasonable cost.<br />
Engineers thus tend to make the structures earthquake<br />
resistant”.<br />
MARCH 2012 <strong>The</strong> IndIan ConCreTe Journal<br />
59
Finally, the following may be suggested for making the<br />
buildings and structures resist the seismic forces to a<br />
reasonable extent.<br />
60<br />
1.<br />
2.<br />
3.<br />
4.<br />
5.<br />
6.<br />
7.<br />
Construct RC / Concrete Tie beams in both<br />
directions at Grade beam level (just below the<br />
EGL)<br />
Provide RC continuous lintel at lintel level<br />
Have RC Floor / Roof beams in both directions<br />
at Floor level / Roof level.<br />
Reinforce the four sides / circumference of large<br />
openings<br />
Separate the asymmetrically loaded / projected<br />
cantilever elements from the main structures<br />
Reinforcing load bearing masonry walls at corners<br />
and junctions as shown in the enclosed sketch.<br />
Have compulsory provision of Ductile detailing<br />
of Rebars in foundation footings, Columns,<br />
Beams, Slabs and beam – column junctions as<br />
specified and detailed in IS 13920 – 1993 (Sketches<br />
enclosed)<br />
<strong>The</strong> IndIan ConCreTe Journal MARCH 2012<br />
Point of View<br />
What is your opinion?<br />
8.<br />
Adopt Grade of concrete and steel Rebars<br />
according to exposure conditions as specified<br />
in Table No. 3 & No. 5 of IS : 456 -2000 Code of<br />
practice for Plain & Reinforced concrete – BIS<br />
<strong>The</strong>se measures are sufficient to protect buildings and<br />
structures against the seismic forces expected to occur<br />
in and around Chennai. So the learned Professor’s<br />
statements should be seen as a statement of caution<br />
and his stress on the importance of designing and<br />
constructing buildings and structures against the<br />
codified earthquake forces must be understood,<br />
appreciated and adopted in practice to have durable<br />
structures in the state of Tamil Nadu.<br />
A. Veerappan, ME(Struct) FIE, MICI, Dip LL and<br />
AL is former Chief Engineer, Tamil Nadu Public<br />
Works Department. Presently, he is a structural<br />
consultant and state secretary of TNPWD Senior<br />
Engineers Association. He has delivered more<br />
than 2500 technical lectures to practising<br />
engineers (government engineers in particular).<br />
He has edited and published 40 technical handbooks for<br />
day-to-day use of field engineers and engineering students.<br />
He has won several prizes for his engineering writings,<br />
which have highlighted the importance of adopting modern<br />
constructions techniques and cost effective construction<br />
materials including the use of construction chemicals. He has<br />
many years of experience in restoration and strengthening<br />
of distressed buildings and foundations.<br />
Do you wish to share your thoughts/views regarding the<br />
prevalent construction practices in the construction industry<br />
with our readers?<br />
If yes, <strong>The</strong> <strong>Indian</strong> Concrete Journal gives a chance to<br />
the engineering fraternity to express their views in its<br />
columns.<br />
<strong>The</strong>se shall be reviewed by a panel of experts. Your views could<br />
be limited to about 2000 words supplemented with good<br />
photographs and neat line drawings. Send them across by e-mail<br />
to editor@icjonline.com.
Postal Regn. No. : Tech/47- 914/MBI/2012-2014. Posted at Patrika Channel Sorting Office, Mumbai 400 001 on the 1st of<br />
every month. RNI No. 13986/57.<br />
Building an Infrastructure Strong India<br />
Extradosed <strong>Bridge</strong> built by Gammon for Delhi Metro<br />
Gammon India is not only one of the leading Civil Engineering construction companies in India, but has also<br />
built the largest number of bridges in the whole of the Commonwealth. Over nearly a century, Gammon has<br />
established an admirable track record of executing prestigious engineering and construction projects... inspired<br />
by a spirit of enterprise and a commitment to build a strong India.<br />
Power Projects I Environmental Projects I Marine Projects I Pipeline Projects I Public Utility Services<br />
BOT Contracts I Marine Projects I Heavy Industrial Structures I Specialised Foundation Works<br />
Gammon Group of Companies<br />
Gammon India Limited<br />
Gammon House, Veer Savarkar Marg, Prabhadevi, Mumbai 400025. India<br />
Tel. +91 22 6744 4000 Fax. +91 22 6744 4105 www.gammonindia.com<br />
Printed, published and edited by A.N. Singh on behalf of ACC Limited.<br />
Printed at Classic Prints, B-25G, Malad Indl. Estate, Ramchandra Lane Extn., Kachpada, Malad (W), Mumbai 400 064.<br />
Published at ACC Limited L.B. Shastri Marg, Near Teen Haath Naka, Thane (W) 400604.