real-world applications - MathnMind
real-world applications - MathnMind
real-world applications - MathnMind

Create successful ePaper yourself
Turn your PDF publications into a flip-book with our unique Google optimized e-Paper software.
Real-World<br />
Transparencies and<br />
Masters
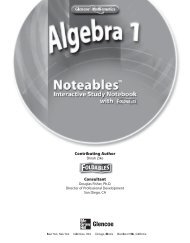
Glencoe/McGraw-Hill<br />
Copyright © by the McGraw-Hill Companies, Inc. All rights reserved.<br />
Printed in the United States of America. Permission is granted to reproduce the<br />
blackline masters contained herein on the condition that such material be<br />
reproduced only for classroom use; be provided to students, teacher, and<br />
families without charge; and be used solely in conjunction with Glencoe Algebra 1.<br />
Any other reproduction, for use or sale, is prohibited without prior written<br />
permission of the publisher<br />
Send all inquiries to:<br />
Glencoe/McGraw-Hill<br />
8787 Orion Place<br />
Columbus, OH 43240<br />
Transparency Credit<br />
Photo Credits<br />
1 ©Malcom Fife/PhotoDisc<br />
2 ©Kim Steele/PhotoDisc<br />
3 ©Jeremy Woodhouse/PhotoDisc<br />
4 ©Don Farrall/PhotoDisc<br />
5 ©Ryan McVay/PhotoDisc<br />
6 ©S. Meltzer/PhotoLink/PhotoDisc<br />
7 ©U.S. Savings Bonds, Department of the Treasury<br />
8 ©StockTrek/PhotoDisc<br />
9 ©CORBIS<br />
10 ©Tim Hall/PhotoDisc<br />
11 ©Corbis Images<br />
12 ©ComStock IMAGES<br />
13 ©Digital Vision/PictureQuest<br />
14 ©CORBIS<br />
ISBN: 0-07-827756-6 Algebra 1 Real-World Transparencies<br />
12345678910 080 11100908070605040302
CONTENTS<br />
Guide to Using the Real-World Transparencies and Masters. . . . . . . . iv<br />
Transparency/Title Use with Lesson<br />
1 About the World’s Major Producers and<br />
Consumers of Primary Energy. . . . . . . . . . . . . . . . . . . . . 1-8<br />
2 About Stock Trade. . . . . . . . . . . . . . . . . . . . . . . . . . . . . . . . 2-3<br />
3 About Population Growth of U.S. Metropolitan Areas. . . . 3-7<br />
4 About Interest on the U.S. Public Debt . . . . . . . . . . . . . . . . 4-6<br />
5 About Comparison Shopping and Phone Rates . . . . . . . . . 5-3<br />
6 About United States Postal Rates . . . . . . . . . . . . . . . . . . . . 6-4<br />
7 About Savings Bonds . . . . . . . . . . . . . . . . . . . . . . . . . . . . . 7-1<br />
8 About Those Massive Planets . . . . . . . . . . . . . . . . . . . . . . . 8-3<br />
9 About Frames and Art . . . . . . . . . . . . . . . . . . . . . . . . . . . . . 9-6<br />
10 About Per Capita Personal Income . . . . . . . . . . . . . . . . . . 10-6<br />
11 About American Softball . . . . . . . . . . . . . . . . . . . . . . . . . . 11-4<br />
12 About Consumer Price Index . . . . . . . . . . . . . . . . . . . . . . 12-2<br />
13 About Gestation and Longevity of Animals . . . . . . . . . . . 13-4<br />
14 About Games and Probability . . . . . . . . . . . . . . . . . . . . . . 14-5<br />
iii
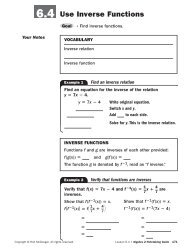
Guide to Using the<br />
Real-World Transparencies and Masters<br />
The Real-World Transparencies and Masters activities<br />
involve two parts—Student Recording Sheet and Real-<br />
World Transparency. Each Student Recording Sheet has a<br />
reading passage followed by a series of questions that can be<br />
answered from information in the passage and/or on the<br />
accompanying full-color transparency located at the back of<br />
this book. The final questions on each master relate what<br />
the mathematics students are learning to the topic of the<br />
transparency.<br />
Display the transparency on the overhead projector. Give<br />
students a few minutes to comment on what they see or any<br />
patterns they observe from the data presented. Then give<br />
them copies of the Student Recording Sheet to read and<br />
complete.<br />
Sample answers for each master are printed on the back of<br />
the master so that you can keep the master and answer key<br />
together if the master is removed from this book.<br />
When to Use Each of these transparencies has been<br />
correlated to a lesson in Glencoe Algebra 1. You can use<br />
the activity with that lesson or any lesson that follows<br />
the recommended lesson. The activity can be used as an<br />
introduction to the mathematical concept being presented<br />
or as a follow-up activity when time permits.<br />
iv
NAME _______________________________________________________ DATE _____________________________________<br />
REAL-WORLD APPLICATIONS<br />
STUDENT ACTIVITY for Transparency 1<br />
Use with Lesson 1-8.<br />
About the World’s Major Producers and Consumers of Primary Energy<br />
Many everyday activities of Americans are extremely energy dependent. For example, think<br />
about a mathematics classroom in an energy sense. Having the lights on consumes electricity.<br />
The air temperature is regulated by heating and cooling systems that directly or indirectly<br />
consume fossil fuels. Pens, pencils, and calculators are manufactured by machines that require<br />
energy to operate. There are many other ways that energy is used directly or indirectly.<br />
The amount of energy a person consumes and the amount of energy that needs to be produced<br />
on an individual’s behalf may be reduced through improved energy efficiency. New, more<br />
efficient light bulbs, appliances, and household products are becoming increasingly available<br />
to consumers. Until technology catches up with energy consumption, however, turning off<br />
unnecessary lights and being more energy conscious are steps in the right direction.<br />
Directions: Use what you have seen and read to answer the following questions.<br />
1. Which countries shown in the graphs consume more energy than they produce?<br />
2. Which countries produce more energy than they consume?<br />
3. In 1999, the United States and Russia combined to produce 30% of the <strong>world</strong>’s energy. How much<br />
energy was produced in the <strong>world</strong> in 1999?<br />
4. In that same year, the United States, China, and Russia consumed 41% of the <strong>world</strong>’s energy. How<br />
much energy was consumed in the <strong>world</strong> in 1999?<br />
Making the Connection<br />
5. Working together with your family members, estimate how much money your family spends each year<br />
on energy.<br />
© Glencoe/McGraw-Hill 1 Glencoe Algebra 1
NAME _______________________________________________________ DATE _____________________________________<br />
REAL-WORLD APPLICATIONS<br />
STUDENT ACTIVITY for Transparency 1<br />
Use with Lesson 1-8.<br />
About the World’s Major Producers and Consumers of Primary Energy<br />
Many everyday activities of Americans are extremely energy dependent. For example, think<br />
about a mathematics classroom in an energy sense. Having the lights on consumes electricity.<br />
The air temperature is regulated by heating and cooling systems that directly or indirectly<br />
consume fossil fuels. Pens, pencils, and calculators are manufactured by machines that require<br />
energy to operate. There are many other ways that energy is used directly or indirectly.<br />
The amount of energy a person consumes and the amount of energy that needs to be produced<br />
on an individual’s behalf may be reduced through improved energy efficiency. New, more<br />
efficient light bulbs, appliances, and household products are becoming increasingly available<br />
to consumers. Until technology catches up with energy consumption, however, turning off<br />
unnecessary lights and being more energy conscious are steps in the right direction.<br />
Directions: Use what you have seen and read to answer the following questions.<br />
1. Which countries shown in the graphs consume more energy than they produce? United States,<br />
China, Japan, Germany, India, France, and Brazil consume more energy than they<br />
produce.<br />
2. Which countries produce more energy than they consume? Russia, Saudi Arabia, Canada,<br />
United Kingdom, Iran, Mexico, and Australia produce more energy than they<br />
consume.<br />
3. In 1999, the United States and Russia combined to produce 30% of the <strong>world</strong>’s energy. How much<br />
energy was produced in the <strong>world</strong> in 1999? In 1999, 379.4 quadrillion Btu of energy were<br />
produced.<br />
4. In that same year, the United States, China, and Russia consumed 41% of the <strong>world</strong>’s energy. How<br />
much energy was consumed in the <strong>world</strong> in 1999? In 1999, 377.9 quadrillion Btu were<br />
consumed.<br />
Making the Connection<br />
5. Working together with your family members, estimate how much money your family spends each year<br />
on energy. See students’ work.<br />
© Glencoe/McGraw-Hill T1 Glencoe Algebra 1
NAME _______________________________________________________ DATE _____________________________________<br />
REAL-WORLD APPLICATIONS<br />
STUDENT ACTIVITY for Transparency 2<br />
Use with Lesson 2-3.<br />
About Stock Trade<br />
Stock exchanges, organizations that assist investors with the buying and selling of stocks and<br />
bonds, can be found in many cities around the <strong>world</strong>. The New York Stock Exchange is the<br />
largest of the twelve stock exchanges in the United States. Trades may be made on the “floor” of<br />
a stock exchange only by a stockbroker, a member of the stock exchange. Individual investors<br />
must place orders to buy and sell through a brokerage firm that is affiliated with a member.<br />
Technology is changing how investors buy and sell stocks and bonds. In 1999, computers<br />
opened the door for trading to occur 24 hours a day. The volumes of shares traded using<br />
computers and telecommunication technology are exceeding the share volumes of stock<br />
exchanges, such as the New York Stock Exchange.<br />
The financial section of a newspaper lists the price of a share of stock and its price change from<br />
the previous trading day. In 2001, the stock market changed the method of reporting; prior to<br />
2001, stocks were reported using fractions. Transparency 2 shows the top stocks, by number of<br />
shares, traded on the New York Stock Exchange, for September 4, 2001.<br />
Directions: Use what you have seen and read to answer the following questions.<br />
1. What was the closing value of the shares of General Electric Co. that were traded?<br />
2. Which stock showed the greatest price increase? Explain why.<br />
3. What was the previous day’s closing price per share for EMC Corp.?<br />
4. If an investor had purchased 100 shares of General Electric Co. at $45.00 a share and sold those<br />
shares at the September 4 2001 closing price, how much would the investor have gained or lost in<br />
this investment?<br />
Making the Connection<br />
5. Consult a newspaper to find the current price per share of one or more of the stocks shown in<br />
Transparency 2. Describe the change since September 4, 2001.<br />
6. Besides stock, what other investment products are monitored in the business sections of newspapers?<br />
© Glencoe/McGraw-Hill 2 Glencoe Algebra 1
NAME _______________________________________________________ DATE _____________________________________<br />
REAL-WORLD APPLICATIONS<br />
STUDENT ACTIVITY for Transparency 2<br />
Use with Lesson 2-3.<br />
About Stock Trade<br />
Stock exchanges, organizations that assist investors with the buying and selling of stocks and<br />
bonds, can be found in many cities around the <strong>world</strong>. The New York Stock Exchange is the<br />
largest of the twelve stock exchanges in the United States. Trades may be made on the “floor” of<br />
a stock exchange only by a stockbroker, a member of the stock exchange. Individual investors<br />
must place orders to buy and sell through a brokerage firm that is affiliated with a member.<br />
Technology is changing how investors buy and sell stocks and bonds. In 1999, computers<br />
opened the door for trading to occur 24 hours a day. The volumes of shares traded using<br />
computers and telecommunication technology are exceeding the share volumes of stock<br />
exchanges, such as the New York Stock Exchange.<br />
The financial section of a newspaper lists the price of a share of stock and its price change from<br />
the previous trading day. In 2001, the stock market changed the method of reporting; prior to<br />
2001, stocks were reported using fractions. Transparency 2 shows the top stocks, by number of<br />
shares, traded on the New York Stock Exchange, for September 4, 2001.<br />
Directions: Use what you have seen and read to answer the following questions.<br />
1. What was the closing value of the shares of General Electric Co. that were traded?<br />
2. Which stock showed the greatest price increase? Explain why.<br />
Johnson & Johnson stock increased by $3.44.<br />
3. What was the previous day’s closing price per share for EMC Corp.?<br />
$40.83<br />
Johnson & Johnson; the<br />
$15.46<br />
4. If an investor had purchased 100 shares of General Electric Co. at $45.00 a share and sold those<br />
shares at the September 4 2001 closing price, how much would the investor have gained or lost in<br />
this investment? The investor would have lost $417.<br />
Making the Connection<br />
5. Consult a newspaper to find the current price per share of one or more of the stocks shown in<br />
Transparency 2. Describe the change since September 4, 2001. See students’ work.<br />
6. Besides stock, what other investment products are monitored in the business sections of newspapers?<br />
See students’ work.<br />
© Glencoe/McGraw-Hill T2 Glencoe Algebra 1
NAME _______________________________________________________ DATE _____________________________________<br />
REAL-WORLD APPLICATIONS<br />
STUDENT ACTIVITY for Transparency 3<br />
Use with Lesson 3-7.<br />
About Population Growth of U.S. Metropolitan Areas<br />
Census 2000 showed that the population in the United States increased by 13.2% from the<br />
1990 figures. This is the largest census-to-census increase in American history. Every state<br />
showed an increase in population, with Nevada showing the highest percent increase, 66.3%. In<br />
2000, metropolitan areas were home to about 80% of Americans, an increase of 14% from the<br />
last census.<br />
The graph shows both the population figures and the percent increase in population for the six<br />
largest metropolitan areas in the United States. Notice that some metropolitan areas extend<br />
across state lines while others fall within state boundaries.<br />
Directions: Use what you have seen and read to answer the following questions.<br />
1. In 1990, the population of the Los Angeles metropolitan area was almost 14.5 million people.<br />
What was the increase in population in the Los Angeles metropolitan area between 1990 and 2000?<br />
2. If the same rate of growth that occurred between 1990 and 2000 continues, what will be the<br />
population of the Washington-Baltimore area in 2010?<br />
3. How is it possible that the San Francisco and Philadelphia areas have about the same population, but<br />
have a different percent increase in population?<br />
4. The Dallas-Fort Worth area had an increase in population from 4.0 million to 5.2 million between<br />
the 1990 and the 2000 census. What percent increase in population did the area have?<br />
Making the Connection<br />
5. Look up the results of the 2000 census for the state and county where you live. Write a summary of<br />
the changes that occurred between the 1990 and 2000 census. What are some things that may be<br />
affected by the change in census figures for your state and county?<br />
© Glencoe/McGraw-Hill 3 Glencoe Algebra 1
NAME _______________________________________________________ DATE _____________________________________<br />
REAL-WORLD APPLICATIONS<br />
STUDENT ACTIVITY for Transparency 3<br />
Use with Lesson 3-7.<br />
About Population Growth of U.S. Metropolitan Areas<br />
Census 2000 showed that the population in the United States increased by 13.2% from the<br />
1990 figures. This is the largest census-to-census increase in American history. Every state<br />
showed an increase in population, with Nevada showing the highest percent increase, 66.3%. In<br />
2000, metropolitan areas were home to about 80% of Americans, an increase of 14% from the<br />
last census.<br />
The graph shows both the population figures and the percent increase in population for the six<br />
largest metropolitan areas in the United States. Notice that some metropolitan areas extend<br />
across state lines while others fall within state boundaries.<br />
Directions: Use what you have seen and read to answer the following questions.<br />
1. In 1990, the population of the Los Angeles metropolitan area was almost 14.5 million people.<br />
What was the increase in population in the Los Angeles metropolitan area between 1990 and 2000?<br />
1.9 million people<br />
2. If the same rate of growth that occurred between 1990 and 2000 continues, what will be the<br />
population of the Washington-Baltimore area in 2010? 8,595,600 people<br />
3. How is it possible that the San Francisco and Philadelphia areas have about the same population, but<br />
have a different percent increase in population? The percent increase is the ratio of the<br />
increase in population to the original population figure. The ratios for San Francisco<br />
and Philadelphia may be different even though the new population figures are similar.<br />
4. The Dallas-Fort Worth area had an increase in population from 4.0 million to 5.2 million between<br />
the 1990 and the 2000 census. What percent increase in population did the area have?<br />
30% increase in population<br />
Making the Connection<br />
5. Look up the results of the 2000 census for the state and county where you live. Write a summary of<br />
the changes that occurred between the 1990 and 2000 census. What are some things that may be<br />
affected by the change in census figures for your state and county? See students’ work.<br />
© Glencoe/McGraw-Hill T3 Glencoe Algebra 1
NAME _______________________________________________________ DATE _____________________________________<br />
REAL-WORLD APPLICATIONS<br />
STUDENT ACTIVITY for Transparency 4<br />
Use with Lesson 4-6.<br />
About Interest on the U.S. Public Debt<br />
The government of the United States gets the money to pay its bills by collecting taxes. But<br />
when the country spends more money than it collects in taxes, the government must borrow the<br />
difference to pay its bills. Public debt is like an IOU. This debt scenario is often referred to as<br />
“being in the red” or “red ink.”<br />
As with other kinds of debt, the public debt of the United States accrues interest over the course<br />
of time. The government, and ultimately the taxpayer, is responsible for paying this interest. As<br />
the amount the government borrows increases, the amount of interest increases. Conversely,<br />
when the debt decreases, so does the amount of interest.<br />
The economy is an intricate system affected by many variables, all of them interconnected. Debt<br />
and interest are only two of these variables. The government regulates these and other factors to<br />
maintain a stable economy.<br />
Directions: Use what you have seen and read to answer the following questions.<br />
1. On a separate sheet of paper, graph the data using a line graph displaying x- and y-axes.<br />
2. Determine the domain, range, and inverse of the graphed relation.<br />
3. Is the graph of these data a linear relation? Why or why not?<br />
4. Is the graph of these data a function? Explain.<br />
Making the Connection<br />
5. If interest on the 2000 public debt of the United States were divided equally among the<br />
281,000,000 people in the United States, what portion would belong to you? Round your answer to<br />
the nearest 100 dollars.<br />
© Glencoe/McGraw-Hill 4 Glencoe Algebra 1
NAME _______________________________________________________ DATE _____________________________________<br />
REAL-WORLD APPLICATIONS<br />
STUDENT ACTIVITY for Transparency 4<br />
Use with Lesson 4-6.<br />
About Interest on the U.S. Public Debt<br />
The government of the United States gets the money to pay its bills by collecting taxes. But<br />
when the country spends more money than it collects in taxes, the government must borrow the<br />
difference to pay its bills. Public debt is like an IOU. This debt scenario is often referred to as<br />
“being in the red” or “red ink.”<br />
As with other kinds of debt, the public debt of the United States accrues interest over the course<br />
of time. The government, and ultimately the taxpayer, is responsible for paying this interest. As<br />
the amount the government borrows increases, the amount of interest increases. Conversely,<br />
when the debt decreases, so does the amount of interest.<br />
The economy is an intricate system affected by many variables, all of them interconnected. Debt<br />
and interest are only two of these variables. The government regulates these and other factors to<br />
maintain a stable economy.<br />
Directions: Use what you have seen and read to answer the following questions.<br />
1. On a separate sheet of paper, graph the data using a line graph displaying x- and y-axes.<br />
See students’ work.<br />
2. Determine the domain, range, and inverse of the graphed relation. The fiscal years comprise<br />
the domain; the interest payments comprise the range. The fiscal years comprise<br />
the range of the inverse; the interest payments comprise the domain of the inverse.<br />
3. Is the graph of these data a linear relation? Why or why not?<br />
on one line.<br />
No; the graphed data do not lie<br />
4. Is the graph of these data a function? Explain. Yes, for each element of the domain, there is<br />
exactly one corresponding element in the range.<br />
Making the Connection<br />
5. If interest on the 2000 public debt of the United States were divided equally among the<br />
281,000,000 people in the United States, what portion would belong to you? Round your answer to<br />
the nearest 100 dollars. $1300<br />
© Glencoe/McGraw-Hill T4 Glencoe Algebra 1
NAME _______________________________________________________ DATE _____________________________________<br />
REAL-WORLD APPLICATIONS<br />
STUDENT ACTIVITY for Transparency 5<br />
Use with Lesson 5-3.<br />
About Comparison Shopping and Phone Rates<br />
At one time, phone companies were monopolies. Only one phone company could be in any one<br />
geographic area, and that company controlled all telephone business within its area. A phone<br />
company could design its own services and determine its own fees. The government has since<br />
dissolved these monopolies. New phone companies have emerged, offering different services and<br />
different fees for these services. In addition, advanced technology has made cellular and digital<br />
phone service possible. Many phone companies provide these cellular, digital, and traditional<br />
phone services.<br />
As competition increased among the phone companies, phone rates became a major selling<br />
point. Instead of a set monthly fee for calls, some phone companies began charging a small fee,<br />
or toll, per local call. The options available to consumers are now quite varied, and telephone<br />
customers must consider which phone company, type of service, and billing rate are best for their<br />
needs.<br />
Directions: Use what you have seen and read to answer the following questions.<br />
1. Estimate the y-intercept of the line on the graph representing phone calls from a home.<br />
2. Compute the slope of the line representing phone calls from a home.<br />
3. If the horizontal segment on the graph of the cost of business calls were ignored, what would be the<br />
y-intercept of the line?<br />
4. If the horizontal segment of the graph of the cost of business calls were ignored, what would be the<br />
slope of the line?<br />
5. About how long does a business call have to be for the cost to be about the same as a call made from<br />
a home?<br />
Making the Connection<br />
6. How do these phone rates compare to local service in your community?<br />
7. When considering two competing phone services, what criteria would you use in selecting one<br />
company over another.<br />
© Glencoe/McGraw-Hill 5 Glencoe Algebra 1
NAME _______________________________________________________ DATE _____________________________________<br />
REAL-WORLD APPLICATIONS<br />
STUDENT ACTIVITY for Transparency 5<br />
Use with Lesson 5-3.<br />
About Comparison Shopping and Phone Rates<br />
At one time, phone companies were monopolies. Only one phone company could be in any one<br />
geographic area, and that company controlled all telephone business within its area. A phone<br />
company could design its own services and determine its own fees. The government has since<br />
dissolved these monopolies. New phone companies have emerged, offering different services and<br />
different fees for these services. In addition, advanced technology has made cellular and digital<br />
phone service possible. Many phone companies provide these cellular, digital, and traditional<br />
phone services.<br />
As competition increased among the phone companies, phone rates became a major selling<br />
point. Instead of a set monthly fee for calls, some phone companies began charging a small fee,<br />
or toll, per local call. The options available to consumers are now quite varied, and telephone<br />
customers must consider which phone company, type of service, and billing rate are best for their<br />
needs.<br />
Directions: Use what you have seen and read to answer the following questions.<br />
1. Estimate the y-intercept of the line on the graph representing phone calls from a home.<br />
2. Compute the slope of the line representing phone calls from a home.<br />
3. If the horizontal segment on the graph of the cost of business calls were ignored, what would be the<br />
y-intercept of the line? The y -intercept would be 2.5.<br />
4. If the horizontal segment of the graph of the cost of business calls were ignored, what would be the<br />
slope of the line? The slope would be 3<br />
2 .<br />
5. About how long does a business call have to be for the cost to be about the same as a call made from<br />
a home? The costs are the same for calls lasting about 1.75 minutes.<br />
Making the Connection<br />
6. How do these phone rates compare to local service in your community?<br />
7. When considering two competing phone services, what criteria would you use in selecting one<br />
company over another. Answers will vary.<br />
© Glencoe/McGraw-Hill T5 Glencoe Algebra 1<br />
0<br />
5.2<br />
Answers will vary.
NAME _______________________________________________________ DATE _____________________________________<br />
REAL-WORLD APPLICATIONS<br />
STUDENT ACTIVITY for Transparency 6<br />
Use with Lesson 6-4.<br />
About United States Postal Rates<br />
“Neither snow, nor rain, nor heat, nor gloom of night stays these couriers from the swift<br />
completion of their appointed rounds.” This phrase, inscribed on the New York City Post<br />
Office, is adapted from the writing of the Greek historian Herodotus. He was describing<br />
the messenger service used by the king of Persia in about 430 B.C.<br />
Today, to assure that mail service is secure and regular, the U.S. Postal Service has a monopoly<br />
on delivery of first-class mail. Private enterprises may compete for delivery of other classes of<br />
mail.<br />
Postal rates are recommended by a five-member postal rate commission appointed by the<br />
president of the United States. These rates must be approved by the 11-member board of<br />
governors that oversees the U.S. Postal Service.<br />
Directions: Use what you have seen and read to answer the following questions.<br />
1. How much will it cost to mail three letters, each weighing less than an ounce, and a fourth letter<br />
weighing 2 ounces?<br />
2. Write a compound inequality showing the possible weights for a Priority Mail package that costs<br />
$6.45 in postage.<br />
3. Suppose you want to mail a first-class letter weighing 3 ounces and a book weighing 3.5 pounds. You<br />
have $3. Do you have enough money? Explain.<br />
4. Suppose you want to mail a collection of your poems that weighs 2.75 ounces. Can you mail your<br />
collection to 52 of your friends and relatives if you have budgeted $40 for postage? Tell why or<br />
why not.<br />
Making the Connection<br />
5. How does the cost of mailing a first-class letter in the United States compare with the cost of mailing<br />
the same letter in other countries? Prepare a chart of facts comparing the postal service in the United<br />
States to the service in other countries.<br />
© Glencoe/McGraw-Hill 6 Glencoe Algebra 1
NAME _______________________________________________________ DATE _____________________________________<br />
REAL-WORLD APPLICATIONS<br />
STUDENT ACTIVITY for Transparency 6<br />
Use with Lesson 6-4.<br />
About United States Postal Rates<br />
“Neither snow, nor rain, nor heat, nor gloom of night stays these couriers from the swift<br />
completion of their appointed rounds.” This phrase, inscribed on the New York City Post<br />
Office, is adapted from the writing of the Greek historian Herodotus. He was describing<br />
the messenger service used by the king of Persia in about 430 B.C.<br />
Today, to assure that mail service is secure and regular, the U.S. Postal Service has a monopoly<br />
on delivery of first-class mail. Private enterprises may compete for delivery of other classes of<br />
mail.<br />
Postal rates are recommended by a five-member postal rate commission appointed by the<br />
president of the United States. These rates must be approved by the 11-member board of<br />
governors that oversees the U.S. Postal Service.<br />
Directions: Use what you have seen and read to answer the following questions.<br />
1. How much will it cost to mail three letters, each weighing less than an ounce, and a fourth letter<br />
weighing 2 ounces? $1.59<br />
2. Write a compound inequality showing the possible weights for a Priority Mail package that costs<br />
$6.45 in postage. 3 pounds x 4 pounds<br />
3. Suppose you want to mail a first-class letter weighing 3 ounces and a book weighing 3.5 pounds. You<br />
have $3. Do you have enough money? Explain. No; the cost will be ($0.34 (2 $0.23) <br />
$1.33 (3 $0.45)) or $3.48.<br />
4. Suppose you want to mail a collection of your poems that weighs 2.75 ounces. Can you mail your<br />
collection to 52 of your friends and relatives if you have budgeted $40 for postage? Tell why or<br />
why not. You can mail at most 50 collections of poems for $40 because each one<br />
will cost $0.80.<br />
Making the Connection<br />
5. How does the cost of mailing a first-class letter in the United States compare with the cost of mailing<br />
the same letter in other countries? Prepare a chart of facts comparing the postal service in the United<br />
States to the service in other countries. See students’ work.<br />
© Glencoe/McGraw-Hill T6 Glencoe Algebra 1
NAME _______________________________________________________ DATE _____________________________________<br />
REAL-WORLD APPLICATIONS<br />
STUDENT ACTIVITY for Transparency 7<br />
Use with Lesson 7-1.<br />
About Savings Bonds<br />
Often people <strong>real</strong>ize that they should save money, but do not have a plan in place to accomplish<br />
their savings goal. One way that the government can help with a personal savings plan is by<br />
offering savings bonds to its citizens. The newest type of savings bond offered to citizens is the<br />
Series I Bond.<br />
When a savings bond is purchased, the government has an obligation to redeem the bond for its<br />
face value plus the interest that accrues over time. This new bond is designed to be held for up<br />
to 30 years, although it can be redeemed at any time. The interest rate paid by the government<br />
on the Series I Bonds is a composite of a fixed rate and an adjustment for inflation.<br />
Because the bonds come in denominations ranging from $50 to $10,000, they suit many budgets.<br />
The bonds feature images of eight famous Americans, a different one for each denomination.<br />
The federal tax on the interest earned by bonds is not paid until the bonds are redeemed. As<br />
an added bonus, this interest could be tax-free if used for college tuition.<br />
Directions: Use what you have seen and read to answer the following questions.<br />
1. What information is shown in the table?<br />
2. The difference between the composite rate and the fixed rate for a bond is the adjustment for<br />
inflation. Which time period had the smallest amount added for inflation?<br />
3. Using the formula I PRT, estimate the interest earned on a $100 bond purchased in November,<br />
2000, and held for 20 years.<br />
4. Use the equation y 50 (0.0623)(x)50 to estimate the total value of a $50 bond bought in<br />
January 1999. Use the equation y 50 (0.0633)(x 1)50 to estimate the total value of a $50<br />
bond bought in January 2000. Will the value of the bond bought in 2000 be greater than the value<br />
of the bond bought in 1999 if both bonds are held until January 2004?<br />
Making the Connection<br />
5. Research the history of the United States savings bonds program. What has the government used the<br />
money for during different times in the 20th century?<br />
© Glencoe/McGraw-Hill 7 Glencoe Algebra 1
NAME _______________________________________________________ DATE _____________________________________<br />
REAL-WORLD APPLICATIONS<br />
STUDENT ACTIVITY for Transparency 7<br />
Use with Lesson 7-1.<br />
About Savings Bonds<br />
Often people <strong>real</strong>ize that they should save money, but do not have a plan in place to accomplish<br />
their savings goal. One way that the government can help with a personal savings plan is by<br />
offering savings bonds to its citizens. The newest type of savings bond offered to citizens is the<br />
Series I Bond.<br />
When a savings bond is purchased, the government has an obligation to redeem the bond for its<br />
face value plus the interest that accrues over time. This new bond is designed to be held for up<br />
to 30 years, although it can be redeemed at any time. The interest rate paid by the government<br />
on the Series I Bonds is a composite of a fixed rate and an adjustment for inflation.<br />
Because the bonds come in denominations ranging from $50 to $10,000, they suit many budgets.<br />
The bonds feature images of eight famous Americans, a different one for each denomination.<br />
The federal tax on the interest earned by bonds is not paid until the bonds are redeemed. As<br />
an added bonus, this interest could be tax-free if used for college tuition.<br />
Directions: Use what you have seen and read to answer the following questions.<br />
1. What information is shown in the table? The table contains information about the fixed<br />
rate and the composite rate for the bonds sold in six different interest periods.<br />
2. The difference between the composite rate and the fixed rate for a bond is the adjustment for<br />
inflation. Which time period had the smallest amount added for inflation? The smallest<br />
adjustment was for May 2001 – October 2001, 2.92%.<br />
3. Using the formula I PRT, estimate the interest earned on a $100 bond purchased in November,<br />
2000, and held for 20 years. The interest earned would be about $127.<br />
4. Use the equation y 50 (0.0623)(x)50 to estimate the total value of a $50 bond bought in<br />
January 1999. Use the equation y 50 (0.0633)(x 1)50 to estimate the total value of a $50<br />
bond bought in January 2000. Will the value of the bond bought in 2000 be greater than the value<br />
of the bond bought in 1999 if both bonds are held until January 2004? No<br />
Making the Connection<br />
5. Research the history of the United States savings bonds program. What has the government used the<br />
money for during different times in the 20th century? See students’ work.<br />
© Glencoe/McGraw-Hill T7 Glencoe Algebra 1
NAME _______________________________________________________ DATE _____________________________________<br />
REAL-WORLD APPLICATIONS<br />
STUDENT ACTIVITY for Transparency 8<br />
Use with Lesson 8-3.<br />
About Those Massive Planets<br />
Our Sun and the nine planets in our solar system may have been formed about 5 billion years<br />
ago. The first four planets from the Sun—Mercury, Venus, Earth, and Mars—are called the<br />
terrestrial planets. These planets all have magnetic fields, solid surfaces, and are comparatively<br />
dense. The five outer planets—Jupiter, Saturn, Uranus, Neptune, and Pluto—are spheres of<br />
hydrogen and other gases. Four of these planets—Jupiter, Saturn, Uranus, and Neptune—called<br />
the gas giants, are much larger than the terrestrial planets. Pluto, the most distant planet, is a<br />
ball of frozen gases. Pluto is also the smallest planet; it is about the size of our Moon.<br />
People began studying the planets thousands of years ago. Until Galileo built his own telescope<br />
in 1609, characteristics such as the rings of Saturn or Jupiter’s moons were unknown. Improved<br />
technology has made study of the planets much easier. However, many questions about planets<br />
and their environments remain unanswered.<br />
Directions: Use what you have seen and read to answer the following questions.<br />
1. What is the relationship between the mass of Mars and the mass of Earth?<br />
2. Select two planets whose masses are written using the same exponent. Compute the difference in the<br />
masses of the two planets.<br />
3. Which planet has the greatest mass? What is the mass of that planet relative to that of Earth?<br />
4. The mass of the Sun is 1,828,800,000,000,000,000,000,000,000,000 kilograms. How many times<br />
greater than the mass of Earth is the mass of the Sun?<br />
Making the Connection<br />
5. Compare the mass of Jupiter to the total of the masses of the other planets.<br />
6. What does its density tell about a planet? What types of units are used to express density? Use a<br />
reference to find the densities of the planets. How do the densities of the terrestrial planets compare<br />
to the densities of the gas giants?<br />
© Glencoe/McGraw-Hill 8 Glencoe Algebra 1
NAME _______________________________________________________ DATE _____________________________________<br />
REAL-WORLD APPLICATIONS<br />
STUDENT ACTIVITY for Transparency 8<br />
Use with Lesson 8-3.<br />
About Those Massive Planets<br />
Our Sun and the nine planets in our solar system may have been formed about 5 billion years<br />
ago. The first four planets from the Sun—Mercury, Venus, Earth, and Mars—are called the<br />
terrestrial planets. These planets all have magnetic fields, solid surfaces, and are comparatively<br />
dense. The five outer planets—Jupiter, Saturn, Uranus, Neptune, and Pluto—are spheres of<br />
hydrogen and other gases. Four of these planets—Jupiter, Saturn, Uranus, and Neptune—called<br />
the gas giants, are much larger than the terrestrial planets. Pluto, the most distant planet, is a<br />
ball of frozen gases. Pluto is also the smallest planet; it is about the size of our Moon.<br />
People began studying the planets thousands of years ago. Until Galileo built his own telescope<br />
in 1609, characteristics such as the rings of Saturn or Jupiter’s moons were unknown. Improved<br />
technology has made study of the planets much easier. However, many questions about planets<br />
and their environments remain unanswered.<br />
Directions: Use what you have seen and read to answer the following questions.<br />
1. What is the relationship between the mass of Mars and the mass of Earth?<br />
about 0.1 of the mass of Earth.<br />
The mass of Mars is<br />
2. Select two planets whose masses are written using the same exponent. Compute the difference in the<br />
masses of the two planets. Sample answer: The difference between the masses of Earth<br />
and Venus is 1.11 1024 kilograms.<br />
3. Which planet has the greatest mass? What is the mass of that planet relative to that of Earth?<br />
Jupiter; the mass of Jupiter is about 300 times the mass of Earth.<br />
4. The mass of the Sun is 1,828,800,000,000,000,000,000,000,000,000 kilograms. How many times<br />
greater than the mass of Earth is the mass of the Sun? The mass of the Sun is about 3 106 times greater than the mass of the Earth.<br />
Making the Connection<br />
5. Compare the mass of Jupiter to the total of the masses of the other planets.<br />
about 2.5 times the sum of the masses of the other planets.<br />
Jupiter’s mass is<br />
6. What does its density tell about a planet? What types of units are used to express density? Use a<br />
reference to find the densities of the planets. How do the densities of the terrestrial planets compare<br />
to the densities of the gas giants? A planet’s density is its mass per unit volume.<br />
Densities in ounces per cubic inch are: Mercury, 3.13; Venus, 3.03; Earth 3.19;<br />
Mars, 2.27; Jupiter, 0.759; Saturn, 0.40; Uranus, 0.7; Neptune, 1.0; Pluto, 0.2.<br />
Terrestrial planets have greater densities.<br />
© Glencoe/McGraw-Hill T8 Glencoe Algebra 1
NAME _______________________________________________________ DATE _____________________________________<br />
REAL-WORLD APPLICATIONS<br />
STUDENT ACTIVITY for Transparency 9<br />
Use with Lesson 9-6.<br />
About Frames and Art<br />
The best way to preserve a work of art is to frame it properly. As the artist Edgar Degas said,<br />
“The frame is the reward for the artist.” The style of the frame for a picture or portrait not only<br />
preserves the work of art, but also accentuates its beauty and value. The large portraits done in<br />
oil during the 18th and 19th centuries typically had ornate, gilded frames. The same style of<br />
frame was also used during the Impressionist period in the late 1800s.<br />
Oil and acrylic paintings are simply framed without any glass or matting so that the canvas they<br />
are painted on can breath. Other artwork including drawings, sketches, and photographs are<br />
often framed with mats and glass. The size of the frame is the dimensions of the frame on the art<br />
and matting, not the length or width of the frame itself. Frames and mats are produced in a variety<br />
of sizes, styles, and colors and are combined to enhance the beauty of the piece of art they<br />
“frame.”<br />
Directions: Use what you have seen and read to answer the following questions.<br />
1. If you have selected a frame from the list so that you may display a photograph with an area of 320<br />
square inches, what are the dimensions of the frame?<br />
2. If a mat with dimensions 9 by 12 is used with a picture that is 6 by 9, what is the total area taken<br />
up by the mat? Explain your answer.<br />
3. Degas’ The Dance Class measures 65 by 81 centimeters. If you frame it with a mat of width m<br />
centimeters all around it, write an expression for the total area of the framed space.<br />
4. A common framing practice is to make a mat with 2 inches between the artwork and the frame on<br />
each side. If the total area of a square frame is 225 square inches, what is the display area of the<br />
artwork?<br />
Making the Connection<br />
5. Conduct research to find the sizes of various works by a famous artist. Find the perimeter and area of<br />
the works you researched.<br />
© Glencoe/McGraw-Hill 9 Glencoe Algebra 1
NAME _______________________________________________________ DATE _____________________________________<br />
REAL-WORLD APPLICATIONS<br />
STUDENT ACTIVITY for Transparency 9<br />
Use with Lesson 9-6.<br />
About Frames and Art<br />
The best way to preserve a work of art is to frame it properly. As the artist Edgar Degas said,<br />
“The frame is the reward for the artist.” The style of the frame for a picture or portrait not only<br />
preserves the work of art, but also accentuates its beauty and value. The large portraits done in<br />
oil during the 18th and 19th centuries typically had ornate, gilded frames. The same style of<br />
frame was also used during the Impressionist period in the late 1800s.<br />
Oil and acrylic paintings are simply framed without any glass or matting so that the canvas they<br />
are painted on can breath. Other artwork including drawings, sketches, and photographs are<br />
often framed with mats and glass. The size of the frame is the dimensions of the frame on the art<br />
and matting, not the length or width of the frame itself. Frames and mats are produced in a variety<br />
of sizes, styles, and colors and are combined to enhance the beauty of the piece of art they<br />
“frame.”<br />
Directions: Use what you have seen and read to answer the following questions.<br />
1. If you have selected a frame from the list so that you may display a photograph with an area of 320<br />
square inches, what are the dimensions of the frame? 16 inches by 20 inches<br />
2. If a mat with dimensions 9 by 12 is used with a picture that is 6 by 9, what is the total area taken<br />
up by the mat? Explain your answer. Subtract the area of the picture from the total area;<br />
108 in2 54 in2 54 in2 .<br />
3. Degas’ The Dance Class measures 65 by 81 centimeters. If you frame it with a mat of width m<br />
centimeters all around it, write an expression for the total area of the framed space.<br />
(65 2m)(81 2m) or 5265 292m 4m 2 cm2 4. A common framing practice is to make a mat with 2 inches between the artwork and the frame on<br />
each side. If the total area of a square frame is 225 square inches, what is the display area of the<br />
artwork? The display area is 121 square inches.<br />
Making the Connection<br />
5. Conduct research to find the sizes of various works by a famous artist. Find the perimeter and area of<br />
the works you researched. See students’ work.<br />
© Glencoe/McGraw-Hill T9 Glencoe Algebra 1
NAME _______________________________________________________ DATE _____________________________________<br />
REAL-WORLD APPLICATIONS<br />
STUDENT ACTIVITY for Transparency 10<br />
Use with Lesson 10-6.<br />
About Per Capita Personal Income<br />
Many statistics are generated about the income of workers in the United States. One important<br />
statistic is the per capita personal income. Per capita is an expression that means “for each<br />
individual.”<br />
The per capita personal income of workers is spent in a variety of ways. The income that remains<br />
after taxes is known as disposable income, money that may be spent or saved. In 2000, workers<br />
spent 12% of their disposable income on durable goods, 29% on non-durable goods, and 56%<br />
on services.<br />
Durable goods are manufactured items that are expected to last a long time such as automobiles<br />
and kitchen appliances. Nondurable goods are short lived and include items such as paper<br />
products, groceries, and petroleum products. Services include such things as haircuts, dry<br />
cleaning, and medical care.<br />
Directions: Use what you have seen and read to answer the following questions.<br />
1. In dollars, the per capita income of which state increased the most? The least?<br />
2. In percent, what was the increase in per capita income in your home state? What was the national<br />
percent increase?<br />
3. Estimate the per capita income of your state for the year 2010. Explain how your estimate was<br />
generated.<br />
4. For a 10-year period, would you expect an increase or a decrease in per capita income? Explain your<br />
answer.<br />
Making the Connection<br />
5. Research what percent of the disposable per capita personal income earned by U.S. workers is saved.<br />
Speculate on the amount of money you may need to save for certain events in your future. Write a<br />
short paper explaining why it is important to put aside a set amount of earnings in a savings plan.<br />
© Glencoe/McGraw-Hill 10 Glencoe Algebra 1
NAME _______________________________________________________ DATE _____________________________________<br />
REAL-WORLD APPLICATIONS<br />
STUDENT ACTIVITY for Transparency 10<br />
Use with Lesson 10-6.<br />
About Per Capita Personal Income<br />
Many statistics are generated about the income of workers in the United States. One important<br />
statistic is the per capita personal income. Per capita is an expression that means “for each<br />
individual.”<br />
The per capita personal income of workers is spent in a variety of ways. The income that remains<br />
after taxes is known as disposable income, money that may be spent or saved. In 2000, workers<br />
spent 12% of their disposable income on durable goods, 29% on non-durable goods, and 56%<br />
on services.<br />
Durable goods are manufactured items that are expected to last a long time such as automobiles<br />
and kitchen appliances. Nondurable goods are short lived and include items such as paper<br />
products, groceries, and petroleum products. Services include such things as haircuts, dry<br />
cleaning, and medical care.<br />
Directions: Use what you have seen and read to answer the following questions.<br />
1. In dollars, the per capita income of which state increased the most? The least?<br />
Massachusetts; Hawaii<br />
2. In percent, what was the increase in per capita income in your home state? What was the national<br />
percent increase? See students’ work; 51.4%<br />
3. Estimate the per capita income of your state for the year 2010. Explain how your estimate was<br />
generated. See students’ work.<br />
4. For a 10-year period, would you expect an increase or a decrease in per capita income? Explain your<br />
answer. See students’ work.<br />
Making the Connection<br />
5. Research what percent of the disposable per capita personal income earned by U.S. workers is saved.<br />
Speculate on the amount of money you may need to save for certain events in your future. Write a<br />
short paper explaining why it is important to put aside a set amount of earnings in a savings plan.<br />
See students’ work.<br />
© Glencoe/McGraw-Hill T10 Glencoe Algebra 1
NAME _______________________________________________________ DATE _____________________________________<br />
REAL-WORLD APPLICATIONS<br />
STUDENT ACTIVITY for Transparency 11<br />
Use with Lesson 11-4.<br />
About American Softball<br />
Although the rules of the game vary slightly from one country to another, softball is played in<br />
many different countries throughout the <strong>world</strong>. The game of softball was invented in the United<br />
States and first played during the late 1800s. At that time, the game was played indoors. Today,<br />
softball is played outdoors on a field typically measuring 60 feet between bases and a maximum<br />
of 300 feet from home plate to all portions of the outfield fence.<br />
Formulas that can be applied to a diagram of a softball field include the Pythagorean Theorem:<br />
a 2 b 2 c 2 ; the area of a square: A s 2 ; the area of a circle: A r 2 ; and the circumference<br />
of a circle: C d.<br />
Directions: Use what you have seen and read to answer the following questions.<br />
1. Determine the distance from home plate to second base.<br />
2. Would the distance from first base to third base be the same as the distance from home plate to<br />
second base? Why or why not?<br />
3. What is the area bounded by the playing field shown in the diagram?<br />
4. Find the length of the outfield fence that stretches from the left field foul pole to the right field foul<br />
pole.<br />
5. Determine the straight line distance from the left field foul pole to the right field foul pole.<br />
Making the Connection<br />
6. How can the application of mathematical formulas to a sport, such as softball, benefit a coach, player,<br />
or fan of that sport?<br />
© Glencoe/McGraw-Hill 11 Glencoe Algebra 1
NAME _______________________________________________________ DATE _____________________________________<br />
REAL-WORLD APPLICATIONS<br />
STUDENT ACTIVITY for Transparency 11<br />
Use with Lesson 11-4.<br />
About American Softball<br />
Although the rules of the game vary slightly from one country to another, softball is played in<br />
many different countries throughout the <strong>world</strong>. The game of softball was invented in the United<br />
States and first played during the late 1800s. At that time, the game was played indoors. Today,<br />
softball is played outdoors on a field typically measuring 60 feet between bases and a maximum<br />
of 300 feet from home plate to all portions of the outfield fence.<br />
Formulas that can be applied to a diagram of a softball field include the Pythagorean Theorem:<br />
a 2 b 2 c 2 ; the area of a square: A s 2 ; the area of a circle: A r 2 ; and the circumference<br />
of a circle: C d.<br />
Directions: Use what you have seen and read to answer the following questions.<br />
1. Determine the distance from home plate to second base. 84.85 ft<br />
2. Would the distance from first base to third base be the same as the distance from home plate to<br />
second base? Why or why not? Yes, because the diagonals of a square have the same<br />
measure.<br />
3. What is the area bounded by the playing field shown in the diagram?<br />
70,685.83 ft 2<br />
4. Find the length of the outfield fence that stretches from the left field foul pole to the right field foul<br />
pole. 471.24 ft<br />
5. Determine the straight line distance from the left field foul pole to the right field foul pole.<br />
427.26 ft<br />
Making the Connection<br />
6. How can the application of mathematical formulas to a sport, such as softball, benefit a coach, player,<br />
or fan of that sport? Sample answer: The application of formulas could help people<br />
better understand and appreciate the intricacies of the sport.<br />
© Glencoe/McGraw-Hill T11 Glencoe Algebra 1
NAME _______________________________________________________ DATE _____________________________________<br />
REAL-WORLD APPLICATIONS<br />
STUDENT ACTIVITY for Transparency 12<br />
Use with Lesson 12-2.<br />
About Consumer Price Index<br />
The Consumer Price Index, or CPI, is a historical, comparative measure that describes how the<br />
overall cost of goods and services changes over time. The goods and services itemized in the CPI<br />
are those that are considered necessary for everyday life. Examples of these goods and services<br />
include food, clothing, housing, transportation, and medical fees.<br />
The CPI uses a certain period of time from the past as a reference point. Presently, the period<br />
1982–1984 is used. Goods and services available at that time, regardless of their cost, are given<br />
the value 100. The cost of goods and services in July 2000 and July 2001 are compared to their<br />
cost in 1982–1984. If those goods and services cost, for example, twice as much in July 2001 as<br />
they did in 1982–1984, they would be listed as 200 (2 100) in July 2001.<br />
Directions: Use what you have seen and read to answer the following questions.<br />
1. Which groups of goods and services showed the least price changes from July 2000 to July 2001?<br />
The greatest? By what percent did their prices change?<br />
2. Which groups, if any, cost less in July 2001 than they did in 1982–1984?<br />
3. Which groups, if any, cost less in July 2001 than they did in July 2000?<br />
4. The CPI for gasoline in July 2001 was 124.9. The cost of gasoline at that time was approximately<br />
$1.50 per gallon. What was the approximate cost of a gallon of gasoline in 1982–1984?<br />
Making the Connection<br />
5. Select a college or university and determine the cost of attending that school this year. Then use the<br />
CPI percent increase for 2001 to calculate the tuition for the next four years.<br />
© Glencoe/McGraw-Hill 12 Glencoe Algebra 1
NAME _______________________________________________________ DATE _____________________________________<br />
REAL-WORLD APPLICATIONS<br />
STUDENT ACTIVITY for Transparency 12<br />
Use with Lesson 12-2.<br />
About Consumer Price Index<br />
The Consumer Price Index, or CPI, is a historical, comparative measure that describes how the<br />
overall cost of goods and services changes over time. The goods and services itemized in the CPI<br />
are those that are considered necessary for everyday life. Examples of these goods and services<br />
include food, clothing, housing, transportation, and medical fees.<br />
The CPI uses a certain period of time from the past as a reference point. Presently, the period<br />
1982–1984 is used. Goods and services available at that time, regardless of their cost, are given<br />
the value 100. The cost of goods and services in July 2000 and July 2001 are compared to their<br />
cost in 1982–1984. If those goods and services cost, for example, twice as much in July 2001 as<br />
they did in 1982–1984, they would be listed as 200 (2 100) in July 2001.<br />
Directions: Use what you have seen and read to answer the following questions.<br />
1. Which groups of goods and services showed the least price changes from July 2000 to July 2001?<br />
The greatest? By what percent did their prices change? The least change was in the CPI for<br />
transportation, 0.4%; the greatest change was in the CPI for medical care, 4.5%.<br />
2. Which groups, if any, cost less in July 2001 than they did in 1982–1984? The cost for all items<br />
on the chart is greater than the cost in 1982–1984.<br />
3. Which groups, if any, cost less in July 2001 than they did in July 2000? The cost for apparel<br />
was less in July 2001 than in July 2000.<br />
4. The CPI for gasoline in July 2001 was 124.9. The cost of gasoline at that time was approximately<br />
$1.50 per gallon. What was the approximate cost of a gallon of gasoline in 1982–1984? $1.20 per<br />
gallon<br />
Making the Connection<br />
5. Select a college or university and determine the cost of attending that school this year. Then use the<br />
CPI percent increase for 2001 to calculate the tuition for the next four years. See students’ work.<br />
© Glencoe/McGraw-Hill T12 Glencoe Algebra 1
NAME _______________________________________________________ DATE _____________________________________<br />
REAL-WORLD APPLICATIONS<br />
STUDENT ACTIVITY for Transparency 13<br />
Use with Lesson 13-4.<br />
About Gestation and Longevity of Animals<br />
Earth is occupied by a great variety of animal life. Animals range in size from microscopic<br />
organisms that live inside your body to giant whales of the sea that measure many meters in<br />
length and circumference. Time of gestation, the period in which the fetus develops from<br />
conception to birth, varies considerably for different types of animals. Longevity, or life span,<br />
ranges from several hours for some microscopic organisms, to nearly 100 years for some animals.<br />
Animals and the other living things of Earth are classified by zoologists into five kingdoms:<br />
Monera, Protista, Fungi, Plantae, and Animalia. The organisms shown on Transparency 13 are<br />
members of the kingdom Animalia.<br />
Directions: Use what you have seen and read to answer the following questions.<br />
1. Determine the median, range, upper quartile, lower quartile, and interquartile range for each set<br />
of data.<br />
2. Can you identify any outliers within the gestation data? Within the longevity data?<br />
Making the Connection<br />
3. Research to determine if any of these animals are currently classified as endangered species.<br />
© Glencoe/McGraw-Hill 13 Glencoe Algebra 1
NAME _______________________________________________________ DATE _____________________________________<br />
REAL-WORLD APPLICATIONS<br />
STUDENT ACTIVITY for Transparency 13<br />
Use with Lesson 13-4.<br />
About Gestation and Longevity of Animals<br />
Earth is occupied by a great variety of animal life. Animals range in size from microscopic<br />
organisms that live inside your body to giant whales of the sea that measure many meters in<br />
length and circumference. Time of gestation, the period in which the fetus develops from<br />
conception to birth, varies considerably for different types of animals. Longevity, or life span,<br />
ranges from several hours for some microscopic organisms, to nearly 100 years for some animals.<br />
Animals and the other living things of Earth are classified by zoologists into five kingdoms:<br />
Monera, Protista, Fungi, Plantae, and Animalia. The organisms shown on Transparency 13 are<br />
members of the kingdom Animalia.<br />
Directions: Use what you have seen and read to answer the following questions.<br />
1. Determine the median, range, upper quartile, lower quartile, and interquartile range for each set<br />
of data. Gestation: median 164, range 624, upper quartile 284,<br />
lower quartile 63, interquartile range 221; Longevity: median 12,<br />
range 37, upper quartile 15, lower quartile 8, interquartile range 7<br />
2. Can you identify any outliers within the gestation data? Within the longevity data? The gestation<br />
time and the average longevity for the elephant are outliers because both are more<br />
than 1.5 times greater than the upper quartile for the data set.<br />
Making the Connection<br />
3. Research to determine if any of these animals are currently classified as endangered species.<br />
As of January 2002, the animals classified as endangered are grizzly bear, beaver,<br />
wood bison, Bactrian camel, chimpanzee, Columbian white-tailed deer, Asian<br />
elephant, gorilla, Asiatic lion, black rhinoceros, tiger, and maned wolf.<br />
© Glencoe/McGraw-Hill T13 Glencoe Algebra 1
NAME _______________________________________________________ DATE _____________________________________<br />
REAL-WORLD APPLICATIONS<br />
STUDENT ACTIVITY for Transparency 14<br />
Use with Lesson 14-5.<br />
About Games and Probability<br />
As you stand at a game booth at the fair, you may think about your chances of winning a prize<br />
by popping a balloon or tossing a coin onto a plate. Just how do you calculate your chances of<br />
winning? It may surprise you to discover that mathematicians have tackled questions just like<br />
that for nearly 350 years. The first formal writings on the topic of probability were exchanged<br />
between Fermat and Pascal in the middle of the 17th century.<br />
But it was another mathematician, Huygen, who coined the term “probability” in 1656 by<br />
observing that there are “six throws upon one die, which all have an equal probability of coming<br />
up.” In the decades that followed, probability was applied to such varied topics as calculating the<br />
chances that a jury would reach a correct verdict, approximating the value of pi, and fostering<br />
the insurance industry.<br />
Directions: Use what you have seen and read to answer the following questions.<br />
1. Overall, the chance of a contestant hitting the target at a dunking booth is 1 in 15. If each contestant<br />
takes 2 minutes to throw some balls, what is the average number of times the person in the booth<br />
should expect to be dunked every hour?<br />
2. The owner of the Ring Toss booth figures that 1 in every 20 patrons wins a prize. If the average<br />
prize costs $4, what is the expected net profit on every 20 patrons, paying 50¢ each?<br />
3. At the Duck Pond, a children’s booth, the child selects a duck and wins a prize. For 94 of 100 ducks<br />
in the pond, the child will win a trinket, but the child wins a stuffed animal for the other ducks. If<br />
350 children select a duck at the booth, about how many stuffed animals should the owner expect to<br />
give away?<br />
4. How many different combinations of three games of chance can be selected from the list of games?<br />
Making the Connection<br />
5. In 1777, Buffon (Georges-Louis Leclerc) conducted his famous experiment in probability to estimate<br />
the value of pi. Read how the experiment was conducted and then repeat the experiment yourself<br />
and report the results to the class.<br />
© Glencoe/McGraw-Hill 14 Glencoe Algebra 1
NAME _______________________________________________________ DATE _____________________________________<br />
REAL-WORLD APPLICATIONS<br />
STUDENT ACTIVITY for Transparency 14<br />
Use with Lesson 14-5.<br />
About Games and Probability<br />
As you stand at a game booth at the fair, you may think about your chances of winning a prize<br />
by popping a balloon or tossing a coin onto a plate. Just how do you calculate your chances of<br />
winning? It may surprise you to discover that mathematicians have tackled questions just like<br />
that for nearly 350 years. The first formal writings on the topic of probability were exchanged<br />
between Fermat and Pascal in the middle of the 17th century.<br />
But it was another mathematician, Huygen, who coined the term “probability” in 1656 by<br />
observing that there are “six throws upon one die, which all have an equal probability of coming<br />
up.” In the decades that followed, probability was applied to such varied topics as calculating the<br />
chances that a jury would reach a correct verdict, approximating the value of pi, and fostering<br />
the insurance industry.<br />
Directions: Use what you have seen and read to answer the following questions.<br />
1. Overall, the chance of a contestant hitting the target at a dunking booth is 1 in 15. If each contestant<br />
takes 2 minutes to throw some balls, what is the average number of times the person in the booth<br />
should expect to be dunked every hour? 2 times<br />
2. The owner of the Ring Toss booth figures that 1 in every 20 patrons wins a prize. If the average<br />
prize costs $4, what is the expected net profit on every 20 patrons, paying 50¢ each? $6<br />
3. At the Duck Pond, a children’s booth, the child selects a duck and wins a prize. For 94 of 100 ducks<br />
in the pond, the child will win a trinket, but the child wins a stuffed animal for the other ducks. If<br />
350 children select a duck at the booth, about how many stuffed animals should the owner expect to<br />
give away? 21 animals<br />
4. How many different combinations of three games of chance can be selected from the list of games?<br />
35 combinations<br />
Making the Connection<br />
5. In 1777, Buffon (Georges-Louis Leclerc) conducted his famous experiment in probability to estimate<br />
the value of pi. Read how the experiment was conducted and then repeat the experiment yourself<br />
and report the results to the class. See students’ work.<br />
© Glencoe/McGraw-Hill T14 Glencoe Algebra 1
MAJOR CONSUMERS OF PRIMARY ENERGY, 1999<br />
United States<br />
China<br />
Russia<br />
Japan<br />
Germany<br />
Canada<br />
India<br />
France<br />
United Kingdom<br />
Brazil<br />
Source: Energy Information Administration<br />
MAJOR PRODUCERS OF PRIMARY ENERGY, 1999<br />
United States<br />
Russia<br />
China<br />
Saudi Arabia<br />
Canada<br />
United Kingdom<br />
Iran<br />
India<br />
Mexico<br />
Australia<br />
0<br />
0<br />
13.98<br />
12.52<br />
12.18<br />
10.26<br />
9.92<br />
8.51<br />
12.01<br />
9.84<br />
9.17<br />
9.03<br />
8.78<br />
19.64<br />
17.71<br />
26.01<br />
21.71<br />
31.88<br />
10 20 30 40 50 60 70 80<br />
Quadrillion Btu<br />
30.87<br />
41.54<br />
72.28<br />
10 20 30 40 50 60 70 80<br />
Quadrillion Btu<br />
97.05<br />
90 100<br />
90 100<br />
Transparency 1<br />
World’s Major Producers and Consumers of Primary Energy<br />
© Glencoe/McGraw-Hill Glencoe Algebra 1
Source: AP Moneywire<br />
Stock Trade<br />
TOP STOCKS BY NUMBER OF<br />
SHARES TRADED<br />
Most Active Stock Shares<br />
Top Stocks by Number of Shares<br />
Traded on September 4, 2001<br />
NEW YORK STOCK EXCHANGE<br />
Vol Last Chg<br />
Compaq Computer .............. 68,105,900 11.08 1.27<br />
Hewlett Packard Co. ........... 36,556,700 19.00 4.21<br />
Lucent Technologies Inc. ...... 21,112,600 6.52 0.30<br />
General Electric Co. ............ 18,444,000 40.83 0.15<br />
Johnson & Johnson ............. 18,216,900 56.15 3.44<br />
Providian Financial Corp. ..... 15,735,500 30.36 8.70<br />
AOL Time Warner Inc. .......... 15,250,800 37.50 0.15<br />
Nokia Corp. ...................... 14,320,600 15.00 0.74<br />
EMC Corp. ....................... 14,170,200 14.95 0.51<br />
Nortel Networks Corp. .......... 14,137,900 6.00 0.26<br />
Transparency 2<br />
© Glencoe/McGraw-Hill Glencoe Algebra 1
Transparency 3<br />
Population Growth of U.S. Metropolitan Areas<br />
U.S. METROPOLITAN AREAS WITH POPULATION OF<br />
6 MILLION OR MORE<br />
Metropolitan<br />
Area<br />
New York-Northern NJ-<br />
Long Island<br />
Los Angeles-Riverside-<br />
Orange County<br />
Chicago-Gary-<br />
Kenosha<br />
Washington-Baltimore<br />
San Francisco-<br />
Oakland-San Jose<br />
Philadelphia-Wilmington-<br />
Atlantic City<br />
2000<br />
Population<br />
(Millions)<br />
21.2<br />
16.4<br />
9.2<br />
7.6<br />
7.0<br />
6.2<br />
Source: U.S. Census Bureau, Population Change and Distribution, Census 2000 Brief<br />
Percent<br />
Change<br />
(1990 to 2000)<br />
© Glencoe/McGraw-Hill Glencoe Algebra 1<br />
8.4<br />
12.7<br />
11.1<br />
13.1<br />
12.6<br />
5.0
Transparency 4<br />
Interest on the U.S. Public Debt<br />
INTEREST<br />
ON THE U.S.<br />
PUBLIC DEBT<br />
(in billions)<br />
100 100<br />
Fiscal Year Interest Paid<br />
2000 $362.0<br />
1999 $353.5<br />
1998 $363.8<br />
1997 $355.8<br />
1996 $344.0<br />
1995 $332.4<br />
1994 $296.3<br />
1993 $292.5<br />
1992 $292.4<br />
1991 $286.0<br />
1990 $264.9<br />
1989 $240.9<br />
1988 $214.1<br />
Source: Bureau of Public Debt, U.S. Department of the Treasury<br />
http://www.publicdebt.treas.gov/opd.opdint.htm<br />
100 100<br />
© Glencoe/McGraw-Hill Glencoe Algebra 1<br />
100<br />
100
Cost<br />
(in cents)<br />
9<br />
8<br />
7<br />
6<br />
5<br />
4<br />
3<br />
2<br />
1<br />
0<br />
Source: Ameritech, 2001<br />
Transparency 5<br />
Comparison Shopping and Phone Rates<br />
COST OF LOCAL CALLS (less than 8 miles)<br />
Business<br />
Home<br />
1 2 3 4<br />
Minutes<br />
5 6 7<br />
© Glencoe/McGraw-Hill Glencoe Algebra 1
MEDIA MAIL<br />
1 lb or less<br />
Each additional lb or<br />
fraction of a lb through 7 lb<br />
Each additional lb or<br />
fraction of a lb through 70 lb<br />
Source: U.S. Postal Service<br />
United States Postal Rates<br />
FIRST CLASS MAIL<br />
(2001)<br />
Transparency 6<br />
1 oz or less $0.34<br />
Each additional oz or fraction<br />
of an oz through 13 oz<br />
$0.23<br />
Book<br />
Rate<br />
(2001)<br />
$1.33<br />
$0.45<br />
$0.30<br />
PRIORITY MAIL<br />
(2001)<br />
Up to 1 pound<br />
Up to 2 pounds<br />
Up to 3 pounds<br />
Up to 4 pounds<br />
Up to 5 pounds<br />
$3.50<br />
$3.95<br />
$5.20<br />
$6.45<br />
$7.70<br />
© Glencoe/McGraw-Hill Glencoe Algebra 1
Source: Bureau of the Public Debt<br />
Savings Bonds<br />
I Bond Rates<br />
Composite Rates for Dates of Issue<br />
September 1998 through October 2001<br />
Transparency 7<br />
Issue Date Fixed Rate Composite Rate<br />
Nov. 1998–Apr. 1999 3.30% 6.23%<br />
May 1999–Oct. 1999 3.30% 6.23%<br />
Nov. 1999–Apr. 2000 3.40% 6.33%<br />
May 2000–Oct. 2000 3.60% 6.53%<br />
Nov. 2000–Apr. 2001 3.40% 6.33%<br />
May 2001–Oct. 2001 3.00% 5.92%<br />
© Glencoe/McGraw-Hill Glencoe Algebra 1
Planet<br />
Mercury<br />
Venus<br />
Earth<br />
Mars<br />
Jupiter<br />
Source: NASA<br />
Those Massive Planets<br />
Mass<br />
(in kilograms)<br />
3.303 × 10²³ 4.87 × 1024 5.98 × 1024 6.42 × 10²³ 1.899 × 1027 Saturn 5.686 × 10 26<br />
Uranus 8.66 × 10 25<br />
Neptune 1.030 × 10 26<br />
Pluto 1.27 × 10 22<br />
Transparency 8<br />
© Glencoe/McGraw-Hill Glencoe Algebra 1
Frame Sizes<br />
5 7<br />
8 10<br />
9 12<br />
10 14<br />
11 14<br />
12 16<br />
14 18<br />
16 20<br />
18 24<br />
Mat Sizes<br />
8 10<br />
9 12<br />
11 14<br />
12 16<br />
16 20<br />
16 22<br />
Frames and Art<br />
Transparency 9<br />
© Glencoe/McGraw-Hill Glencoe Algebra 1
AL $23,471 15,832 MT 22,569 15,524<br />
AK 30,064 22,719 NB 27,829 18,088<br />
AZ 25,578 17,211 NV 30,529 20,674<br />
AR 22,257 14,509 NH 33,332 20,713<br />
CA 32,275 21,889 NJ 36,983 24,766<br />
CO 32,949 19,703 NM 22,203 14,960<br />
CT 40,640 26,736 NY 34,547 23,315<br />
DE 31,255 21,636 NC 27,194 17,367<br />
DC 37,383 26,627 ND 25,068 15,880<br />
FL 28,145 19,855 OH 28,400 18,792<br />
GA 27,940 17,738 OK 23,517 16,214<br />
HI 28,221 22,391 OR 28,350 18,253<br />
ID 24,180 15,866 PA 29,539 19,823<br />
IL 32,259 20,756 RI 29,685 20,194<br />
IN 27,011 17,625 SC 24,321 16,050<br />
IA 26,723 17,380 SD 26,115 16,238<br />
KS 27,816 18,182 TN 26,239 16,821<br />
KY 24,294 15,484 TX 27,871 17,458<br />
LA 23,334 15,223 UT 23,907 14,996<br />
ME 25,623 17,479 VT 26,901 18,055<br />
MD 33,872 23,023 VA 31,162 20,538<br />
MA 37,992 23,223 WA 31,528 20,026<br />
MI 29,612 19,022 WV 21,915 14,579<br />
MN 32,101 20,011 WI 28,232 18,160<br />
MS 20,993 13,164 WY 27,230 17,996<br />
MO 27,445 17,751<br />
Source: U.S. Department of Commerce,<br />
Bureau of Economic Analysis,<br />
Survey of Current Business<br />
Per Capita Personal Income<br />
U.S. PER CAPITA PERSONAL INCOME<br />
2000 1990<br />
2000 1990<br />
Transparency 10<br />
National Totals<br />
Per Capita Personal Income<br />
2000<br />
$28,404<br />
1990<br />
$18,755<br />
© Glencoe/McGraw-Hill Glencoe Algebra 1
foul<br />
pole<br />
300'<br />
Source: National Softball Association<br />
American Softball<br />
PROFESSIONAL<br />
SOFTBALL FIELD<br />
60'<br />
60'<br />
60'<br />
fence line<br />
Transparency 11<br />
© Glencoe/McGraw-Hill Glencoe Algebra 1<br />
300'<br />
foul<br />
pole
Consumer Price Index<br />
Transparency 12<br />
Consumer Price Index for All Urban Consumers<br />
July July<br />
Group 2001 2000<br />
Food 173.5 168.12<br />
Housing 177.6 170.61<br />
Apparel 122.6 124.47<br />
Transportation 154.4 153.78<br />
Medical care 273.1 261.34<br />
Education and communication 104.8 102.04<br />
Personal care 170.7 165.73<br />
Recreation 105.0 103.65<br />
All items 177.5 172.8<br />
Based on 100 representing the 1982–1984 index.<br />
Source: Bureau of Labor<br />
Statistics<br />
© Glencoe/McGraw-Hill Glencoe Algebra 1
Animal<br />
GESTATION AND<br />
AVERAGE LONGEVITY<br />
Bear (Grizzly)<br />
Beaver<br />
Bison<br />
Camel (Bactrian)<br />
Cat (domestic)<br />
Chimpanzee<br />
Chipmunk<br />
Cow<br />
Deer (white-tailed)<br />
Dog (domestic)<br />
Elephant (Asian)<br />
Elk<br />
Giraffe<br />
Goat (domestic)<br />
Gorilla<br />
Guinea pig<br />
Hippopotamus<br />
Horse<br />
Kangaroo<br />
Lion<br />
Monkey (rhesus)<br />
Mouse (meadow)<br />
Pig (domestic)<br />
Rabbit (domestic)<br />
Rhinoceros (black)<br />
Sea lion (California)<br />
Sheep (domestic)<br />
Squirrel (gray)<br />
Tiger<br />
Wolf (maned)<br />
Zebra (Grant’s)<br />
Transparency 13<br />
Gestation and Longevity of Animals<br />
Gestation<br />
(days)<br />
225<br />
122<br />
278<br />
406<br />
63<br />
231<br />
31<br />
284<br />
201<br />
61<br />
645<br />
250<br />
425<br />
151<br />
257<br />
68<br />
238<br />
330<br />
42<br />
100<br />
164<br />
21<br />
112<br />
31<br />
450<br />
350<br />
154<br />
44<br />
105<br />
63<br />
365<br />
Average<br />
Longevity<br />
(years)<br />
25<br />
5<br />
15<br />
12<br />
12<br />
20<br />
6<br />
15<br />
8<br />
12<br />
40<br />
15<br />
10<br />
8<br />
20<br />
4<br />
25<br />
20<br />
7<br />
15<br />
15<br />
3<br />
10<br />
5<br />
15<br />
12<br />
12<br />
10<br />
16<br />
5<br />
15<br />
Source: The Biology Data<br />
© Glencoe/McGraw-Hill Glencoe Algebra 1
TICKET PRICES<br />
10 Tickets $5.00<br />
20 Tickets $10.00<br />
Games and Probability<br />
TICKETS REQUIRED<br />
Duck Pond 1<br />
Wheel of Chance 1<br />
Land a Penny 2<br />
Transparency 14<br />
Pop a Balloon 2<br />
Ring Toss 2<br />
Basketball Throw 3<br />
Dunking Booth 3<br />
© Glencoe/McGraw-Hill Glencoe Algebra 1