Algebra 1 - MathnMind
Algebra 1 - MathnMind
Algebra 1 - MathnMind

Create successful ePaper yourself
Turn your PDF publications into a flip-book with our unique Google optimized e-Paper software.
1-9<br />
NAME ______________________________________________ DATE ____________ PERIOD _____<br />
Practice<br />
Statistics: Analyzing Data by Using Tables and Graphs<br />
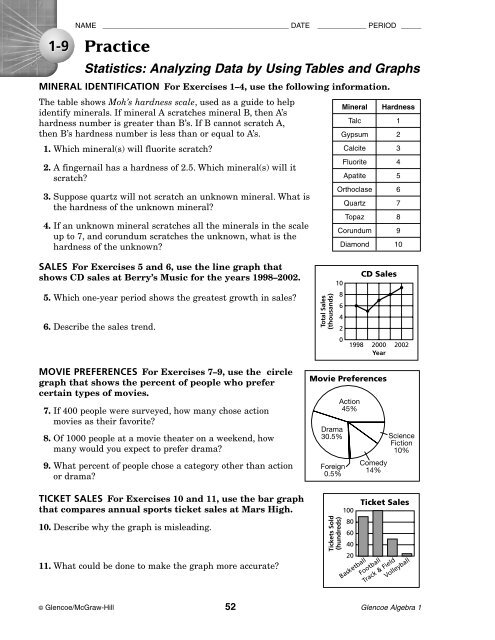
MINERAL IDENTIFICATION For Exercises 1–4, use the following information.<br />
The table shows Moh’s hardness scale, used as a guide to help<br />
identify minerals. If mineral A scratches mineral B, then A’s<br />
hardness number is greater than B’s. If B cannot scratch A,<br />
then B’s hardness number is less than or equal to A’s.<br />
1. Which mineral(s) will fluorite scratch?<br />
2. A fingernail has a hardness of 2.5. Which mineral(s) will it<br />
scratch?<br />
3. Suppose quartz will not scratch an unknown mineral. What is<br />
the hardness of the unknown mineral?<br />
4. If an unknown mineral scratches all the minerals in the scale<br />
up to 7, and corundum scratches the unknown, what is the<br />
hardness of the unknown?<br />
SALES For Exercises 5 and 6, use the line graph that<br />
shows CD sales at Berry’s Music for the years 1998–2002.<br />
5. Which one-year period shows the greatest growth in sales?<br />
6. Describe the sales trend.<br />
MOVIE PREFERENCES For Exercises 7–9, use the circle<br />
graph that shows the percent of people who prefer<br />
certain types of movies.<br />
7. If 400 people were surveyed, how many chose action<br />
movies as their favorite?<br />
8. Of 1000 people at a movie theater on a weekend, how<br />
many would you expect to prefer drama?<br />
9. What percent of people chose a category other than action<br />
or drama?<br />
TICKET SALES For Exercises 10 and 11, use the bar graph<br />
that compares annual sports ticket sales at Mars High.<br />
10. Describe why the graph is misleading.<br />
11. What could be done to make the graph more accurate?<br />
Movie Preferences<br />
Ticket Sales<br />
© Glencoe/McGraw-Hill 52 Glencoe <strong>Algebra</strong> 1<br />
Total Sales<br />
(thousands)<br />
10<br />
8<br />
6<br />
4<br />
2<br />
0<br />
Action<br />
Tickets Sold<br />
(hundreds)<br />
Drama<br />
30.5%<br />
Foreign<br />
0.5%<br />
Mineral Hardness<br />
Talc 1<br />
Gypsum 2<br />
Calcite 3<br />
Fluorite 4<br />
Apatite 5<br />
Orthoclase 6<br />
Quartz 7<br />
Topaz 8<br />
Corundum 9<br />
Diamond 10<br />
45%<br />
100<br />
80<br />
60<br />
40<br />
20<br />
CD Sales<br />
1998 2000<br />
Year<br />
2002<br />
Comedy<br />
14%<br />
Science<br />
Fiction<br />
10%<br />
Basketball<br />
Football<br />
Track & Field<br />
Volleyball