Comparison of Lys ,Pro -Human Insulin Analog and ... - Diabetes Care
Comparison of Lys ,Pro -Human Insulin Analog and ... - Diabetes Care
Comparison of Lys ,Pro -Human Insulin Analog and ... - Diabetes Care

Create successful ePaper yourself
Turn your PDF publications into a flip-book with our unique Google optimized e-Paper software.
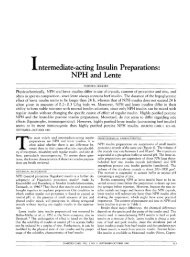
Table 1—Dosing nomogram<br />
Glucose<br />
range<br />
(mmol/1)<br />
05-10<br />
10-15<br />
15-18<br />
18-21<br />
21-24<br />
24-27<br />
27-30<br />
<strong>Insulin</strong> dosage<br />
per kg/m 2<br />
0.1<br />
0.2<br />
0.3<br />
0.4<br />
0.5<br />
0.6<br />
0.7<br />
(NovoFine, Novo Nordisk, Bagsvaerd, Denmark).<br />
The pens were prefilled, blinded,<br />
<strong>and</strong> sealed by the hospital pharmacist.<br />
Venous blood samples were taken at t<br />
- 20, 40, 60, 90, 120, 150, 180, 210, <strong>and</strong><br />
240 min postinjection. Whole blood glucose<br />
was measured using an APEC glucose<br />
analyzer (Danvers, MA). HbAlc was measured<br />
using high-performance liquid chromatography<br />
(Biograd, Anaheim, CA).<br />
Since the insulin dosages were determined<br />
by the nomogram, we decided to<br />
obtain a relative measure which expresses<br />
the fall in glucose in such a way that it corrects<br />
for the differences in the BMI <strong>and</strong> the<br />
administered dose. This relative measure<br />
<strong>of</strong> glucose, GR (mol • kg • IU" 1 • m~ 5 ), was<br />
calculated by dividing the glucose values<br />
(in millimoles per liter) at all time points<br />
by the insulin dose actually administered<br />
(in international units) <strong>and</strong> multiplying<br />
this figure with the measured BMI (in kilograms<br />
per meters squared).<br />
Data were statistically analyzed using<br />
the SPSS computer program.<br />
Differences between the time course <strong>of</strong><br />
lispro <strong>and</strong> regular human insulin were evaluated<br />
using an analysis <strong>of</strong> variance with<br />
repeated measures. The within-patient variability<br />
was defined as the square root <strong>of</strong> the<br />
error variance after the correction for the<br />
decrease <strong>of</strong> the GR values in time.<br />
RESULTS— The participants had a<br />
median age <strong>of</strong> 34 years (range, 20-60<br />
years), a median duration <strong>of</strong> diabetes <strong>of</strong> 8<br />
years (range, 0-30 years), an average<br />
HbAlc <strong>of</strong> 7.7 ± 1.1%, <strong>and</strong> a BMI <strong>of</strong> 24.4 ±<br />
1.7 kg/m 2 . Thirteen patients were r<strong>and</strong>omized<br />
to the lispro-regular insulin<br />
sequence, <strong>and</strong> fourteen were r<strong>and</strong>omized<br />
to the regular-lispro insulin sequence.<br />
There were no significant differences in<br />
baseline characteristics. The average dose<br />
<strong>of</strong> insulin administered was 7.9 ± 3.5 IU<br />
2<br />
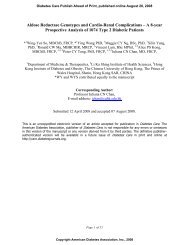
Absolute dose (IU) <strong>of</strong> insulin administered by BMI (kg/m )<br />
20 21 22 23 24 25 26 27<br />
2 2 2 2 2 2 3 3<br />
4 4 4 5 5 5 5 5<br />
6 6 7 7 7 7 8 8<br />
8 8 9 9 10 10 10 11<br />
10 10 11 11 12 12 13 14<br />
12 13 14 14 14 15 16 16<br />
14 15 15 16 17 17 18 19<br />
<strong>of</strong> regular human insulin <strong>and</strong> 7.9 ± 3.7 IU<br />
<strong>of</strong> lispro.<br />
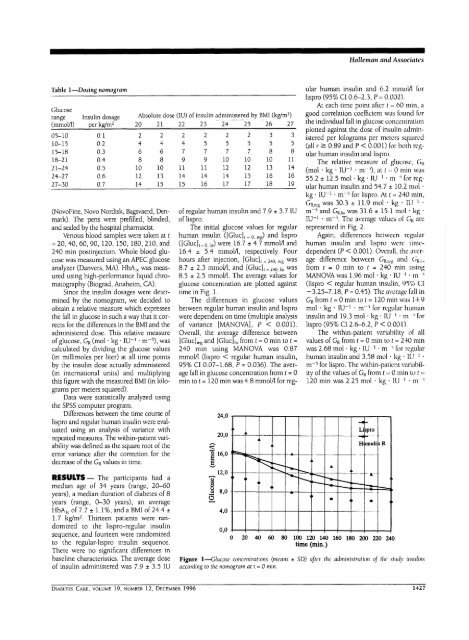
The initial glucose values for regular<br />
human insulin ([Glue], = 0, reg) an d lispro<br />
([Gluc]( = 0 us) were 16.7 ± 4.7 mmol/1 <strong>and</strong><br />
16.4 ± 5.4 mmol/1, respectively. Four<br />
hours after injection, [Glue], = 240, a-g was<br />
8.7 ± 2.3 mmol/1, <strong>and</strong> [Gluc], = 24o, us was<br />
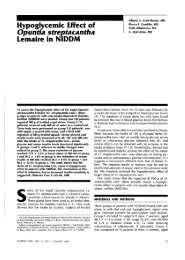
8.5 ± 2.5 mmol/1. The average values for<br />
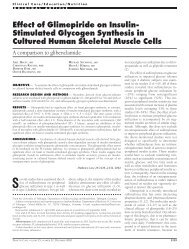
glucose concentration are plotted against<br />
time in Fig. 1.<br />
The differences in glucose values<br />
between regular human insulin <strong>and</strong> lispro<br />
were dependent on time (multiple analysis<br />
<strong>of</strong> variance [MANOVA], P < 0.001).<br />
Overall, the average difference between<br />
[Gluc]reg <strong>and</strong> [GlucJiis from t = 0 min to t =<br />
240 min using MANOVA was 0.87<br />
mmol/1 (lispro < regular human insulin,<br />
95% CI 0.07-1.68, P = 0.036). The average<br />
fall in glucose concentration from t = 0<br />
min to t = 120 min was 4.8 mmol/1 for reg-<br />
24,0<br />
20,0<br />
16,0<br />
12,0<br />
I 4,0<br />
><br />
0,0<br />
0 20 40 60 80<br />
Figure 1—Glucose concentrations (means<br />
according to the nomogram at t = 0 min.<br />
<<br />
4<br />
<<br />
Holleman <strong>and</strong> Associates<br />
ular human insulin <strong>and</strong> 6.2 mmol/1 for<br />
lispro (95% CI 0.6-2.3, P - 0.002).<br />
At each time point after t = 60 min, a<br />
good correlation coefficient was found for<br />
the individual fall in glucose concentration<br />
plotted against the dose <strong>of</strong> insulin administered<br />
per kilograms per meters squared<br />
(all r > 0.89 <strong>and</strong> P < 0.001) for both regular<br />
human insulin <strong>and</strong> lispro.<br />
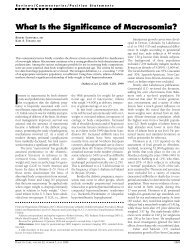
The relative measure <strong>of</strong> glucose, GR<br />
(mol • kg • IU" 1 • m ~0, at t -•• 0 min was<br />
55.2 ± 12.5 mol • kg • IU ! • m ' for regular<br />
human insulin <strong>and</strong> 54.7 ± 10.2 mol •<br />
kg • IU" 1 • m~ 5 for lispro. At t - 240 min,<br />
GR,K8 was 30.3 ±11.9 mol • kg • IU ' •<br />
m~ 5 <strong>and</strong> GRiiLS was 31.6 ± 15.1 mol • kg •<br />
IU" 1 • m" 5 . The average values <strong>of</strong> GR are<br />
represented in Fig. 2.<br />
Again, differences between regular<br />
human insulin <strong>and</strong> lispro were timedependent<br />
(P < 0.001). Overall, the average<br />
difference between GRrc,, <strong>and</strong> GRj,s<br />
from t = 0 min to t = 240 min using<br />
MANOVA was 1.96 mol • kg • IU ' • m *<br />
(lispro < regular human insulin, 95% CI<br />
-3.25-7.18, P = 0.45). The average fall in<br />
GR from t = 0 min to t = 120 min was 14.9<br />
mol • kg • IU" 1 • m" i for regular human<br />
insulin <strong>and</strong> 19.3 mol • kg • IU ' • m ' for<br />
lispro (95% CI 2.6-6.2, P < 0.001).<br />
The within-patient variability <strong>of</strong> all<br />
values <strong>of</strong> GR from t = 0 min to t = 240 min<br />
was 2.68 mol • kg • IU" 1 • m ' for regular<br />
human insulin <strong>and</strong> 3.58 mol • kg • IU ' •<br />
m~ 5 for lispro. The within-patient variability<br />
<strong>of</strong> the values <strong>of</strong> GR from t - 0 min to t -<br />
120 min was 2.25 mol • kg • IU ' • m '<br />
A<br />
4<br />
*- .<br />
100 120 140<br />
time (min.)<br />
•<br />
" .<br />
i<br />
<<br />
— •<br />
Li .pro<br />
Hi lmuli iR<br />
— —<br />
><br />
^—+ ,<br />
><br />
- A -<br />
160 180 200 220 240<br />
SD) after the administration <strong>of</strong> the study insulins<br />
DIABKTES CARE, VOLUME 19, NUMBER 12, DECEMBER 1996 1427<br />
•