Enhanced Coal Bed Methane (ECBM) - Australian Institute of Energy
Enhanced Coal Bed Methane (ECBM) - Australian Institute of Energy
Enhanced Coal Bed Methane (ECBM) - Australian Institute of Energy

Create successful ePaper yourself
Turn your PDF publications into a flip-book with our unique Google optimized e-Paper software.
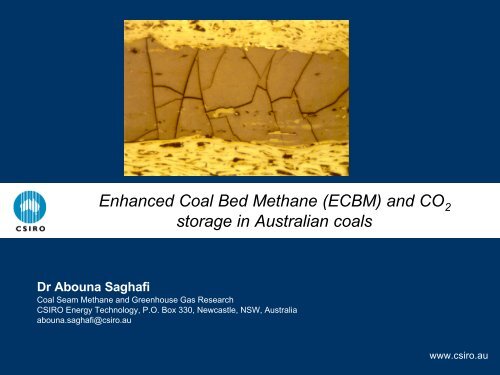
<strong>Enhanced</strong> <strong>Coal</strong> <strong>Bed</strong> <strong>Methane</strong> (<strong>ECBM</strong>) and CO 2<br />
storage in <strong>Australian</strong> coals<br />
Dr Abouna Saghafi<br />
<strong>Coal</strong> Seam <strong>Methane</strong> and Greenhouse Gas Research<br />
CSIRO <strong>Energy</strong> Technology, P.O. Box 330, Newcastle, NSW, Australia<br />
abouna.saghafi@csiro.au<br />
www.csiro.au
Gas in coal<br />
<strong>Coal</strong> is a sedimentary reservoir<br />
rock but it differs markedly from<br />
other conventional reservoirs in<br />
its capacity to retain significant<br />
volumes <strong>of</strong> gas in its pore<br />
system.<br />
Though coal pore volume is<br />
small (
Outline<br />
Aspects <strong>of</strong> coal seam gas (CSG) in Australia<br />
Mine safety<br />
Greenhouse gas emissions<br />
<strong>Coal</strong> seam methane (CSM)<br />
Petroleum and coal seam gas production<br />
<strong>Enhanced</strong> methane recovery (<strong>ECBM</strong>) and CO 2<br />
sequestration<br />
CO 2 occurrence in <strong>Australian</strong> coal seams<br />
CO 2 and methane storage and diffusion properties <strong>of</strong><br />
coal (Sydney Basin)<br />
Estimates <strong>of</strong> CO 2 storage potential in <strong>Australian</strong> coal<br />
seams
Aspects <strong>of</strong> coal seam gas, mine safety<br />
In the past the occurrence<br />
<strong>of</strong> seam gas has been the<br />
cause <strong>of</strong> myriad <strong>of</strong><br />
explosions, fire and<br />
fatalities in <strong>Australian</strong> coal<br />
mines<br />
Some coal mines closed<br />
because <strong>of</strong> severity and<br />
frequency <strong>of</strong> gas emissions,<br />
Nymboida colliery<br />
(1975); Clarence-<br />
Moreton Basin<br />
Leichhardt (1983);<br />
Bowen Basin<br />
Outburst (Photo Photo Courtesy Tahmoor Mine)<br />
Moura (1994) gas and<br />
spon-com; Bowen<br />
Basin Tahmoor Colliery Gas outburst (Year 1985) – Relatively<br />
small gas-rock event: 330 tonnes <strong>of</strong> rock/coal and<br />
3000 m 3 <strong>of</strong> gas filled the roadway in few seconds.<br />
High gas emissions and gas outbursts occur frequently<br />
in underground coal mines around the world.
By early 1990’s,<br />
some 30,000 gas<br />
outbursts had<br />
been occurred<br />
worldwide.<br />
The gas outburst<br />
can be very large<br />
e.g. in in Gagarin<br />
Colliery (Donetsk<br />
coalfield, Russia)<br />
some outbursts<br />
caused the<br />
ejection <strong>of</strong><br />
14,500 tonnes <strong>of</strong><br />
coal and release<br />
<strong>of</strong> 60,000 m 3 <strong>of</strong><br />
methane in few<br />
seconds<br />
(Lama and<br />
Saghafi, 2002).<br />
History <strong>of</strong> gas outburst in underground<br />
coal mines<br />
China<br />
14,000<br />
6,814<br />
France<br />
4,689<br />
Ukraine<br />
Number <strong>of</strong> gas outbursts<br />
(recorded before 1990)<br />
1,792<br />
Poland<br />
920 669 600 521 487 482 411 359 250 200 60 58 45 20 5<br />
Japan<br />
Australia<br />
Hungary<br />
Russia<br />
Belgium<br />
Czech Rep.<br />
Canada<br />
… and some<br />
700 outbursts<br />
in Sydney Basin<br />
Germany<br />
Bulgaria<br />
UK<br />
Taiwan<br />
Turkey<br />
Kazakstan<br />
Romania<br />
S. Africa<br />
14000<br />
12000<br />
10000<br />
8000<br />
6000<br />
4000<br />
2000<br />
0
Annual methane emissions (Mm 3 )<br />
Annual <strong>Methane</strong> Emission (Mm 3 )<br />
90<br />
80<br />
70<br />
60<br />
50<br />
40<br />
30<br />
20<br />
10<br />
Aspects <strong>of</strong> coal seam gas, greenhouse emissions<br />
0<br />
140<br />
120<br />
100<br />
80<br />
60<br />
40<br />
20<br />
0<br />
<strong>Methane</strong> emissions from <strong>Australian</strong> u/g mines<br />
Ventilation<br />
Drainage<br />
Specific emission<br />
Q = 4.13 P.C i<br />
Wyee<br />
Teralba<br />
Munmorah<br />
Nth Goonyella<br />
Wallsend<br />
Newstan<br />
Gordonstone<br />
Oaky Creek<br />
Metropolitan<br />
South Bulli<br />
South Bulga<br />
Tahmoor<br />
Cordeaux<br />
Westcliff<br />
Central Colliery<br />
Tower<br />
Appin<br />
Haenke<br />
Dartbrook<br />
Oakdale<br />
0 5 10 15 20 25 30 35<br />
<strong>Methane</strong> volume in mined coal<br />
Emission<br />
from<br />
underground<br />
Total<br />
emission<br />
Fitted<br />
emission<br />
90<br />
80<br />
70<br />
60<br />
50<br />
40<br />
30<br />
20<br />
10<br />
0<br />
Specific emission (m 3 /t)<br />
More than a<br />
billion m 3 <strong>of</strong><br />
methane is<br />
vented to the<br />
atmosphere<br />
each year<br />
from<br />
<strong>Australian</strong><br />
underground<br />
coal mines
<strong>Coal</strong> Mine <strong>Methane</strong> (CMM), from a<br />
safety hazard to a source <strong>of</strong> <strong>Energy</strong><br />
Since 1980’s gas from<br />
active mines were<br />
used for local use<br />
initially).<br />
The first significant<br />
coal gas project in<br />
Australia was the<br />
Appin-Tower project<br />
with a nominal<br />
electricity production<br />
<strong>of</strong> 94 MW.<br />
The operation is still<br />
running (since 1996)<br />
though at lower<br />
capacity <strong>of</strong>
Mine Gas Utilisation (Appin-Tower<br />
Project)<br />
The 54 engines at Appin colliery uses the<br />
drained gas but also uses the mine ventilation<br />
air as combustion air, thereby destroying all<br />
methane from the coal mine.<br />
The project reduces GHGE by ~2.5 Mt/y CO 2 -e.<br />
Appin-Tower is the largest mine gas GHGE<br />
reduction in the world.
Aspects <strong>of</strong> coal seam gas, a new ‘green<br />
energy’ for Australia<br />
Many <strong>Australian</strong> coal<br />
seams contain high<br />
volumes <strong>of</strong> methane gas<br />
(up to 25 m 3 /t).<br />
With continuos reduction in the<br />
cost <strong>of</strong> seam gas production<br />
and depletion <strong>of</strong> conventional<br />
energy resources, combined<br />
with the greenhouse gas<br />
benefits, the CSM is rapidly<br />
developing in Australia<br />
CH 4
<strong>Australian</strong> commercial<br />
CBM production started<br />
in 1996 in the state <strong>of</strong><br />
Queensland<br />
<strong>Coal</strong> seam gas compensates the<br />
shortfall in natural gas!<br />
Queensland<br />
NSW<br />
Bowen and Sydney coal basins
Qld has a<br />
CSM<br />
resources<br />
<strong>of</strong> 150 to<br />
500 kPJ<br />
(250 TCF)<br />
and<br />
reserves <strong>of</strong><br />
up to 6 kPJ<br />
(6 TCF)<br />
Evolution <strong>of</strong> CSM production<br />
(QLD)<br />
1800<br />
1600<br />
1400<br />
1200<br />
1000<br />
800<br />
600<br />
400<br />
200<br />
0<br />
<strong>Methane</strong><br />
production<br />
(million m 3 )<br />
CSM productioin in Queensland<br />
1994 1996 1998 2000 2002 2004 2006<br />
Year<br />
90<br />
80<br />
70<br />
60<br />
50<br />
40<br />
30<br />
20<br />
10<br />
0<br />
<strong>Methane</strong><br />
production<br />
x 10 15 joules<br />
Mm3<br />
PJ
<strong>Coal</strong> Seam <strong>Methane</strong>, Queensland<br />
1996 – Production from Dawson Valley gas field and Moura Mine<br />
started; gas supplied to Wallumbilla-Gladstone pipeline<br />
1998 – Production from Fairview field started; gas supplied to<br />
Wallumbilla-Gladstone pipeline.<br />
2001 – Peat gas field came into production.<br />
2002 – Scotia gas field came into production.<br />
2002 – Queensland government released the new energy policy<br />
mandating 13% electricity generation from natural gas (by 2005).<br />
2004 – Mungi field near Moura came into production.<br />
2005 – Moranbah project, producing gas for electricity generation<br />
in Townsville, as part <strong>of</strong> the project a pipeline between Moranbah<br />
and Townsville was constructed. Also innovative horizontal 1 km<br />
in-seam drilling was used.<br />
Currently 40% <strong>of</strong> Qld gas consumption is sourced from coal<br />
seam gas.
<strong>Coal</strong> seam methane (CSM), New South<br />
Wales<br />
NSW Government has no set target for natural gas<br />
use. But a greenhouse gas mitigation scheme<br />
penalises energy producers for over reliance on<br />
coal<br />
NSW government had sponsored a project managed<br />
by Sydney Gas Company to optimise the<br />
production <strong>of</strong> CBM from Sydney Basin<br />
Tens <strong>of</strong> exploration and production gas wells to<br />
depths <strong>of</strong> >900 m were drilled in the Southern<br />
and Hunter Valley coalfields in Sydney Basin
<strong>Coal</strong> seam methane (CSM) production in<br />
Australia, well flowrates <strong>of</strong> 20-25 x10 3 m 3 /day<br />
<strong>Australian</strong> 20 CSM production (PJ/y)<br />
18<br />
16<br />
14<br />
12<br />
10<br />
8<br />
6<br />
4<br />
2<br />
0<br />
Origin <strong>Energy</strong><br />
Santos/ Tipperary<br />
BHP<br />
CH4<br />
Anglo <strong>Coal</strong><br />
Sydney Gas<br />
Arrow<br />
CS <strong>Energy</strong><br />
Current (year 2005) active CSM<br />
fields are: Southern Sydney<br />
Basin, Moranbah, Fairview<br />
(Comet Ridge), Durhm Ranch<br />
(Spring Gully), Dawson Valley,<br />
Moura, Peat, Walloons, and<br />
Scotia.<br />
In Queensland ~55 PJ/y <strong>of</strong> coal<br />
seam methane is now (2005)<br />
produced from Bowen and<br />
Surat Basins, this constitutes<br />
40% <strong>of</strong> the total gas<br />
consumption in Queensland<br />
(~120 PJ/y)
<strong>Coal</strong> Seam Gas and Petroleum Gas<br />
Resources and production<br />
<strong>Coal</strong> Seam <strong>Methane</strong><br />
Qld CSM resources: ~150,000 - 500,000 PJ<br />
Qld CSM reserves:<br />
3P (proved, probable and possible) : ~6000 PJ<br />
Qld gas consumption: 110-130 PJ per year<br />
Petroleum Gas<br />
Australia total petroleum gas reserves: ~140,000 PJ<br />
Petroleum gas is mainly destined for exportation;<br />
Australia is 5 th world largest exporter <strong>of</strong> LNG<br />
415 PJ/y to Japan, USA, S Korea,..<br />
160 PJ/y to China alone for 25 years (from 2006)
ustralian<br />
Natural Gas<br />
reserves<br />
and<br />
distribution<br />
(2001) :<br />
52.7<br />
%<br />
16.2%<br />
19.5%<br />
Reserves ~140,000 PJ,<br />
Production :1,200 PJ/y<br />
Cooper Basin<br />
200 PJ/y<br />
production.<br />
Reservoir<br />
is depleting at a<br />
rate <strong>of</strong> 10% per<br />
year!<br />
4.2%<br />
Cooper<br />
Basin<br />
Proposed PNG<br />
gas pipeline,<br />
starts 2009/10<br />
7.5%
Greenhouse gas emissions and <strong>Australian</strong><br />
dependence on fossil fuel<br />
NSW and Queensland secures 90-95% <strong>of</strong> their electricity<br />
from coal-fired and to a lesser extent from gas-fired<br />
power plants.<br />
There are no realistic prospects in the foreseeable future<br />
that this heavy dependence on fossil fuel (coal and gas)<br />
will decrease.<br />
Demand for electricity meanwhile continues to rise<br />
steadily, to 50% by year 2020, meaning that the overall<br />
emissions <strong>of</strong> CO 2 are set to rise, probably substantially.<br />
Increasingly, carbon capture and sequestration (CCS) is<br />
seen as a means whereby we can continue our<br />
dependence upon coal and gas to generate electricity<br />
without consequential increases in atmospheric carbon<br />
dioxide levels.
Per capita Australia is the most intensive GHG<br />
Emitter<br />
In absolute<br />
terms<br />
Australia<br />
contributes<br />
to 1.3% <strong>of</strong><br />
total world<br />
GHGE<br />
and 3.4% <strong>of</strong><br />
the Annex 1<br />
emissions.<br />
Spain<br />
France<br />
Italy<br />
Japan<br />
Germany<br />
UK<br />
Russia<br />
Ireland<br />
Canada<br />
US<br />
Australia<br />
0.4<br />
0.1<br />
0.6<br />
0.5<br />
1.0<br />
0.7<br />
0.7<br />
0.5<br />
1.4<br />
2.0<br />
7.0<br />
9.3<br />
9.5<br />
9.5<br />
10.9<br />
12.1<br />
12.6<br />
13.7<br />
x 10 9 tonnes per year<br />
GhGE, CO2-e<br />
Annex 1 countries (UNFCCC, 2001)<br />
United Nations Framework Convention on Climate Change<br />
tonnes per year (per capita)<br />
17.5<br />
23.0<br />
23.8<br />
25.5<br />
0 5 10 15 20 25 30
<strong>Enhanced</strong> <strong>Coal</strong> <strong>Bed</strong> <strong>Methane</strong> (<strong>ECBM</strong>)<br />
Injection<br />
well<br />
Diluting<br />
gas<br />
mixture<br />
(flue gas)<br />
CH 4<br />
Production<br />
well<br />
<strong>ECBM</strong> is the<br />
process <strong>of</strong><br />
injecting a pure or<br />
a mixture <strong>of</strong> gases<br />
(flue gas into a<br />
coal seam to<br />
enhance the<br />
recovery <strong>of</strong><br />
coalbed methane<br />
(CBM).
<strong>Enhanced</strong> gas recovery from coal seams,<br />
N2-<strong>ECBM</strong> CO2-<strong>ECBM</strong> Injection<br />
well<br />
N 2 or CO 2<br />
CH 4<br />
Production<br />
well<br />
N 2 or CO 2 can be injected<br />
into coal seams to<br />
enhance methane release.<br />
N 2 is a diluent reducing<br />
partial pressure <strong>of</strong><br />
methane and hence<br />
stimulates its release; CO 2<br />
adsorbs stronger to the<br />
coal, would replace<br />
methane and enhance its<br />
release<br />
Simultaneous CO 2 storage<br />
and CH 4 capture is an<br />
appealing option because<br />
<strong>of</strong> combined GhGE<br />
mitigation and energy<br />
recovery benefits
Field experiences <strong>of</strong> <strong>ECBM</strong><br />
So far there has been no <strong>ECBM</strong> trial in Australia; worldwide<br />
limited pilot operation have been conducted in USA (St Juan<br />
Basin), Canada (Manville) and China (Qinshui Basin)<br />
The first small scale N 2 -<strong>ECBM</strong> trial was undertaken in<br />
December 1993 in the St Juan Basin from Fruitland<br />
formation in Colorado (BP-Amoco).<br />
Alberta Research Council (ARI) and partners performed a<br />
CO 2 -<strong>ECBM</strong> into the Manville Formation coal seams at the<br />
Fen Big Valley in Alberta.<br />
A Canadian consortium (CIDA) and China United CBM<br />
corporation are currently (year 2005) undertaking a micro<br />
pilot operation in Shanxi province injecting CO 2 into semianthracite<br />
coal seams <strong>of</strong> Qinshui Basin.
<strong>ECBM</strong> research issues<br />
<strong>Coal</strong> capacity for storing seam gases<br />
Adsorbed gas; preferential CO 2/CH /CH4 sorption into coal and controls <strong>of</strong><br />
gas saturation levels<br />
Free gas storage<br />
Diffusive gas flow in coal<br />
Preferential CO 2/CH /CH4 diffusive flow<br />
<strong>Coal</strong> water/gas permeability and variations with<br />
adsorption/desorption<br />
Relative permeability<br />
Effect <strong>of</strong> swelling/shrinkage<br />
• Origin <strong>of</strong> gas in coal seam and variations in gas types<br />
• Biogenic/thermogenic origin<br />
• CO2, CH4 and C2+
<strong>ECBM</strong>/CBM issues, water<br />
Formation water in <strong>Australian</strong> coal measures <strong>of</strong> Sydney and<br />
Bowen Basins do not occur in large volumes and so far<br />
water production from CBM in Australia has been relatively<br />
small (less than 500 barrels <strong>of</strong> water per day and per well).<br />
Such volumes <strong>of</strong> water could be dealt with by evaporation in<br />
water ponds.<br />
However with increase in <strong>Australian</strong> CBM production and<br />
move to younger basins where CBM production is<br />
accompanied with high volumes <strong>of</strong> water (such as Surat<br />
Basin in Queensland) other solutions including reinjecting<br />
<strong>of</strong> water in depleted wells are envisaged. Reinjecting could<br />
take place after a reverse osmosis treatment to remove<br />
salts.<br />
Also for CBM wells close to potential consumption points<br />
the use <strong>of</strong> water for irrigation, coal washeries and coal fired<br />
plants ( cooling water) is being studied.
<strong>Coal</strong> seam reservoir, storage size<br />
How much gas is (could be) stored in coal?<br />
Total gas volume in-situ = adsorbed phase + free phase<br />
per tonne <strong>of</strong> coal<br />
m 3 /t<br />
= f ( p,<br />
T , coal rank & type)<br />
+<br />
pM<br />
RT<br />
ε<br />
ρ<br />
c
CO 2 /CH 4 storage in rock/coal, free phase<br />
Compared to other<br />
seam gases much<br />
less void space is<br />
required to store<br />
CO 2 (free phase<br />
gas)<br />
m 3 <strong>of</strong><br />
void<br />
space<br />
required<br />
to store<br />
one<br />
tonne <strong>of</strong><br />
gas<br />
CH4<br />
N2<br />
CO2<br />
1000<br />
100<br />
10<br />
1<br />
Measurement at 55°C<br />
0 2 4 6 8 10 12 14 16<br />
Gas pressure, MPa
CO 2 /CH 4 storage in coal, adsorbed phase<br />
Compared to other<br />
seam gases<br />
much less mass<br />
<strong>of</strong> coal is<br />
required to store<br />
CO 2<br />
(adsorbed phase)<br />
Tonne <strong>of</strong><br />
coal<br />
required<br />
to store<br />
one tonne<br />
<strong>of</strong> gas<br />
N2<br />
CH4<br />
CO2<br />
1000<br />
100<br />
10<br />
1<br />
Gas adsorbed at 55°C<br />
0 2 4 6 8 10 12 14 16<br />
Absolute pressure (MPa)
c<br />
Gas is retained in coal by adsorption forces<br />
Adsorption isotherm<br />
p<br />
Gas is adsorbed<br />
in coal following<br />
a micro-pore<br />
filling<br />
mechanism,<br />
Once micro-pores<br />
are filled no<br />
further<br />
adsorption<br />
occurs.<br />
c<br />
=<br />
p<br />
V<br />
L<br />
+<br />
Majority <strong>of</strong><br />
pores in<br />
coal are <strong>of</strong><br />
order <strong>of</strong><br />
nano-meter<br />
size<br />
p<br />
P<br />
L<br />
~nm<br />
Free phase<br />
gas<br />
pressure:<br />
p<br />
<strong>Coal</strong> gas content: c<br />
Adsorbed gas<br />
<strong>Coal</strong>
Gas storage capacity <strong>of</strong> Bowen Basin coals<br />
At a mining depth<br />
<strong>of</strong> 300 m some<br />
Bowen Basin<br />
coal can retain<br />
up to 20 m 3 /t <strong>of</strong><br />
CH 4 and 40 m 3 /t<br />
<strong>of</strong> CO 2 .<br />
50<br />
40<br />
30<br />
20<br />
The storage<br />
capacity<br />
10<br />
increases with<br />
depth 0<br />
<strong>Coal</strong> as received, Gas adsorption at 27°C<br />
Gas content (m<br />
60<br />
3 /t)<br />
100 m 200 m 300 m 400 m<br />
Depth<br />
CH 4<br />
CO 2<br />
Absolute pressure (kPa)<br />
0 1000 2000 3000 4000 5000 6000
Measurement <strong>of</strong> gas flow/storage<br />
properties <strong>of</strong> coal<br />
⎛ K P M ⎞ ⎛ M −αt<br />
−∇•<br />
⎜<br />
⎜(<br />
ρa<br />
+ Dsε<br />
) ∇P<br />
=<br />
e c<br />
Pa<br />
z R T ⎟<br />
⎜<br />
⎜−ε<br />
+ ( 1−<br />
) ρ ρ<br />
⎝ η ⋅ ⋅ ⎠ ⎝ zR⋅T<br />
1 – Laminar flow <strong>of</strong> free gas<br />
by permeation ( Darcy’s<br />
law)<br />
2 –Desorption and flow <strong>of</strong><br />
desorbed gas by<br />
diffusion (slipping flow,<br />
Knudsen flow, Fick’s law)<br />
a<br />
V P<br />
L<br />
L<br />
( P+<br />
P )<br />
L<br />
2<br />
⎞∂P<br />
⎟<br />
⎠ ∂t<br />
Gas flow<br />
k ∂p<br />
ψ 1 = −<br />
η ∂x<br />
ψ<br />
2<br />
∂c<br />
= −D<br />
∂x<br />
1<br />
2<br />
2<br />
2
Measurement <strong>of</strong> rate <strong>of</strong> diffusion <strong>of</strong> coal seam gases,<br />
Bowen Basin coal<br />
Access <strong>of</strong> gas to the<br />
micropores where<br />
most <strong>of</strong> gas is stored<br />
occurs only by<br />
diffusion.<br />
Therefore the injection<br />
and storage <strong>of</strong> gas in<br />
coal is ultimately<br />
controlled by the rate<br />
<strong>of</strong> diffusive flow <strong>of</strong> gas<br />
in coal.<br />
The diffusivity values<br />
obtained are:<br />
CO 2 :6.37 x 10 -10 m 2 /s<br />
CH 4 : 3.41 x 10 -10 m 2 /s<br />
Gas volume diffused per<br />
unit surface area <strong>of</strong> coal<br />
(Litre/m 2 )<br />
80<br />
70<br />
60<br />
50<br />
40<br />
30<br />
20<br />
10<br />
0<br />
CO 2<br />
0 20 40 60 80 100 120<br />
Time elapsed (hour)<br />
CH 4<br />
12.1<br />
mL/min/m 2<br />
6.7<br />
mL/min/m 2
Fate <strong>of</strong> coalification generated CO 2<br />
Transformation <strong>of</strong> peat to lignite to bituminous<br />
coal (coalification) has been an ongoing<br />
process over many millions <strong>of</strong> years.<br />
<strong>Coal</strong>ification process produces high volumes<br />
<strong>of</strong> CO 2 ,CH 4 and water.<br />
This occurs through various chemical<br />
reactions such as: decarboxylation,<br />
dehydration and, de-alkalisation.<br />
Though much more CO 2 than CH 4 had<br />
been generated during coallification, and<br />
that coal can retain much more CO 2 than<br />
CH 4 most world coal seams contain mainly<br />
methane.<br />
Gas generation (m 3 /t)<br />
250<br />
200<br />
150<br />
100<br />
50<br />
0<br />
Gas generation from laboratory coalification<br />
<strong>Australian</strong> coal<br />
CO2<br />
CH4<br />
Vitrinite reflectance (%)<br />
0 0.5 1 1.5 2 2.5 3 3.5<br />
Lignite<br />
High/low voltaile<br />
bituminous<br />
Maturation<br />
Anthracite<br />
The reason for the absence <strong>of</strong> primary CO 2 is<br />
that most had been dissolved in water produced<br />
during coalification. The dissolved CO 2 had<br />
then either migrated away or have formed<br />
carbonate in the coal fractures and<br />
neighbouring formations.
Sources <strong>of</strong> secondary CO 2 generation<br />
in coal<br />
Though methane is dominant seam gas, <strong>Australian</strong><br />
coal basins including Sydney Basin contain various<br />
amount <strong>of</strong> CO 2<br />
The secondary sources <strong>of</strong> CO 2 in coal seams could<br />
be,<br />
Thermal destruction <strong>of</strong> carbonate and<br />
carbonate dissolution<br />
Bacterial activities (hydrocarbon oxidation,<br />
degradation <strong>of</strong> organic matters)<br />
Igneous activities and magma migration
Sources <strong>of</strong> CO 2 in Sydney Basin coal<br />
It is believed that most <strong>of</strong> CO 2 in Sydney<br />
Basin is <strong>of</strong> igneous origin (Smith et al, 1985),<br />
because:<br />
High CO 2 content areas have generally<br />
isotopic compositions corresponding to<br />
CO 2 magmatic sources (d 13 C=-7 ‰)<br />
The highest concentrations <strong>of</strong> CO 2 are<br />
localised laterally along major faults.
Sydney Basin CO 2 adsorption study<br />
Some 27 coals<br />
from 17 seams in<br />
13 locations in<br />
Sydney Basin were<br />
measured. The<br />
coal seams depths<br />
varied from less<br />
than 57 to more<br />
than 723 m.<br />
<strong>Coal</strong> rank varied<br />
from low volatile<br />
bituminous to high<br />
volatile bituminous<br />
(Rv= 0.66 to 1.45%)<br />
0<br />
100<br />
200<br />
300<br />
400<br />
500<br />
600<br />
700<br />
0 10 20 30 40 50<br />
800<br />
Seam depth (m)<br />
Metamorphosed<br />
coals<br />
Volatile matter (%)
CO 2 adsorption capacity <strong>of</strong> Sydney Basin coal<br />
Gas adsorption<br />
behaviour was<br />
presented by<br />
Langmuir type<br />
isotherm:<br />
c<br />
=<br />
p<br />
V<br />
L<br />
+<br />
Difference in<br />
adsorption<br />
capacity (V L )<br />
across Sydney<br />
Basin was<br />
tw<strong>of</strong>old<br />
p<br />
P<br />
L<br />
Gas adsorbed, daf (m 3 /t)<br />
80<br />
70<br />
60<br />
50<br />
40<br />
30<br />
20<br />
10<br />
0<br />
<strong>Coal</strong>13<br />
<strong>Coal</strong>14<br />
0 2000 4000 6000 8000<br />
Absolute gas pressure (kPa)
Preferential storage <strong>of</strong> gas in coal<br />
CO 2 , CH 4 and N 2<br />
adsorb to coal in<br />
decreasing<br />
strength <strong>of</strong><br />
adsorption,<br />
For this coal, 2-<br />
2.5 molecules <strong>of</strong><br />
CO 2 would<br />
replace<br />
1 molecule <strong>of</strong> CH 4<br />
depending on gas<br />
pressure<br />
Total gas adsorbed (m 3 /t)<br />
40<br />
35<br />
30<br />
25<br />
20<br />
15<br />
10<br />
5<br />
0<br />
Carbon dioxide<br />
<strong>Methane</strong><br />
Nitrogen<br />
0 1000 2000 3000 4000 5000 6000<br />
Absolute pressure (kPa)
Storage capacity Sydney Basin coals; Effect <strong>of</strong><br />
coal maturation<br />
Capacity increases<br />
with rank; and two<br />
trends can be<br />
observed for<br />
higher and lower<br />
rank coals <strong>of</strong> the<br />
Sydney Basin in<br />
the North and<br />
South <strong>Coal</strong>fields<br />
This could have<br />
important<br />
implications for a<br />
pilot CO 2<br />
sequestration<br />
project in Australia<br />
Langmuir volume (m 3 /t)<br />
100<br />
90<br />
80<br />
70<br />
60<br />
50<br />
40<br />
30<br />
20<br />
Northern<br />
Sydney<br />
Basin<br />
coalfields<br />
0.50 0.70 0.90 1.10 1.30 1.50<br />
Vitrinite reflectance (%)<br />
Southern<br />
Sydney Basin<br />
coalfields<br />
<strong>Coal</strong> maturation
CO 2 storage at different depths, Sydney Basin<br />
coals<br />
CO 2 adsorption<br />
capacity <strong>of</strong> the<br />
Sydney Basin<br />
coals increases<br />
with seam depth<br />
following a<br />
power function.<br />
This could have<br />
important<br />
implications for<br />
a pilot CO 2<br />
sequestration<br />
project in<br />
Australia.<br />
0<br />
100<br />
200<br />
300<br />
400<br />
500<br />
600<br />
700<br />
800<br />
900<br />
1000<br />
CO2 storage capacity (m 3 /t)<br />
0 20 40 60 80<br />
Seam depth (m)<br />
C = C 0 (h/h 0) a
Estimate <strong>of</strong> CO 2 sequestration potential <strong>of</strong><br />
NSW coals (1)<br />
NSW coal<br />
•Demonstrated: 34 billion tonnes<br />
•Inferred resources: 57 billion tonnes<br />
Assume all demonstrated<br />
resources are mined and all<br />
inferred resources are used<br />
for CO 2 storage (57 Bt)<br />
An average in-situ CO 2<br />
adsorption capacity <strong>of</strong><br />
~40 m 3 /t<br />
can be used based on the<br />
developed equation<br />
100<br />
200<br />
300<br />
400<br />
500<br />
600<br />
700<br />
800<br />
900<br />
1000<br />
CO2 storage capacity (m 3 /t)<br />
0 20 40 60 80<br />
0<br />
Seam depth (m)<br />
C = C 0 (h/h 0) a<br />
Depth >600 m<br />
Storage = or<br />
> 40 m 3 /t
Estimate <strong>of</strong> CO 2 storage potential <strong>of</strong> NSW coals<br />
(2)<br />
If only the inferred coal resources (57 Bt) are<br />
used for the sequestration projects then total<br />
CO 2 storage capacity <strong>of</strong> NSW is<br />
CO 2 storage =<br />
2.28 trillion m 3<br />
4.1 billion tonnes<br />
45 years NSW electricity emissions
Estimate <strong>of</strong> CO 2 sequestration potential <strong>of</strong><br />
Queensland coals<br />
• Assuming that<br />
the unmineable<br />
reserves <strong>of</strong> coal<br />
in Queensland<br />
is as much as<br />
the<br />
underground<br />
mineable<br />
reserves<br />
• Seam depths<br />
<strong>of</strong> >700 m<br />
Estimate <strong>of</strong> Qld CO 2 storage potential<br />
Qld coal reserves<br />
Open cut<br />
Underground<br />
CO 2 storage<br />
capacity <strong>of</strong> Qld<br />
coal based on<br />
CSIRO studies<br />
CO 2 potential<br />
38.94<br />
15.91<br />
23.03<br />
40.00<br />
921.20<br />
32.53<br />
1.7<br />
Bt<br />
Bt<br />
Bt<br />
m 3 /t<br />
billion m 3<br />
tcf<br />
billion<br />
tonnes (gt)
Summary (1)<br />
Australia’s CBM Industry is growing as a results <strong>of</strong><br />
depletion in conventional petroleum gas reservoir,<br />
advance in drilling and completion technology, and<br />
better understating <strong>of</strong> the behaviour <strong>of</strong> coal gas<br />
interaction.<br />
Measurement <strong>of</strong> storage and flow properties <strong>of</strong> numerous<br />
<strong>Australian</strong> coals shows that,<br />
CO 2 storage capacity <strong>of</strong> Sydney Basin coal varies from 40 to 80 m 3<br />
per tonne <strong>of</strong> coal.<br />
CH 4 adheres weaker to coal than CO 2, coal capacity for CH 4 is half <strong>of</strong><br />
its capacity for CO 2.<br />
CO 2 diffuses much faster than CH 4 in coal and gas injection rate is<br />
diffusion rate dependent.
Summary (2)<br />
NSW has large resources <strong>of</strong> coal and if only<br />
the deferred coal resources are used for CO 2<br />
sequestration, then up to 4.1 billion tonnes <strong>of</strong><br />
CO 2 can be sequestered in NSW.<br />
If there were as much unmineable coal at<br />
depth <strong>of</strong> 700 m and over in Qld than at current<br />
underground depths then there would be a<br />
capacity <strong>of</strong> 1.7 billion tonnes CO 2 storage in<br />
unmineable coal seams <strong>of</strong> Qld.