environmental setting, water quality, and ecological indicators of
environmental setting, water quality, and ecological indicators of
environmental setting, water quality, and ecological indicators of

Create successful ePaper yourself
Turn your PDF publications into a flip-book with our unique Google optimized e-Paper software.
National Water-Quality Assessment Program<br />
ENVIRONMENTAL SETTING, WATER QUALITY,<br />
AND ECOLOGICAL INDICATORS OF SURFACE-<br />
WATER QUALITY IN THE MERMENTAU RIVER<br />
BASIN, SOUTHWESTERN LOUISIANA, 1998-2001<br />
Water-Resources Investigations Report 03-4185<br />
U.S. Department <strong>of</strong> the Interior<br />
U.S. Geological Survey
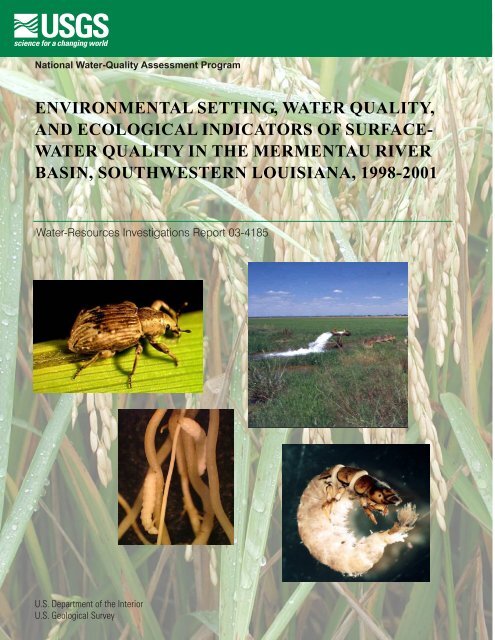
Front cover:<br />
Background: Mature rice plants (Oryza sativa) in the Mermentau River Basin, southwestern<br />
Louisiana<br />
(Photograph by Dennis K. Demcheck, U.S. Geological Survey)<br />
Top left: Rice <strong>water</strong> weevil, adult (Lissorhoptrus oryzophilus) on rice stalk<br />
(Photograph provided by Kelly V. Tindall, Department <strong>of</strong> Entomology, Louisiana State University,<br />
Baton Rouge, Louisiana)<br />
Top right: Ground <strong>water</strong> for rice field irrigation in the Mermentau River Basin, southwestern<br />
Louisiana<br />
(Photograph by Dennis K. Demcheck, U.S. Geological Survey)<br />
Lower left: Rice <strong>water</strong> weevil, larva (Lissorhoptrus oryzophilus) on rice roots<br />
(Photograph provided by Kelly V. Tindall, Department <strong>of</strong> Entomology, Louisiana State University,<br />
Baton Rouge, Louisiana)<br />
Lower right: Hydropsychidae, larva, net-spinning caddisfly<br />
(Photograph provided by Elaine Esteban, Department <strong>of</strong> Biology, California State University,<br />
Chico, California)
Environmental Setting, Water Quality, <strong>and</strong><br />
Ecological Indicators <strong>of</strong> Surface-Water<br />
Quality in the Mermentau River Basin,<br />
Southwestern Louisiana, 1998-2001<br />
By Stanley C. Skrobialowski, Scott V. Mize, <strong>and</strong> Dennis K. Demcheck<br />
U.S. GEOLOGICAL SURVEY<br />
Water-Resources Investigations Report 03-4185<br />
National Water-Quality Assessment Program<br />
Baton Rouge, Louisiana<br />
2004
U.S. DEPARTMENT OF THE INTERIOR<br />
GALE A. NORTON, Secretary<br />
U.S. GEOLOGICAL SURVEY<br />
Charles G. Groat, Director<br />
The use <strong>of</strong> trade, product, industry, or firm names in this report is for descriptive or location purposes only <strong>and</strong> does not constitute<br />
endorsement <strong>of</strong> products by the U.S. Government nor impute responsibility for any present or potential effects on the natural<br />
resources.<br />
For additional information contact: Copies <strong>of</strong> this report can be purchased<br />
from:<br />
District Chief<br />
U.S. Geological Survey U.S. Geological Survey<br />
3535 S. Sherwood Forest Blvd., Suite 120 Branch <strong>of</strong> Information Services<br />
Baton Rouge, LA 70816 Box 25286<br />
E-mail: dc_la@usgs.gov Denver, CO 80225<br />
Fax: (225) 298-5490 E-mail: infoservices@usgs.gov<br />
Telephone: (225) 298-5481 Fax: (303) 202-4693<br />
Home Page: http://la.<strong>water</strong>.usgs.gov Telephone (toll free): 1-888-ASK-USGS<br />
Information regarding the National Water-Quality Assessment (NAWQA) Program is available on<br />
the Internet via the World Wide Web. You may connect to the NAWQA Home Page using the<br />
Universal Resource Locator (URL) at:<br />
http://<strong>water</strong>.usgs.gov/nawqa
FOREWORD<br />
The U.S. Geological Survey (USGS) is committed<br />
to serve the Nation with accurate <strong>and</strong> timely scientific<br />
information that helps enhance <strong>and</strong> protect the<br />
overall <strong>quality</strong> <strong>of</strong> life, <strong>and</strong> facilitates effective management<br />
<strong>of</strong> <strong>water</strong>, biological, energy, <strong>and</strong> mineral<br />
resources. Information on the <strong>quality</strong> <strong>of</strong> the Nation’s<br />
<strong>water</strong> resources is <strong>of</strong> critical interest to the USGS<br />
because it is so integrally linked to the long-term<br />
availability <strong>of</strong> <strong>water</strong> that is clean <strong>and</strong> safe for drinking<br />
<strong>and</strong> recreation <strong>and</strong> that is suitable for industry,<br />
irrigation, <strong>and</strong> habitat for fish <strong>and</strong> wildlife. Escalating<br />
population growth <strong>and</strong> increasing dem<strong>and</strong>s for<br />
the multiple <strong>water</strong> uses make <strong>water</strong> availability, now<br />
measured in terms <strong>of</strong> quantity <strong>and</strong> <strong>quality</strong>, even<br />
more critical to the long-term sustainability <strong>of</strong> our<br />
communities <strong>and</strong> ecosystems.<br />
The USGS implemented the National Water-Quality<br />
Assessment (NAWQA) Program to support<br />
national, regional, <strong>and</strong> local information needs <strong>and</strong><br />
decisions related to <strong>water</strong>-<strong>quality</strong> management <strong>and</strong><br />
policy. Shaped by <strong>and</strong> coordinated with ongoing<br />
efforts <strong>of</strong> other Federal, State, <strong>and</strong> local agencies,<br />
the NAWQA Program is designed to answer: What<br />
is the condition <strong>of</strong> our Nation’s streams <strong>and</strong> ground<br />
<strong>water</strong>? How are the conditions changing over time?<br />
How do natural features <strong>and</strong> human activities affect<br />
the <strong>quality</strong> <strong>of</strong> streams <strong>and</strong> ground <strong>water</strong>, <strong>and</strong> where<br />
are those effects most pronounced? By combining<br />
information on <strong>water</strong> chemistry, physical characteristics,<br />
stream habitat, <strong>and</strong> aquatic life, the NAWQA<br />
Program aims to provide science-based insights for<br />
current <strong>and</strong> emerging <strong>water</strong> issues. NAWQA<br />
results can contribute to informed decisions that<br />
result in practical <strong>and</strong> effective <strong>water</strong>-resource management<br />
<strong>and</strong> strategies that protect <strong>and</strong> restore <strong>water</strong><br />
<strong>quality</strong>.<br />
Since 1991, the NAWQA Program has implemented<br />
interdisciplinary assessments in more than<br />
50 <strong>of</strong> the Nation’s most important river basins <strong>and</strong><br />
aquifers, referred to as Study Units. Collectively,<br />
these Study Units account for more than 60 percent<br />
<strong>of</strong> the overall <strong>water</strong> use <strong>and</strong> population served by<br />
public <strong>water</strong> supply, <strong>and</strong> are representative <strong>of</strong> the<br />
Nation’s major hydrologic l<strong>and</strong>scapes, priority eco-<br />
logical resources, <strong>and</strong> agricultural, urban, <strong>and</strong> natural<br />
sources <strong>of</strong> contamination.<br />
Each assessment is guided by a nationally consistent<br />
study design <strong>and</strong> methods <strong>of</strong> sampling <strong>and</strong> analysis.<br />
The assessments thereby build local<br />
knowledge about <strong>water</strong>-<strong>quality</strong> issues <strong>and</strong> trends in<br />
a particular stream or aquifer while providing an<br />
underst<strong>and</strong>ing <strong>of</strong> how <strong>and</strong> why <strong>water</strong> <strong>quality</strong> varies<br />
regionally <strong>and</strong> nationally. The consistent, multiscale<br />
approach helps to determine if certain types <strong>of</strong><br />
<strong>water</strong>-<strong>quality</strong> issues are isolated or pervasive, <strong>and</strong><br />
allows direct comparisons <strong>of</strong> how human activities<br />
<strong>and</strong> natural processes affect <strong>water</strong> <strong>quality</strong> <strong>and</strong> <strong>ecological</strong><br />
health in the Nation’s diverse geographic <strong>and</strong><br />
<strong>environmental</strong> <strong>setting</strong>s. Comprehensive assessments<br />
on pesticides, nutrients, volatile organic compounds,<br />
trace metals, <strong>and</strong> aquatic ecology are<br />
developed at the national scale through comparative<br />
analysis <strong>of</strong> the Study-Unit findings.<br />
The USGS places high value on the communication<br />
<strong>and</strong> dissemination <strong>of</strong> credible, timely, <strong>and</strong> relevant<br />
science so that the most recent <strong>and</strong> available knowledge<br />
about <strong>water</strong> resources can be applied in management<br />
<strong>and</strong> policy decisions. We hope this<br />
NAWQA publication will provide you the needed<br />
insights <strong>and</strong> information to meet your needs, <strong>and</strong><br />
thereby foster increased awareness <strong>and</strong> involvement<br />
in the protection <strong>and</strong> restoration <strong>of</strong> our<br />
Nation’s <strong>water</strong>s.<br />
The NAWQA Program recognizes that a national<br />
assessment by a single program cannot address all<br />
<strong>water</strong>-resource issues <strong>of</strong> interest. External coordination<br />
at all levels is critical for a fully integrated<br />
underst<strong>and</strong>ing <strong>of</strong> <strong>water</strong>sheds <strong>and</strong> for cost-effective<br />
management, regulation, <strong>and</strong> conservation <strong>of</strong> our<br />
Nation’s <strong>water</strong> resources. The Program, therefore,<br />
depends extensively on the advice, cooperation, <strong>and</strong><br />
information from other Federal, State, interstate,<br />
Tribal, <strong>and</strong> local agencies, non-government organizations,<br />
industry, academia, <strong>and</strong> other stakeholder<br />
groups. The assistance <strong>and</strong> suggestions <strong>of</strong> all are<br />
greatly appreciated.<br />
Robert M. Hirsch<br />
Associate Director for Water
CONTENTS<br />
Foreword ................................................................................................................................................................ iii<br />
Abstract .................................................................................................................................................................. 1<br />
Introduction............................................................................................................................................................ 2<br />
Purpose <strong>and</strong> Scope .......................................................................................................................................... 2<br />
Acknowledgments .......................................................................................................................................... 3<br />
Environmental Setting............................................................................................................................................ 3<br />
L<strong>and</strong> Use ......................................................................................................................................................... 3<br />
Water Availability <strong>and</strong> Use ............................................................................................................................. 9<br />
Hydrology ....................................................................................................................................................... 9<br />
Aquatic Invertebrate Communities................................................................................................................. 12<br />
Data Collection <strong>and</strong> Methods <strong>of</strong> Study .................................................................................................................. 12<br />
Site Selection .................................................................................................................................................. 13<br />
Data Analysis.................................................................................................................................................. 14<br />
Water-Quality Characteristics ................................................................................................................................ 17<br />
Nutrients.......................................................................................................................................................... 18<br />
Major Inorganic Ions <strong>and</strong> Trace Elements...................................................................................................... 24<br />
Pesticides ........................................................................................................................................................ 25<br />
Ecological Indicators <strong>of</strong> Surface-Water Quality .................................................................................................... 29<br />
Comparison <strong>of</strong> Site Groups............................................................................................................................. 30<br />
Study-Design Site Groups ....................................................................................................................... 30<br />
Stream Habitat Characteristics ......................................................................................................... 30<br />
Aquatic Invertebrate Communities................................................................................................... 31<br />
Canonical Correspondence Analysis Site Groups ................................................................................... 34<br />
Water-Quality Characteristics........................................................................................................... 37<br />
Stream Habitat Characteristics ......................................................................................................... 38<br />
Aquatic Invertebrate Communities................................................................................................... 38<br />
Relations Between Species <strong>and</strong> Environmental Variables....................................................................... 41<br />
Summary <strong>and</strong> Conclusions..................................................................................................................................... 41<br />
References Cited .................................................................................................................................................... 44<br />
Appendixes............................................................................................................................................................. 49<br />
1. Complete names for surface-<strong>water</strong> <strong>and</strong> <strong>ecological</strong> data-collection sites in the Mermentau River<br />
Basin <strong>and</strong> adjacent Calcasieu River Basin in southwestern Louisiana, 1998-2001 ........................... 50<br />
2. Pesticides <strong>and</strong> degradation products analyzed, use, <strong>and</strong> occurrence in ground- <strong>and</strong> surface-<strong>water</strong><br />
samples from the Mermentau River Basin, southwestern Louisiana, 1998-2001.............................. 51<br />
3. Concentrations <strong>of</strong> fipronil <strong>and</strong> degradation products in surface <strong>water</strong>, Mermentau River Basin,<br />
southwestern Louisiana, 1999-2001................................................................................................... 54<br />
4. Selected physiochemical properties <strong>and</strong> fipronil concentrations for <strong>ecological</strong> data-collection<br />
sites in southwestern Louisiana, 2001................................................................................................ 60<br />
5. Mean quantitative habitat variables from <strong>ecological</strong> data-collection sites in southwestern<br />
Louisiana, 2001 .................................................................................................................................. 61<br />
6. Classification ranking <strong>of</strong> U.S. Environmental Protection Agency's Rapid Bioassessment<br />
Protocols habitat variables for <strong>ecological</strong> data-collection sites in southwestern Louisiana, 2001..... 63<br />
7. Habitat assessment results using U.S. Environmental Protection Agency's Rapid Bioassessment<br />
Protocols for <strong>ecological</strong> data-collection sites in southwestern Louisiana, 2001................................ 64<br />
8. Taxa <strong>and</strong> densities <strong>of</strong> richest-targeted habitat aquatic invertebrates for <strong>ecological</strong> data-collection<br />
sites in southwestern Louisiana, March-April 2001........................................................................... 65<br />
9. Loadings <strong>of</strong> <strong>environmental</strong> variables on the first two principal components (PC) derived from<br />
principal components analysis (PCA) <strong>of</strong> <strong>ecological</strong> data-collection sites in southwestern<br />
Louisiana, 2001 .................................................................................................................................. 73<br />
v
FIGURES<br />
1-4. Maps showing:<br />
1. Location <strong>of</strong> continuous-discharge surface-<strong>water</strong> sites <strong>and</strong> ground-<strong>water</strong> wells sampled in the<br />
Mermentau River Basin, southwestern Louisiana, 1998-2001.......................................................... 4<br />
2. L<strong>and</strong> use <strong>and</strong> location <strong>of</strong> surface-<strong>water</strong> data-collection sites in the Mermentau River Basin,<br />
southwestern Louisiana, 1998-2001 .................................................................................................. 5<br />
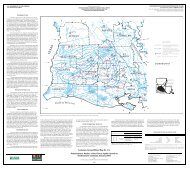
3. L<strong>and</strong> use <strong>and</strong> long-term <strong>water</strong>-<strong>quality</strong> data-collection sites in southwestern Louisiana,<br />
1998-2001 .......................................................................................................................................... 7<br />
4. Soils <strong>and</strong> location <strong>of</strong> surface-<strong>water</strong> data-collection sites in the Mermentau River Basin,<br />
southwestern Louisiana, 1998-2001 .................................................................................................. 8<br />
5. Bar chart showing sources <strong>and</strong> quantities <strong>of</strong> <strong>water</strong> used in the Mermentau River Basin, southwestern<br />
Louisiana, 2000......................................................................................................................................... 10<br />
6. Graph showing discharge for selected sites in the Mermentau River Basin, southwestern Louisiana,<br />
1998-2001 ................................................................................................................................................. 11<br />
7. Flowchart <strong>of</strong> statistical analysis <strong>of</strong> <strong>ecological</strong> data used in the study....................................................... 15<br />
8. Boxplots showing concentrations <strong>of</strong> selected nutrients <strong>and</strong> major inorganic ions in ground <strong>water</strong> <strong>and</strong><br />
surface <strong>water</strong> from the Mermentau River Basin, southwestern Louisiana, 1998-2001 ............................ 21<br />
9. Photograph showing grazing livestock near a surface-<strong>water</strong> data-collection site in the Mermentau<br />
River Basin, southwestern Louisiana ........................................................................................................ 22<br />
10-15. Graphs showing:<br />
10. Concentrations <strong>of</strong> nitrite plus nitrate, potassium, <strong>and</strong> suspended sediment at the Mermentau datacollection<br />
site in the Mermentau River Basin, southwestern Louisiana, 1998-2001......................... 23<br />
11. Drinking-<strong>water</strong> <strong>and</strong> aquatic-life criteria, <strong>and</strong> maximum detected concentrations <strong>of</strong> selected<br />
pesticides in ground <strong>water</strong> in the Mermentau River Basin, southwestern Louisiana, 2000-2001..... 25<br />
12. Drinking-<strong>water</strong> <strong>and</strong> aquatic-life criteria, <strong>and</strong> maximum detected concentrations <strong>of</strong> selected<br />
pesticides in surface <strong>water</strong> in the Mermentau River Basin, southwestern Louisiana, 1998-2001..... 27<br />
13. Concentrations <strong>of</strong> selected pesticides at the Mermentau data-collection site in the Mermentau<br />
River Basin, southwestern Louisiana, 1998-2001 ............................................................................. 28<br />
14. Composition <strong>of</strong> predominant groups <strong>of</strong> aquatic invertebrates at basin <strong>and</strong> intensity site groups<br />
in southwestern Louisiana, 2001........................................................................................................ 33<br />
15. Median abundances <strong>of</strong> aquatic invertebrates, Chironomidae (midges), <strong>and</strong> Tanytarsini midges<br />
at basin <strong>and</strong> intensity site groups in southwestern Louisiana, 2001 .................................................. 33<br />
16. Canonical correspondence analysis (CCA) ordination biplot showing site (A) <strong>and</strong> species (B)<br />
locations in relation to <strong>environmental</strong> variables <strong>of</strong> <strong>ecological</strong> data-collection sites in southwestern<br />
Louisiana, 2001......................................................................................................................................... 35<br />
17. Map showing l<strong>and</strong> use <strong>and</strong> location <strong>of</strong> <strong>ecological</strong> data-collection sites <strong>and</strong> canonical<br />
correspondence analysis (CCA) site groups in southwestern Louisiana, 2001 ........................................ 36<br />
18. Graph showing composition <strong>of</strong> predominant groups <strong>of</strong> aquatic invertebrates at canonical<br />
correspondence analysis (CCA) site groups in southwestern Louisiana, 2001 ........................................ 40<br />
19. Graph showing median abundances <strong>of</strong> aquatic invertebrates, Chironomidae (midges), <strong>and</strong> Tanytarsini<br />
midges at canonical correspondence analysis (CCA) site groups in southwestern Louisiana, 2001........ 40<br />
20. Scatter plots showing relative abundances <strong>of</strong> Caenis sp. (mayfly) <strong>and</strong> Rheotanytarsus sp. (midge),<br />
<strong>and</strong> significant habitat <strong>and</strong> <strong>water</strong>-<strong>quality</strong> variables identified by canonical correspondence<br />
analysis (CCA) for <strong>ecological</strong> data-collection sites in southwestern Louisiana, 2001............................. 42<br />
TABLES<br />
1. Surface-<strong>water</strong> <strong>and</strong> <strong>ecological</strong> data-collection sites in the Mermentau River Basin <strong>and</strong> adjacent Calcasieu<br />
River Basin, southwestern Louisiana, 1998-2001 .......................................................................................... 6<br />
2. Annual mean flow for selected sites in the Mermentau River Basin, 1999-2001, <strong>and</strong> period <strong>of</strong> record........ 11<br />
3. Drinking-<strong>water</strong> regulations, health advisory levels, <strong>and</strong> aquatic-life criteria for selected pesticides............. 16<br />
4. Minimum, median, <strong>and</strong> maximum concentrations <strong>of</strong> selected nitrogen species for ground- <strong>and</strong> surface<strong>water</strong><br />
samples from the Mermentau River Basin, southwestern Louisiana, 1998-2001 ................................ 19<br />
vi
5. Maximum concentrations <strong>and</strong> occurrence <strong>of</strong> selected nutrients in ground <strong>water</strong> <strong>and</strong> surface <strong>water</strong> in the<br />
Mermentau River Basin, southwestern Louisiana, 1998-2001....................................................................... 20<br />
6. Minimum, median, <strong>and</strong> maximum concentrations <strong>of</strong> selected phosphorus species for ground- <strong>and</strong><br />
surface-<strong>water</strong> samples from the Mermentau River Basin, southwestern Louisiana, 1998-2001.................... 20<br />
7. Maximum concentrations <strong>and</strong> occurrence <strong>of</strong> selected major inorganic ions in ground <strong>water</strong> <strong>and</strong> surface<br />
<strong>water</strong> in the Mermentau River Basin, southwestern Louisiana, 1998-2001................................................... 24<br />
8. Median stream habitat variables for study-design site groups in southwestern Louisiana, 2001................... 31<br />
9. Median aquatic invertebrate metrics for basin <strong>and</strong> intensity site groups in southwestern Louisiana, 2001... 32<br />
10. Canonical correlation coefficients <strong>of</strong> <strong>environmental</strong> variables with the first four canonical<br />
correspondence analysis axes for aquatic invertebrates at <strong>ecological</strong> data-collection sites in<br />
southwestern Louisiana, 2001......................................................................................................................... 34<br />
11. Median <strong>water</strong>-<strong>quality</strong> variables for canonical correpondence analysis (CCA) site groups in southwestern<br />
Louisiana, 2001............................................................................................................................................... 37<br />
12. Median stream habitat variables for canonical correpondence analysis (CCA) site groups in southwestern<br />
Louisiana, 2001............................................................................................................................................... 38<br />
13. Median aquatic invertebrate metrics for canonical correpondence analysis (CCA) site groups in<br />
southwestern Louisiana, 2001......................................................................................................................... 39<br />
CONVERSION FACTORS, DATUMS, AND ABBREVIATED WATER-QUALITY UNITS<br />
Multiply By To obtain<br />
inch (in.) 2.54 centimeter (cm)<br />
foot (ft) 0.3048 meter (m)<br />
foot per second (ft/s) 0.3048 meter per second (m/s)<br />
yard (yd) 0.9144 meter (m)<br />
mile (mi) 1.609 kilometer (km)<br />
acre 4,047 square meter (m 2 )<br />
square mile (mi 2 ) 2.590 square kilometer (km 2 )<br />
million gallons per day (Mgal/d) 3, 785 cubic meters per day (m 3 /d)<br />
Temperature in degrees Celsius (°C) can be converted to degrees Fahrenheit (°F) as follows: °F = (1.8 x °C) + 32.<br />
Vertical coordinate information is referenced to the National Geodetic Vertical Datum <strong>of</strong> 1929 (NGVD 29)—a geodetic datum<br />
derived from a general adjustment <strong>of</strong> the first-order level nets <strong>of</strong> both the United States <strong>and</strong> Canada, formerly called Sea Level<br />
Datum <strong>of</strong> 1929.<br />
Horizontal coordinate information is referenced to the North American Datum <strong>of</strong> 1983.<br />
Abbreviated <strong>water</strong>-<strong>quality</strong> units:<br />
micrograms per liter (µg/L)<br />
micrograms per kilogram (µg/kg)<br />
microsiemens per centimeter at 25 degrees Celsius (µS/cm)<br />
milligrams per liter (mg/L)<br />
organisms per square meter (organisms/m 2 )<br />
vii
viii
Environmental Setting, Water Quality, <strong>and</strong><br />
Ecological Indicators <strong>of</strong> Surface-Water<br />
Quality in the Mermentau River Basin,<br />
Southwestern Louisiana, 1998-2001<br />
By Stanley C. Skrobialowski, Scott V. Mize, <strong>and</strong> Dennis K. Demcheck<br />
ABSTRACT<br />
The U.S. Geological Survey collected data from 29<br />
wells <strong>and</strong> 24 surface-<strong>water</strong> sites in the Mermentau River<br />
Basin, 1998-2001, to better underst<strong>and</strong> ground-<strong>water</strong> <strong>and</strong><br />
surface-<strong>water</strong> <strong>quality</strong>; aquatic invertebrate communities;<br />
<strong>and</strong> habitat conditions, in relation to l<strong>and</strong> use. This study<br />
was a part <strong>of</strong> the National Water-Quality Assessment<br />
Program, which was designed to assess <strong>water</strong> <strong>quality</strong> as<br />
it relates to various l<strong>and</strong> uses. Water-<strong>quality</strong> data were<br />
evaluated with criteria established for the protection <strong>of</strong><br />
drinking <strong>water</strong> <strong>and</strong> aquatic life, <strong>and</strong> bed-sediment data<br />
were compared to aquatic-life criteria. Water-<strong>quality</strong> <strong>and</strong><br />
<strong>ecological</strong> data were analyzed statistically in relation to<br />
drainage area <strong>and</strong> agricultural l<strong>and</strong>-use intensity.<br />
Concentrations <strong>of</strong> nutrients <strong>and</strong> major inorganic<br />
ions in ground <strong>water</strong> <strong>and</strong> surface <strong>water</strong> generally were<br />
highest in the southeastern part <strong>of</strong> the study area where<br />
soils contain thick loess deposits. Peak concentrations <strong>of</strong><br />
nutrients in surface <strong>water</strong> occurred March-May at two<br />
sites with high agricultural intensity; the lowest concentrations<br />
occurred August-January. The greatest potential<br />
for eutrophic conditions in surface <strong>water</strong>, based on nutrient<br />
concentrations, existed March-May, at about the<br />
same time or shortly after ricefields were drained. Secondary<br />
Maximum Contaminant Levels established by<br />
the U.S. Environmental Protection Agency (USEPA)<br />
were exceeded for sulfate, chloride, iron, or manganese<br />
in samples from 20 wells, <strong>and</strong> for iron or manganese in<br />
samples from all surface-<strong>water</strong> sites.<br />
Fewer pesticides were detected in ground <strong>water</strong><br />
than in surface <strong>water</strong>. In 11 <strong>of</strong> the 29 wells sampled, at<br />
least one pesticide or pesticide degradation product was<br />
detected. The most frequently detected pesticides or pesticide<br />
degradation products in ground <strong>water</strong> were the herbicides<br />
bentazon <strong>and</strong> atrazine. Concentrations <strong>of</strong> 47<br />
pesticides <strong>and</strong> degradation products were detected in sur-<br />
1<br />
face <strong>water</strong>. At least 3 pesticides were detected in all surface-<strong>water</strong><br />
samples. In 72 percent <strong>of</strong> the samples at least<br />
5 hydrophylic pesticides were detected, <strong>and</strong> in more than<br />
70 percent <strong>of</strong> the samples at least 3 hydrophobic pesticides<br />
were detected. Although atrazine concentrations in<br />
three samples collected in the spring exceeded 3 µg/L<br />
(micrograms per liter), the USEPA Maximum Contaminant<br />
Level <strong>of</strong> 3 µg/L was not exceeded because it is<br />
based on an annual average <strong>of</strong> quarterly samples. Concentrations<br />
larger than 3.0 µg/L were not detected in<br />
samples collected during other times <strong>of</strong> the year. Tebuthiuron<br />
was detected at all surface-<strong>water</strong> sites; the largest<br />
concentration (6.33 µg/L) was detected at a site on<br />
Bayou des Cannes, <strong>and</strong> was the only detection that<br />
exceeded the criterion (1.6 µg/L) for the protection <strong>of</strong><br />
aquatic life. Malathion was detected at 16 surface-<strong>water</strong><br />
sites; the largest concentration (0.113 µg/L) was detected<br />
at a site on Bayou Lacassine, <strong>and</strong> was the only detection<br />
that exceeded the criterion (0.1 µg/L) for the protection<br />
<strong>of</strong> aquatic life. Concentrations <strong>of</strong> fipronil exceeded<br />
numeric targets for acute total maximum daily loads<br />
(2.3 µg/L) at 3 sites <strong>and</strong> chronic total maximum daily<br />
loads (4.6 µg/L) at 14 sites. Maximum pesticide concentrations<br />
in surface <strong>water</strong> usually occurred in the<br />
spring at about the same time or shortly after ricefields<br />
were drained.<br />
Concentrations <strong>of</strong> DDE in bed sediment at two sites<br />
exceeded interim fresh<strong>water</strong> sediment <strong>quality</strong> guidelines<br />
for the protection <strong>of</strong> aquatic life. Fipronil sulfide <strong>and</strong><br />
desulfinylfipronil were detected at all 17 sites from<br />
which bed-sediment samples were collected, but there<br />
are no current (2002) guidelines with which to evaluate<br />
the <strong>environmental</strong> effects <strong>of</strong> fipronil <strong>and</strong> degradation<br />
products.<br />
Two methods were used to group the <strong>ecological</strong><br />
data-collection sites: (1) Sites were grouped before data<br />
collection (according to the study design) using drainage
area <strong>and</strong> agricultural l<strong>and</strong>-use intensity, <strong>and</strong> (2) sites<br />
were grouped statistically after data collection using<br />
canonical correspondence analysis (CCA) <strong>and</strong> classification<br />
(cluster analysis) techniques on surface-<strong>water</strong><br />
<strong>quality</strong>, habitat, <strong>and</strong> aquatic invertebrate data. Aquatic<br />
invertebrate communities were used as <strong>ecological</strong> <strong>indicators</strong><br />
<strong>of</strong> surface-<strong>water</strong> <strong>quality</strong> <strong>and</strong> habitat conditions at<br />
these sites. The CCA identified four significant <strong>environmental</strong><br />
variables (instream cover score, percentage <strong>of</strong><br />
open canopy, concentrations <strong>of</strong> dissolved oxygen, <strong>and</strong><br />
maximum concentrations <strong>of</strong> dissolved fipronil) that<br />
described the distribution <strong>of</strong> aquatic invertebrate communities<br />
among <strong>ecological</strong> data-collection sites. Results<br />
from the CCA were used in a cluster analysis to identify<br />
four site groups that had similar <strong>water</strong> <strong>quality</strong>, habitat,<br />
<strong>and</strong> aquatic invertebrate characteristics. Environmental<br />
variables <strong>and</strong> biological metrics within the study-design<br />
(a priori, before sampling) <strong>and</strong> CCA-assigned (posteriori,<br />
after sampling) site groups were compared.<br />
Median values <strong>of</strong> 17 <strong>water</strong>-<strong>quality</strong> variables were<br />
lowest at sites in the northern part <strong>of</strong> the study area,<br />
where less than 45 percent <strong>of</strong> a drainage area is used for<br />
rice cultivation. Median values <strong>of</strong> 11 <strong>water</strong>-<strong>quality</strong> variables<br />
were highest at sites in the southeastern part <strong>of</strong> the<br />
study area, where the percentage <strong>of</strong> a drainage area used<br />
for rice cultivation varies. Median values <strong>of</strong> turbidity,<br />
<strong>and</strong> concentrations <strong>of</strong> total ammonia plus organic nitrogen,<br />
nitrate, total phosphorus, <strong>and</strong> dissolved fipronil,<br />
were highest at sites in the north-central part <strong>of</strong> the study<br />
area. Possible explanations for the differences in <strong>water</strong><br />
<strong>quality</strong> among <strong>ecological</strong> data-collection sites may be<br />
the differences in (1) general soil composition <strong>and</strong> drainage<br />
characteristics, <strong>and</strong> (2) percentage <strong>of</strong> l<strong>and</strong> used for<br />
agriculture in these basins.<br />
Habitat characteristics including channel size <strong>and</strong><br />
morphology, <strong>water</strong> clarity, open canopy, <strong>and</strong> substrate<br />
differed between streams in the northern <strong>and</strong> southern<br />
parts <strong>of</strong> the study area. Stream habitat ratings were based<br />
on the total <strong>of</strong> 10 habitat parameter scores, using the<br />
Rapid Bioassessment Protocols habitat characterization.<br />
Scores increase as habitat <strong>quality</strong> increases. Ratings<br />
were suboptimal (102-154) to optimal (155-200) for 16<br />
<strong>of</strong> the 19 <strong>ecological</strong> data-collection sites. Three sites<br />
were rated marginal (49-101). Differences in channel<br />
size, bank stability, <strong>and</strong> pool substrate may account for<br />
some differences in aquatic invertebrate communities<br />
between site groups distinguished by agricultural intensity.<br />
Organisms tolerant <strong>of</strong> turbidity, organic enrichment,<br />
<strong>and</strong> low dissolved-oxygen concentrations were common<br />
in the study area <strong>and</strong> dominated the aquatic invertebrate<br />
community. Metrics for aquatic invertebrate communities<br />
were significantly different (p ≤ 0.05) among agri-<br />
2<br />
cultural l<strong>and</strong>-use intensity site groups <strong>and</strong> CCA site<br />
groups in (1) percentage <strong>of</strong> noninsects, (2) abundance <strong>of</strong><br />
midge taxa, (3) abundance <strong>of</strong> feeding groups, <strong>and</strong> (4)<br />
number <strong>of</strong> tolerant organisms. Dominance <strong>and</strong> diversity<br />
metrics were significantly different (p ≤ 0.05) among<br />
CCA site groups. In this report, the maximum concentration<br />
<strong>of</strong> dissolved fipronil was the only significant <strong>environmental</strong><br />
variable related to consistent decreases in<br />
relative abundance <strong>of</strong> many species, notably midges.<br />
Low species abundance in this report was associated with<br />
lower concentrations <strong>of</strong> fipronil degradation products<br />
than <strong>of</strong> the parent compound fipronil.<br />
INTRODUCTION<br />
The National Water-Quality Assessment<br />
(NAWQA) Program is a long-term program <strong>of</strong> the U.S.<br />
Geological Survey (USGS) designed to describe the status<br />
<strong>and</strong> trends in the <strong>quality</strong> <strong>of</strong> the Nation’s surface- <strong>and</strong><br />
ground-<strong>water</strong> resources <strong>and</strong> to provide an underst<strong>and</strong>ing<br />
<strong>of</strong> the natural <strong>and</strong> human factors that can affect the <strong>quality</strong><br />
<strong>of</strong> these resources (Gilliom <strong>and</strong> others, 1995). The<br />
program is interdisciplinary <strong>and</strong> integrates biological,<br />
chemical, <strong>and</strong> physical data to assess the Nation’s <strong>water</strong><br />
<strong>quality</strong> at local, regional, <strong>and</strong> national scales. Assessing<br />
the <strong>quality</strong> <strong>of</strong> <strong>water</strong> in every part <strong>of</strong> the Nation would not<br />
be practical; therefore, NAWQA Program studies are<br />
conducted in a set <strong>of</strong> areas called study units. The Acadian-Pontchartrain<br />
(ACAD) is one such Study Unit, <strong>and</strong><br />
consists <strong>of</strong> all or parts <strong>of</strong> 39 parishes in southern Louisiana<br />
<strong>and</strong> 5 counties in southwestern Mississippi (Demas<br />
<strong>and</strong> others, 1999). The 26,000-mi 2 ACAD Study Unit<br />
includes the Mermentau River Basin, a distinctive agricultural<br />
area in southwestern Louisiana. Water-<strong>quality</strong><br />
<strong>and</strong> <strong>ecological</strong> data are needed to describe interactions<br />
between ground- <strong>and</strong> surface-<strong>water</strong> components <strong>of</strong> the<br />
hydrologic cycle <strong>and</strong> to determine the effects <strong>of</strong> agricultural<br />
l<strong>and</strong> use on <strong>water</strong> <strong>quality</strong> in the Mermentau River<br />
Basin.<br />
Purpose <strong>and</strong> Scope<br />
This report characterizes ground-<strong>water</strong> <strong>and</strong> surface<strong>water</strong><br />
<strong>quality</strong> <strong>and</strong> <strong>ecological</strong> <strong>indicators</strong> (aquatic invertebrate<br />
communities <strong>and</strong> habitat conditions) for selected<br />
sites in the Mermentau River Basin. Bed-sediment <strong>quality</strong><br />
also is characterized at selected sites. The <strong>environmental</strong><br />
<strong>setting</strong>, including agricultural, industrial, <strong>water</strong>availability<br />
<strong>and</strong> use, <strong>and</strong> hydrologic characteristics <strong>of</strong> the<br />
Mermentau River Basin are described. This report (1)<br />
describes the occurrence <strong>and</strong> distribution <strong>of</strong> selected<br />
nutrients, major inorganic ions, trace elements, <strong>and</strong> pesticides<br />
in ground <strong>water</strong> <strong>and</strong> surface <strong>water</strong>, suspended sed-
iment in surface <strong>water</strong>, <strong>and</strong> selected pesticides in bed<br />
sediment; (2) characterizes stream habitat conditions at<br />
selected sites; <strong>and</strong> (3) assesses responses <strong>of</strong> aquatic<br />
invertebrate communities to surface-<strong>water</strong> <strong>quality</strong> <strong>and</strong><br />
habitat conditions among selected sites. This report<br />
relates agricultural intensity (the percentage <strong>of</strong> l<strong>and</strong> used<br />
for rice cultivation) to pesticide concentrations in <strong>water</strong>,<br />
aquatic community composition, <strong>and</strong> stream habitat<br />
characteristics.<br />
The study area encompasses the Mermentau River<br />
Basin. Ground-<strong>water</strong> samples were collected once from<br />
29 wells (19-230 ft deep) in the study area during January<br />
2000-January 2001 (fig. 1). Surface-<strong>water</strong> samples<br />
were collected from 3 sites during November 1998-September<br />
1999; 17 sites during October 1999-September<br />
2000; <strong>and</strong> 18 sites during October 2000-September 2001<br />
(fig. 2, table 1). Ecological (habitat <strong>and</strong> aquatic invertebrate)<br />
data were collected in 2001 for 18 surface-<strong>water</strong><br />
sites in the Mermentau River Basin <strong>and</strong> an additional site<br />
in the adjacent Calcasieu River Basin (fig. 3, table 1).<br />
Data from the additional site were used for comparison<br />
only, <strong>and</strong> the site was not intended to represent <strong>water</strong><br />
<strong>quality</strong> in the Calcasieu River Basin. The additional site<br />
was used to compare conditions at a relatively undisturbed<br />
site with those at the agricultural sites in the Mermentau<br />
River Basin. The Calcasieu River Basin site was<br />
the best approximation to a large-basin, low agriculturalintensity<br />
site that was available. There were few suitable<br />
sites in the Mermentau River Basin with large basins <strong>and</strong><br />
low agricultural intensity for comparison. Bed-sediment<br />
samples were collected under low-flow conditions from<br />
17 surface-<strong>water</strong> sites August-September 2000. Streamhabitat<br />
characteristics were documented <strong>and</strong> aquatic<br />
invertebrate samples were collected March-April 2001<br />
for all 19 surface-<strong>water</strong> sites sampled in 2001.<br />
Acknowledgments<br />
The authors thank Keith Fontenot, Ronnie Levy,<br />
<strong>and</strong> Eddie Eskew <strong>of</strong> the Louisiana Cooperative Extension<br />
Service, Louisiana State University Agricultural<br />
Center for their cooperation in evaluating the extent <strong>of</strong><br />
rice cultivation in the Mermentau River Basin. The<br />
authors also thank the many owners <strong>of</strong> domestic wells for<br />
allowing access to their property <strong>and</strong> wells. Appreciation<br />
is extended to the following USGS employees:<br />
Stephen D. Porter <strong>and</strong> Lawrence R. Deweese for project<br />
development <strong>and</strong> support <strong>and</strong> critical study design<br />
review; Thomas F. Cuffney for reviewing the design <strong>of</strong><br />
the study; Patricia J. D’Arconte for assistance with GIS<br />
support; Stephen D. Porter, Lawrence R. Deweese, Jeffrey<br />
A. Brantly, Van G. Bergeron, C. Paul Frederick,<br />
Kevin J. Grimsley, Cindy G. Sibley, Lane B. Simmons,<br />
3<br />
<strong>and</strong> William B. Snee for assistance in data collection; <strong>and</strong><br />
Stephen D. Porter, Lawrence R. DeWeese, Douglas A.<br />
Harned, <strong>and</strong> Thomas F. Cuffney for providing critical<br />
reviews that improved the <strong>quality</strong> <strong>of</strong> the report.<br />
ENVIRONMENTAL SETTING<br />
The Mermentau River Basin is located in the Western<br />
Gulf Coastal Plains ecoregion <strong>of</strong> southwestern Louisiana<br />
(Omernik, 1987). The area also is called coastal<br />
prairie or wet prairie (Brown, 1972). Historically, the<br />
area was a tallgrass prairie similar in many ways to the<br />
tallgrass prairie in the midwestern United States (Allain<br />
<strong>and</strong> others, 2000).<br />
Soils in the Mermentau River Basin (fig. 4) consist<br />
<strong>of</strong> a thick loess in the eastern part <strong>of</strong> the study area<br />
(fig. 4), the area most used for soybean production<br />
(fig. 2). Most <strong>of</strong> the central <strong>and</strong> southern parts <strong>of</strong> the<br />
basin, however, consist <strong>of</strong> clayey <strong>and</strong> loamy alluvial<br />
deposits which are ideally suited for rice cultivation.<br />
Rice cultivation within the last 100 years has caused<br />
leaching <strong>of</strong> salts <strong>and</strong> fine clays to form a hardpan underlying<br />
ricefields (Lovelace, 1999). Alluvial soils in the<br />
northwestern part <strong>of</strong> the basin contain more silt <strong>and</strong> s<strong>and</strong><br />
<strong>and</strong> consist <strong>of</strong> loamy <strong>and</strong> silty deposits <strong>and</strong> loamy fluvial<br />
deposits than other parts <strong>of</strong> the basin. The streambed<br />
substrate in the tributaries <strong>and</strong> main channel <strong>of</strong> the Mermentau<br />
River is silt or clay. The substrate in the mainstem<br />
<strong>and</strong> smaller tributaries also can be a s<strong>of</strong>t flocculent<br />
muck rich in organic matter.<br />
The area drained by the upper Calcasieu River<br />
Basin (fig. 3) is located in the Western Gulf Coastal<br />
Plains ecoregion, is primarily forested, <strong>and</strong> has geomorphic<br />
features <strong>and</strong> hydrology typical <strong>of</strong> an upl<strong>and</strong> basin.<br />
The streams drain an area <strong>of</strong> rolling pine hills with s<strong>and</strong>y<br />
soils. Ground-<strong>water</strong> contributions to the stream during<br />
the late summer result in orange-red iron oxide coatings<br />
on the s<strong>and</strong>y substrate.<br />
L<strong>and</strong> Use<br />
Most l<strong>and</strong> in the Mermentau River Basin has been<br />
altered for agricultural crops such as rice, soybeans, <strong>and</strong><br />
sugarcane, <strong>and</strong> for pasture (fig. 3). Other l<strong>and</strong> uses<br />
include crawfish farming <strong>and</strong> oil <strong>and</strong> gas exploration <strong>and</strong><br />
production. The northwestern part <strong>of</strong> the basin is mostly<br />
forested <strong>and</strong> l<strong>and</strong> in the remainder <strong>of</strong> the basin is used<br />
predominantly for rice agriculture.<br />
Forest consisting <strong>of</strong> mixed pine-hardwoods in the<br />
upper basin changes to <strong>water</strong> tupelo <strong>and</strong> cypress riparian<br />
zones as the l<strong>and</strong> flattens toward the lower basin. The<br />
mid-to-lower reaches <strong>of</strong> the Mermentau River are bordered<br />
by a <strong>water</strong> tupelo <strong>and</strong> cypress riparian zone that
4<br />
30° 30´<br />
30° 00´<br />
93° 00´<br />
VERNON<br />
9<br />
7<br />
12<br />
35<br />
ALLEN<br />
Calcasieu JEFFERSO N<br />
DAVIS Bayou LACASSINE<br />
Lacassine CAMERON River 36<br />
24<br />
RAPIDES 1<br />
21<br />
15<br />
6<br />
Bayou MERMENTAU<br />
Mermentau R i v er<br />
55<br />
Bayou 10<br />
92° 30´<br />
Nezpique 4<br />
38<br />
14<br />
57<br />
53<br />
13<br />
Can es<br />
sed n<br />
Bayou 22<br />
34<br />
EVANEG LINE<br />
BAYOU NEZPIQUE<br />
NEAR BASILE<br />
ACADIA Bayou 2<br />
DES CANNES<br />
19 49<br />
e<br />
u<br />
q<br />
a<br />
l<br />
P<br />
25<br />
23<br />
d e Queue T u<br />
Figure 1. Continuous-discharge surface-<strong>water</strong> sites <strong>and</strong> ground-<strong>water</strong> wells sampled in the Mermentau<br />
River Basin, southwestern Louisiana, 1998-2001.<br />
e<br />
n<br />
i<br />
m<br />
8<br />
17<br />
ue<br />
Br l<br />
VERMILION AVOYELLES 16<br />
ort e<br />
41<br />
92° 00´<br />
S TLANDRY<br />
LAFAYETTE<br />
Vermilion Map credi t: Modifie d from Official M ap <strong>of</strong> Louisiana, Departmen t o f Transportatio n <strong>and</strong> Developme nt , 1986<br />
er<br />
Riv<br />
0<br />
DES CANNES<br />
17<br />
Texas<br />
Mermentau River Basin boundary<br />
Arkansas<br />
Louisiana<br />
EXPLANATION Continuous-discharge site <strong>and</strong> site<br />
name (see table 1, appendix 1)<br />
Well <strong>and</strong> well number<br />
0 30 KILOMETERS<br />
Index Map<br />
Mississippi Mermenta u River Basin<br />
30<br />
MILES
5<br />
3 0° 3 0´<br />
3 0° 00´<br />
93° 00´<br />
VERNON<br />
EAST<br />
LACASSINE<br />
ALLEN<br />
Calcasieu JEFFERSO N<br />
DAVIS Bayou LACASSINE<br />
Lacassine CAMERON River RAPIDES CANEY<br />
CASTOR<br />
BLUE<br />
ROANOKE<br />
CHENE<br />
Mermentau 92° 30´<br />
BOGGY<br />
NEZPIQUE<br />
GUIDRY<br />
DES CANNES<br />
PANCHOVILLE<br />
Bayou R i v er<br />
Bayou Nezpique LAKE ARTHUR<br />
EVANEG LINE<br />
IOTA<br />
ACADIA Bayou sed n<br />
MALLET<br />
CHURCH POINT<br />
PLAQUEMINE<br />
MERMENTAU<br />
RICEVILLE<br />
Bayou Can es<br />
UPPER<br />
DES CANNES<br />
TORTUE<br />
WIKOFF<br />
THERIOT<br />
GRAND<br />
MARAIS<br />
92° 00´<br />
Map credit : Modified from Official Map <strong>of</strong> Louisiana, Departmen t o f Transportat ion <strong>and</strong> Development, 1986<br />
e<br />
u<br />
q<br />
a<br />
l<br />
P<br />
e<br />
n<br />
i<br />
m<br />
ue<br />
Que<br />
ue<br />
Br l<br />
VERMILION ort e<br />
de T u<br />
AVOYELLES S TLANDRY<br />
Mermentau River Basin boundary<br />
Texas<br />
EXPLANATION<br />
Forest<br />
Rice<br />
Urban<br />
Soybean<br />
Water<br />
Data-collection site <strong>and</strong> site name<br />
(see table 1, appendix 1)<br />
Arkansas<br />
Louisiana<br />
Index Map<br />
Mississippi Mermentau River<br />
Basin<br />
Figure 2. L<strong>and</strong> use <strong>and</strong> location <strong>of</strong> surface-<strong>water</strong> data-collection sites in the Mermentau River Basin, southwestern Louisiana,<br />
1998-2001.<br />
LAFAYETTE<br />
Vermilion er<br />
Riv<br />
0<br />
WIKOFF<br />
L<strong>and</strong>-use data<br />
(source: Josep h Holmes, Louisian a<br />
Department <strong>of</strong> Environme ntal Qualit y,<br />
wri tten commun., 2001)<br />
0 30 KILOMETERS<br />
30<br />
MILES
Table 1. Surface-<strong>water</strong> <strong>and</strong> <strong>ecological</strong> data-collection sites in the Mermentau River Basin <strong>and</strong> adjacent Calcasieu<br />
River Basin, southwestern Louisiana, 1998-2001<br />
[Basin size: A drainage area greater than or equal to 70 square miles represents a large basin, <strong>and</strong> a drainage area smaller than 70 square miles<br />
represents a small basin. Agricultural l<strong>and</strong>-use intensity: A basin in which the l<strong>and</strong> used for rice cultivation is at least 45 percent <strong>of</strong> the drainage<br />
area is considered high agricultural intensity, <strong>and</strong> less than 45 percent is considered low agricultural intensity. All sites are short-term except sites<br />
1, 7, 11, <strong>and</strong> 25, which are long-term. X, sampled]<br />
Site<br />
number<br />
(fig. 2)<br />
Abbreviated site<br />
name 1<br />
U.S. Geological<br />
Survey station<br />
number<br />
Drainage<br />
area<br />
(square<br />
miles)<br />
1 Complete site name is listed in appendix 1.<br />
2 Water-<strong>quality</strong> samples only.<br />
3 Water-<strong>quality</strong> <strong>and</strong> bed-sediment samples, except as noted.<br />
4 Water-<strong>quality</strong> <strong>and</strong> <strong>ecological</strong> samples <strong>and</strong> data.<br />
5 Estimated value.<br />
6 Shown in figure 3.<br />
6<br />
Basin<br />
size<br />
Drainage<br />
area used<br />
for rice<br />
(percent)<br />
Agricultural<br />
l<strong>and</strong>-use<br />
intensity<br />
2 Nov.<br />
1998-<br />
Sept.<br />
1999<br />
Sampling period<br />
3 Oct.<br />
1999-<br />
Sept.<br />
2000<br />
Mermentau River Basin<br />
1 Des Cannes 08010000 142 Large 95 High X X X<br />
2 Wik<strong>of</strong>f 08010500 63 Small 54 High X X<br />
3 Plaquemine 08011020 320 Large 64.7 High X X<br />
4 Boggy 08011500 65 Small 0 Low X<br />
5 Castor 08011800 33 Small 42.4 Low X<br />
6 Nezpique 08011860 166 Large 21.7 Low X X<br />
7 Mermentau 08012150 1,381 Large 66.5 High X X X<br />
8 Riceville 08012300 236 Large 76.3 High X<br />
9 Lake Arthur 08012400 1,702 Large 69 High X<br />
10 Chene 08012447 100 Large 97 High X<br />
11 Lacassine 08012470 296 Large 89.5 High X X X<br />
12 Tortue 300446092214200 97 Large 74.2 High X X<br />
13 Gr<strong>and</strong> Marais 300514092173500 26 Small 38.5 Low X<br />
14 Theriot 301154092145900 37 Small 62.2 High X<br />
15 East Lacassine 301520092491800 15 Small 100 High X X<br />
16 Roanoke 301538092421900 56 Small 100 High X<br />
17 Iota 301959092323400 333 Large 50 High X<br />
18 Panchoville 302128092373800 550 Large 45 High X<br />
19 Church Point 302403092152300 74 Large 25.7 Low X X<br />
20 Mallet 302749092203500 91 Large 86.8 High X X<br />
21 Guidry 303206092360000 381 Large 36.6 Low X X<br />
22 Blue 303209092401800 80 Large 53.8 High X<br />
23 Upper Des Cannes 303755092190400 46 Small 91.3 High X<br />
24 Caney 304130092344100 18 Small 0 Low X<br />
Calcasieu River Basin (additional site)<br />
625 Whisky 08014500 504 Large 58 Low X 2X X<br />
4 Oct.<br />
2000-<br />
Sept.<br />
2001
7<br />
3 0° 00´<br />
30° 30´<br />
L<br />
SABINE AKE<br />
31° 00´<br />
93° 30´<br />
Housot n<br />
CALCASIEU River CALCASIEU KLAE<br />
Calcasieu 93° 00´<br />
Cac l ase i u<br />
Whisky Chitto<br />
BEAUREGARD VERNON Creek 25<br />
ver<br />
Ri<br />
CAMERON Lower Mud<br />
Lake GULF OF MEXICO Mermentau Map credit: Modified from Offi cial Map <strong>of</strong> Louisiana, Department <strong>of</strong> Transportatio n an d Development, 1986<br />
Bayou 11<br />
Lacassine River<br />
ALLEN JEFFERSO N<br />
DAVIS RAPIDES GRAND<br />
LAKE ay u<br />
B o<br />
Jennings<br />
Catfish<br />
Point<br />
River Bayou 92° 30´<br />
Nezpique sde<br />
7<br />
EVANGELINE 1<br />
Bayou WHITE LAKE<br />
s<br />
Canne<br />
ACADIA Bayou Plaquemine de Queue Brule Tortue<br />
92° 00´<br />
River<br />
Vermlo ii n<br />
VERMILION BAY<br />
ATCHAFALAYA Bayou RIVER<br />
Teche WEST COTE<br />
BLAN CHE BAY<br />
Figure 3. L<strong>and</strong> use <strong>and</strong> long-term <strong>water</strong>-<strong>quality</strong> data-collection sites in southwestern Louisiana, 1998-2001.<br />
G<br />
u<br />
l r<br />
f t<br />
I<br />
AVOYELLES n<br />
a<br />
ST LANDRY LAFAYETTE c<br />
oas<br />
tal<br />
ST. MARTIN VERMLO I I N<br />
IBERIA Wa<br />
terw y a<br />
0<br />
EXPLANATION<br />
L<strong>and</strong>-use data (sou rce : Joseph Holm es , Louisiana<br />
Dep artment o f Environmental Quality, written commu n., 2001) 11<br />
Texas<br />
Rice<br />
Soybean<br />
Sugarcane<br />
Cotton<br />
Urban<br />
Pasture Forest<br />
Wildlife preserve<br />
Marsh<br />
Water<br />
Aquaculture<br />
Basin boundary<br />
Study area boundary<br />
Long-ter m data-collection site<br />
<strong>and</strong> number (se e tabl e 1)<br />
Arkansas<br />
Louisiana<br />
Calcasieu River<br />
Basin<br />
Index Map<br />
30<br />
0 30 KILOMETERS MILES<br />
ACAD Study<br />
Unit boundary<br />
Mississippi Mermentau River<br />
Basin
8<br />
30° 00´ 30 ° 30´<br />
93° 00´<br />
VERNON<br />
EAST<br />
LACASSINE<br />
ALLEN<br />
Calcasieu JEFFERSO N<br />
DAVIS Bayou LACASSINE<br />
Lacassine CAMERON River RAPIDES CANEY<br />
CASTOR<br />
BLUE<br />
92° 30´<br />
Bayou BOGGY<br />
NEZPIQUE<br />
GUIDRY<br />
DES CANNES<br />
PANCHOVILLE<br />
IOTA<br />
MALLET<br />
e<br />
u<br />
q<br />
a<br />
l<br />
P<br />
e<br />
n<br />
i<br />
m<br />
ue<br />
Br l<br />
CHURCH POINT<br />
ROANOKE PLAQUEMINE<br />
CHENE<br />
Mermentau Bayou R i v er<br />
Bayou Nezpique LAKE ARTHUR<br />
EVANEG LINE<br />
sed n<br />
ACADIA MERMENTAU<br />
RICEVILLE<br />
Bayou Can es<br />
UPPER<br />
DES CANNES<br />
TORTUE<br />
WIKOFF<br />
THERIOT<br />
GRAND<br />
MARAIS<br />
S TLANDRY<br />
92° 00´<br />
M ap credit: Modifie d from Official M ap o f Louisiana, Departmen t <strong>of</strong> Transportatio n <strong>and</strong> Developme nt , 1986<br />
rt<br />
Queue e d To ue<br />
VERMILION AVOYELLES Texas<br />
EXPLANATION Clayey <strong>and</strong> loamy alluvial deposits<br />
Loamy <strong>and</strong> clayey alluvial <strong>and</strong> outwash<br />
deposits<br />
Loamy fluvial deposits<br />
Fresh organic <strong>and</strong> mineral deposits<br />
Thick loess deposits<br />
Loamy <strong>and</strong> silty deposits<br />
Mermentau River Basin boundary<br />
Arkansas<br />
Louisiana<br />
Index Map<br />
Mississippi Mermentau River Basin<br />
Figure 4. Soils <strong>and</strong> location <strong>of</strong> surface-<strong>water</strong> data-collection sites in the Mermentau River Basin, southwestern Louisiana 1998-2001.<br />
LAFAYETTE<br />
Vermilion er<br />
Riv<br />
0<br />
WIKOFF<br />
Soils data<br />
(source: Touchet <strong>and</strong> others, 1974)<br />
Water<br />
Data-collection site <strong>and</strong> site name<br />
(see table 1, appendix 1)<br />
0 30 KILOMETERS<br />
30<br />
MILES
typically is flooded more than half <strong>of</strong> the year. Banks<br />
along the tributaries generally are low with <strong>water</strong> tupelo<br />
<strong>and</strong> cypress extending into the streams. Along parts <strong>of</strong><br />
the lower reaches, banks are not discernible as the <strong>water</strong><br />
extends into a bottoml<strong>and</strong> hardwood flood plain. In<br />
places, the flood plain abruptly ends at ricefield levees or<br />
roadways.<br />
Rice is the most important agricultural crop produced<br />
in the basin. Total rice acreage in the seven parishes<br />
(Acadia, Allen, Evangeline, Jefferson Davis,<br />
Lafayette, St. L<strong>and</strong>ry, <strong>and</strong> Vermilion) <strong>of</strong> the Mermentau<br />
River Basin was almost 400,000 acres in 1998 <strong>and</strong> about<br />
340,000 acres in 2000 (Louisiana Cooperative Extension<br />
Service, 1998, 2000). Soybeans are rotated periodically<br />
with rice in the basin, but areas where this occurs are<br />
shown only as rice acreage in figure 3 because rice is the<br />
most frequently cultivated crop. Although sugarcane is<br />
grown in the southwestern part <strong>of</strong> the basin, the acreage<br />
is too small <strong>and</strong> scattered to be delineated in figure 3.<br />
Rice cultivation practices in the Mermentau River<br />
Basin use substantial amounts <strong>of</strong> ground <strong>water</strong> <strong>and</strong> surface<br />
<strong>water</strong>. Aerial application <strong>of</strong> seed on flooded fields<br />
is the predominant method <strong>of</strong> planting rice in the basin.<br />
The flooding <strong>of</strong> ricefields also suppresses red rice, a wild<br />
variety with no commercial value, <strong>and</strong> allows crawfish<br />
farming in the ricefields (Linscombe <strong>and</strong> others, 1999).<br />
After the aerial seeding <strong>of</strong> rice, the <strong>water</strong> is retained on<br />
the field for about 1 to 2 days <strong>and</strong> released. The field is<br />
allowed to drain only long enough for the young seedlings<br />
to become anchored, about 3 to 5 days. Releases <strong>of</strong><br />
ricefield <strong>water</strong> (called tail<strong>water</strong>) into the streams result in<br />
very high turbidities during March through May. The<br />
field is then reflooded until the rice nears maturity. Rice<br />
typically is harvested in July <strong>and</strong> August. A second rice<br />
crop may be harvested in September <strong>and</strong> October from<br />
volunteers <strong>of</strong> the first harvest, depending on prices <strong>and</strong><br />
the climate for the particular year.<br />
About 30,000-40,000 acres in the Mermentau River<br />
Basin were used for crawfish farming in 2000. Two species<br />
are grown commercially, the red swamp crawfish<br />
<strong>and</strong> the white river crawfish. There are two basic methods<br />
for growing crawfish: permanent ponds <strong>and</strong> rotational<br />
ponds. Permanent ponds are dedicated solely for<br />
the production <strong>of</strong> crawfish <strong>and</strong> generally are located east<br />
<strong>of</strong> the Mermentau River Basin. Rotational ponds are the<br />
most common method <strong>of</strong> crawfish production in the<br />
basin. In this aquacultural practice rice <strong>and</strong> crawfish are<br />
double-cropped annually. Typically, rice is planted in<br />
March <strong>and</strong> April. L<strong>and</strong> is reflooded <strong>and</strong>, by June, the<br />
flooded fields are stocked with crawfish. Rice is harvested<br />
by August, l<strong>and</strong> is reflooded in October, <strong>and</strong> craw-<br />
9<br />
fish are harvested in November through April (Avery <strong>and</strong><br />
Lorio, 1999).<br />
The primary industry affecting <strong>water</strong> <strong>quality</strong> in the<br />
Mermentau River Basin is oil <strong>and</strong> gas exploration <strong>and</strong><br />
production (Demas <strong>and</strong> others, 1999). The first oil well<br />
in Louisiana was drilled near Jennings, Louisiana, in<br />
September 1901, soon after the first great gusher in<br />
America, at Spindletop, Texas, in January 1901 (Spearing,<br />
1995). Since then, oil <strong>and</strong> gas production facilities<br />
<strong>and</strong> their associated pipelines have become major <strong>and</strong><br />
conspicuous features <strong>of</strong> the l<strong>and</strong>scape <strong>of</strong> the area. Most<br />
facilities are quite small, occupying only a few acres or<br />
less. Although oil <strong>and</strong> gas production from the fields in<br />
the basin is declining, wells, pipelines, <strong>and</strong> oil <strong>and</strong> gas<br />
production <strong>and</strong> distribution facilities are located throughout<br />
the area. Individual oil wells among rice fields are<br />
separated from the fields by low earthen berms.<br />
Water Availability <strong>and</strong> Use<br />
Ground <strong>water</strong> <strong>and</strong> surface <strong>water</strong> are used for rice<br />
cultivation <strong>and</strong> crawfish farming in the Mermentau River<br />
Basin (fig. 5). Rice farmers in the southern part <strong>of</strong> the<br />
basin rely on surface <strong>water</strong> for irrigation, whereas farmers<br />
in the northern part <strong>of</strong> the basin rely on ground <strong>water</strong>.<br />
The 540 Mgal/d combined ground- <strong>and</strong> surface-<strong>water</strong><br />
withdrawals for rice irrigation in 2000 was 87 percent <strong>of</strong><br />
the total <strong>water</strong> used in the basin (B.P. Sargent, U.S. Geological<br />
Survey, written commun., 2002). More than 80<br />
percent <strong>of</strong> the <strong>water</strong> used for rice irrigation was from<br />
ground-<strong>water</strong> sources in the Chicot aquifer system.<br />
A drought occurred throughout southwestern Louisiana<br />
in 1998-2000. May 1998 was one <strong>of</strong> the driest<br />
Mays in more than 100 years. The drought was classified<br />
as mild in 1998 <strong>and</strong> intensified to severe conditions during<br />
the latter half <strong>of</strong> 1999. Conditions further intensified<br />
to extreme through October 2000, then subsided in<br />
November 2000, one <strong>of</strong> the wettest Novembers on record<br />
(John M. Grymes, III, Louisiana State Climatologist,<br />
written commun., 2002). The drought caused rice farmers<br />
to use more ground <strong>water</strong> or forego planting.<br />
Hydrology<br />
The Mermentau River Basin has a drainage area <strong>of</strong><br />
about 3,800 mi 2 (Sloss, 1971), <strong>and</strong> includes most <strong>of</strong> a<br />
seven-parish area (fig. 3). The Mermentau River begins<br />
at the confluence <strong>of</strong> three major tributaries: Bayou Nezpique,<br />
Bayou des Cannes, <strong>and</strong> Bayou Plaquemine Brule<br />
(fig. 1). Downstream from the confluence, Bayou<br />
Lacassine enters the Mermentau River from the west,
QUANTITY, IN MILLION GALLONS PER DAY<br />
500<br />
450<br />
400<br />
350<br />
300<br />
250<br />
200<br />
150<br />
100<br />
50<br />
0<br />
Aquaculture<br />
Ground Water<br />
Aquaculture<br />
Surface Water<br />
Rice Irrigation<br />
Ground Water<br />
Figure 5. Sources <strong>and</strong> quantities <strong>of</strong> <strong>water</strong> used in the Mermentau River Basin, southwestern Louisiana, 2000.<br />
<strong>and</strong> Bayou Queue de Tortue enters the river from the east.<br />
The five bayous divide the Mermentau River Basin into<br />
a series <strong>of</strong> broad, flat areas ideal for agriculture. These<br />
areas are separated by bottoml<strong>and</strong> hardwood riparian<br />
corridors that vary in width from only a hundred feet to<br />
several miles. L<strong>and</strong>-surface elevations are less than<br />
100 ft above NGVD 29 in most <strong>of</strong> the basin <strong>and</strong> less than<br />
25 ft above NGVD 29 along the Mermentau River mainstem.<br />
Thus, the Mermentau River Basin is characterized<br />
by a low gradient <strong>and</strong> dendritic river system that drains<br />
to the Gulf <strong>of</strong> Mexico.<br />
Hydrology in the Mermentau River Basin is complicated<br />
by the extensive use <strong>of</strong> ground <strong>water</strong> for irrigation<br />
<strong>and</strong> by modifications for agriculture <strong>and</strong> navigation.<br />
Water used to flood ricefields may enter the Chicot aquifer<br />
system, be reused downstream for agriculture, or<br />
drain to the Gulf <strong>of</strong> Mexico. During the study described<br />
in this report, a dam was constructed upstream from one<br />
<strong>of</strong> the long-term surface-<strong>water</strong> sites, Des Cannes,<br />
because a train derailed <strong>and</strong> spilled chemicals (National<br />
Transportation Safety Board, 2002). Modifications <strong>of</strong><br />
streams for navigation <strong>and</strong> <strong>water</strong>-control structures are<br />
common in the basin.<br />
The Mermentau River Basin is characterized by<br />
free-flowing streams in the north. The low gradient <strong>and</strong><br />
low topographic relief in the southern part <strong>of</strong> the basin<br />
create both bidirectional (downstream <strong>and</strong> upstream) <strong>and</strong><br />
interbasin flow, with <strong>water</strong> velocities typically less than<br />
10<br />
Rice Irrigation<br />
Surface Water<br />
WATER-USE CATEGORY AND SOURCE OF WATER<br />
Public Supply<br />
Ground Water<br />
1 ft/s. The river is tidally affected, <strong>and</strong> most upstream<br />
(negative) flow occurs in the summer <strong>and</strong> fall. Negative<br />
flow can be caused by natural events such as storms <strong>and</strong><br />
sustained winds from the south in conjunction with<br />
unusually high tides. These negative flows can be<br />
increased in magnitude <strong>and</strong> duration during low-discharge<br />
periods, such as occurred during the drought <strong>of</strong><br />
1999-2000 (fig. 6). Pumping <strong>of</strong> surface <strong>water</strong> for irrigation<br />
may cause bidirectional flow, but typically only in<br />
the smaller tributaries.<br />
The naturally low gradient <strong>and</strong> human-made canals<br />
<strong>and</strong> <strong>water</strong>ways allow interbasin flows. The primary flow<br />
route is the Gulf Intracoastal Waterway (GIWW), constructed<br />
in 1940 (fig. 3). The GIWW crosses the Mermentau<br />
River north <strong>of</strong> Gr<strong>and</strong> Lake <strong>and</strong> is a major route<br />
for east-west barge traffic along the Gulf Coast. A complex<br />
series <strong>of</strong> gates <strong>and</strong> locks is operated by the U.S.<br />
Army Corps <strong>of</strong> Engineers (USACE) to manage the<br />
<strong>water</strong>way. The GIWW hydraulically connects the Mermentau<br />
River Basin with the Calcasieu River Basin to the<br />
west <strong>and</strong> the Teche-Vermilion Basin to the east.<br />
In the 1970’s, the natural mouth <strong>of</strong> the Mermentau<br />
River was bypassed with the construction <strong>of</strong> a separate<br />
4.6-mi navigation channel from Lower Mud Lake to the<br />
Gulf <strong>of</strong> Mexico. This navigation channel, the GIWW,<br />
<strong>and</strong> other hydrologic modifications throughout southwestern<br />
Louisiana are managed by numerous <strong>water</strong>-control<br />
structures. One such structure on the Mermentau
DISCHARGE, IN CUBIC FEET PER SECOND<br />
20,000 20000<br />
15,000 15000<br />
10,000 10000<br />
5,000 5000<br />
0<br />
Oct. 1<br />
Nov. 2<br />
Dec. 4<br />
Jan. 5<br />
Feb. 6<br />
Mar. 10<br />
Apr. 11<br />
May 13<br />
June 14<br />
July 16<br />
Aug. 17<br />
-5,000 -5000<br />
10/1/1998<br />
12/12/1998<br />
2/22/1999<br />
5/5/1999<br />
7/16/1999<br />
Oct. 20<br />
Nov. 21<br />
Dec. 23<br />
9/26/1999<br />
12/7/1999<br />
2/17/2000<br />
River south <strong>of</strong> Gr<strong>and</strong> Lake at Catfish Point. The purposes<br />
<strong>of</strong> the gated control structure are to reduce northward<br />
movement <strong>of</strong> salt<strong>water</strong> <strong>and</strong> to maintain a sufficient<br />
fresh<strong>water</strong> stage for farmers, especially rice farmers, in<br />
the Mermentau River Basin. The USACE maintains the<br />
stage on the mainstem <strong>of</strong> the Mermentau River at about<br />
2 ft above NGVD 1929 (Steven Schinetsky, U.S. Army<br />
Corps <strong>of</strong> Engineers, oral commun., 2002), sometimes by<br />
closing the control structure at Catfish Point. The river<br />
upstream from Catfish Point appears to cease flowing<br />
during periods <strong>of</strong> closure.<br />
On May 27, 2000, a train with 17 cars <strong>of</strong> hazardous<br />
materials <strong>and</strong> residues derailed about 0.5 mi upstream<br />
from Des Cannes <strong>and</strong> 2 mi west <strong>of</strong> Eunice, Louisiana<br />
(National Transportation Safety Board, 2002). The<br />
derailment resulted in the release <strong>of</strong> hazardous materials<br />
to a ditch <strong>and</strong> pond draining to Bayou des Cannes. No<br />
chemicals spilled directly into the bayou. Because an<br />
earthen dam was constructed about 100 yd upstream<br />
from the Des Cannes site, streamflow data from nearby<br />
Bayou Nezpique near Basile (a continuous-discharge site<br />
only) were used to augment streamflow data from the<br />
Des Cannes site (fig. 1). Continuous streamflow data are<br />
available from four sites in the Mermentau River<br />
Basin—Bayou Nezpique near Basile, Des Cannes,<br />
Lacassine, <strong>and</strong> Mermentau (fig. 1). Annual streamflow<br />
Mermentau River at Mermentau<br />
Bayou Lacassine Lacassine nr Lake Arthur<br />
Bayou Des Cannes des Cannes near Eunice<br />
DROUGHT PERIOD<br />
1998 1999 2000 2001<br />
DATE<br />
[Negative discharge indicates reverse flow.]<br />
Sept. 18<br />
Mar. 28<br />
Apr. 29<br />
May 31<br />
June<br />
July 2<br />
Aug. 3<br />
Sept. 4<br />
Oct. 6<br />
Nov. 7<br />
Dec. 9<br />
Jan. 10<br />
Feb. 11<br />
Mar. 15<br />
Apr. 16<br />
May 18<br />
June 19<br />
July 21<br />
Aug. 22<br />
Jan. 24<br />
Feb. 25<br />
Figure 6. Discharge for selected sites in the Mermentau River Basin, southwestern Louisiana, 1998-2001.<br />
4/29/2000<br />
11<br />
7/10/2000<br />
9/20/2000<br />
12/1/2000<br />
2/11/2001<br />
4/24/2001<br />
7/5/2001<br />
9/15/2001<br />
Sept. 23<br />
data are available only for Bayou Nezpique near Basile,<br />
<strong>and</strong> Des Cannes (table 2). Streamflow is bidirectional at<br />
Lacassine <strong>and</strong> Mermentau <strong>and</strong> these sites lack sufficient<br />
data to determine annual streamflow statistics.<br />
Table 2. Annual mean flow for selected sites in the<br />
Mermentau River Basin, 1999-2001, <strong>and</strong> period <strong>of</strong><br />
record<br />
Site name<br />
Annual mean flow<br />
(cubic feet per second)<br />
1999 2000 2001<br />
Period <strong>of</strong><br />
record,<br />
1939-<br />
2001<br />
Des Cannes 201 79.4 322 275<br />
Bayou Nezpique<br />
near Basile<br />
651 169 801 833<br />
A combination <strong>of</strong> ground <strong>water</strong> <strong>and</strong> surface <strong>water</strong> is<br />
used for agriculture <strong>and</strong> aquaculture. Because <strong>of</strong> the<br />
hardpan clay layer underlying the ricefields, a substantial<br />
amount <strong>of</strong> tail<strong>water</strong> enters surface <strong>water</strong> as run<strong>of</strong>f. It<br />
then may be pumped from a <strong>water</strong>way to irrigate another<br />
field or used for aquaculture farther downstream. Thus,
aquatic life is exposed to both ground <strong>water</strong> <strong>and</strong> surface<br />
<strong>water</strong>. Also, tidal effects <strong>and</strong> bidirectional flows preclude<br />
the use <strong>of</strong> stage-discharge relations to calculate<br />
streamflow at all but the most upstream sites. The<br />
bidirectional-discharge hydrographs from the Mermentau<br />
<strong>and</strong> Lacassine sites define specific hydrologic conditions<br />
only at those two locations. They are useful in<br />
describing the overall hydrologic conditions in the basin,<br />
but cannot provide information such as loads that can be<br />
used for management decisions. For these reasons the<br />
integrated assessment for this study <strong>of</strong> surface-<strong>water</strong><br />
<strong>quality</strong>, ground-<strong>water</strong> <strong>quality</strong>, bed-sediment <strong>quality</strong>, <strong>and</strong><br />
<strong>ecological</strong> <strong>indicators</strong> is restricted to approximately<br />
2,000 mi 2 <strong>of</strong> the Mermentau River Basin north <strong>of</strong> the<br />
Lake Arthur <strong>and</strong> Lacassine sites.<br />
Aquatic Invertebrate Communities<br />
The most important factors influencing the occurrence<br />
<strong>and</strong> distribution <strong>of</strong> aquatic invertebrates are stream<br />
velocity, <strong>water</strong> temperature, dissolved substances, <strong>and</strong><br />
substrate (Hynes, 2001). Because <strong>of</strong> low <strong>water</strong> velocities,<br />
elevated <strong>water</strong> temperatures, <strong>and</strong> soil types <strong>of</strong> the<br />
Mermentau River Basin, an aquatic environment that is<br />
not conducive to a diverse aquatic invertebrate community<br />
is expected. Snags provide a firm substrate <strong>and</strong><br />
opportunities for colonization <strong>of</strong>ten lacking in the clays<br />
<strong>and</strong> mucks <strong>of</strong> the streambed <strong>and</strong> banks. Snags also allow<br />
aquatic invertebrates to move closer to the <strong>water</strong> surface<br />
during periods <strong>of</strong> low dissolved-oxygen concentrations<br />
<strong>and</strong> high turbidities. These populations typically include<br />
the larvae <strong>of</strong> chironomid midges, snails, amphipod crustaceans,<br />
<strong>and</strong> worms. DeWalt (1997), in a study designed<br />
to locate <strong>and</strong> characterize wadeable reference streams in<br />
this basin, noted that low dissolved-oxygen concentrations<br />
significantly distinguish this area from other Louisiana<br />
lowl<strong>and</strong>s.<br />
The Mermentau River Basin, especially in the midto-lower<br />
reaches, typically supports dense growth <strong>of</strong><br />
exotic macrophyte (aquatic plant) species. Among these<br />
are <strong>water</strong> hyacinth (Eichhornia crassipes), alligator<br />
weed (Alternanthera philoxeroides), <strong>and</strong> <strong>water</strong> spangle<br />
(Salvinia minima). During mild winters these macrophytes<br />
may not experience a complete dieback <strong>and</strong> may<br />
cover the <strong>water</strong> surface, reducing light penetration <strong>and</strong><br />
lowering dissolved-oxygen concentrations. These<br />
plants, however, provide extensive habitat for aquatic<br />
invertebrates. Amphipod crustaceans in particular can be<br />
found in abundance among the root systems <strong>of</strong> <strong>water</strong><br />
hyacinth.<br />
Naturally occurring habitat conditions in the basin<br />
favor an aquatic invertebrate community tolerant <strong>of</strong> turbidity,<br />
organic enrichment, <strong>and</strong> low dissolved-oxygen<br />
12<br />
conditions. The net effect <strong>of</strong> these natural <strong>environmental</strong><br />
stressors is to produce a biological community that is, at<br />
first examination, indicative <strong>of</strong> streams that have been<br />
adversely affected by human activities. However, what<br />
may appear to be a degraded or depauperate biological<br />
assemblage may in fact be a healthy community where<br />
multiple <strong>environmental</strong> stressors limit diversity <strong>and</strong> sensitive<br />
taxa.<br />
DATA COLLECTION AND METHODS OF<br />
STUDY<br />
Ground-<strong>water</strong> sample collection was consistent<br />
with national goals for the ground-<strong>water</strong> component <strong>of</strong><br />
the NAWQA program (Leahy <strong>and</strong> others, 1990). Samples<br />
were collected from wells drilled specifically for the<br />
NAWQA program <strong>and</strong> from existing domestic wells that<br />
met specific criteria. Surface-<strong>water</strong> samples were collected<br />
from 24 long- <strong>and</strong> short-term sites with varied<br />
agricultural intensity in the Mermentau River Basin.<br />
These sites are referred to in this report by the site names<br />
listed in table 1. Long-term sites were sampled to characterize<br />
temporal <strong>and</strong> spatial <strong>water</strong>-<strong>quality</strong> conditions,<br />
<strong>and</strong> short-term sites were sampled to characterize <strong>water</strong><br />
<strong>quality</strong> during the spring months.<br />
Water samples from wells <strong>and</strong> surface-<strong>water</strong> sites<br />
were collected for the analysis <strong>of</strong> nutrients, major inorganic<br />
ions, trace elements, <strong>and</strong> pesticides; samples from<br />
surface-<strong>water</strong> sites also were analyzed for suspended<br />
sediment. Water samples were collected from 29 wells<br />
(fig. 1). The wells were sampled once during the period<br />
January 2000-January 2001, <strong>and</strong> the well depths ranged<br />
from 19 to 230 ft. Surface-<strong>water</strong> samples were collected<br />
at 25 sites (24 sites in the Mermentau River Basin <strong>and</strong><br />
one additional site in the Calcasieu River Basin) during<br />
the period <strong>of</strong> sample collection for the study described in<br />
this report. Bed-sediment samples were collected at 17<br />
sites (table 1) during low-flow conditions August-September<br />
2000. Aquatic invertebrate samples <strong>and</strong> stream<br />
habitat data were collected at 18 sites in the Mermentau<br />
River Basin <strong>and</strong> at one additional site in the Calcasieu<br />
River Basin during March-April 2001.<br />
Procedures used to collect <strong>and</strong> process <strong>water</strong> samples<br />
followed st<strong>and</strong>ard USGS guidelines <strong>and</strong> are<br />
described by U.S. Geological Survey (1997 to present),<br />
Shelton (1994), Gilliom <strong>and</strong> others (1995), Mueller <strong>and</strong><br />
others (1997), <strong>and</strong> Koterba <strong>and</strong> others (1995). Water<br />
samples were analyzed at the USGS National Water<br />
Quality Laboratory (NWQL) in Denver, Colo., using<br />
methods described by Fishman <strong>and</strong> Friedman (1989),<br />
S<strong>and</strong>strom <strong>and</strong> others (1992), S<strong>and</strong>strom (1995), Zaugg
<strong>and</strong> others (1995), <strong>and</strong> Madsen <strong>and</strong> others (2003).<br />
Water-<strong>quality</strong> samples were analyzed for a special group<br />
<strong>of</strong> pesticides using a new method that was approved by<br />
the USGS Office <strong>of</strong> Water Quality in April 2001 (app. 2<br />
<strong>and</strong> 3) (Furlong <strong>and</strong> others, 2001). Although this analytical<br />
method did not change following approval, data<br />
analyzed before method approval are considered provisional.<br />
Samples analyzed with this method <strong>and</strong> data used<br />
for analysis in this report were collected after January<br />
2000 but before April 2001; therefore, the data are provisional.<br />
Ground-<strong>water</strong> <strong>quality</strong> data are available in<br />
reports by Tollett <strong>and</strong> Fendick (2004) <strong>and</strong> Tollett <strong>and</strong> others<br />
(2003). Surface-<strong>water</strong> <strong>quality</strong> data are available in<br />
Goree <strong>and</strong> others (2000, 2001, <strong>and</strong> 2002) <strong>and</strong> in appendixes<br />
2 <strong>and</strong> 3.<br />
Turbidity was measured at the USGS Laboratory in<br />
Baton Rouge, La., using a turbidimeter according to<br />
methods described by the manufacturer (Hach Company,<br />
1999). Water clarity was estimated as a function <strong>of</strong> light<br />
extinction with depth in the <strong>water</strong> column. The euphotic<br />
zone depth (Moulton <strong>and</strong> others, 2002) <strong>and</strong> Secchi depth<br />
(Wetzel <strong>and</strong> Likens, 1991) measurements were used to<br />
estimate <strong>water</strong> clarity at <strong>ecological</strong> data-collection sites.<br />
Subsamples <strong>of</strong> bed sediment (table 1) were collected<br />
with fluoropolymer tubes <strong>and</strong> spatulas at wadeable<br />
sites <strong>and</strong> with a fluoropolymer-coated Petite-Ponar<br />
dredge suspended from a bridge or boat at non-wadeable<br />
sites. At each site, the top layer (0.5 to 0.75 in. deep) <strong>of</strong><br />
each subsample was retained <strong>and</strong> composited in a container<br />
with other subsamples. Methods used to process<br />
bed-sediment samples are described by Shelton <strong>and</strong><br />
Capel (1994). Analytical methods used by the NWQL<br />
for the determination <strong>of</strong> pesticides in bed sediment are<br />
described by Foreman <strong>and</strong> others (1995). Bed-sediment<br />
data are available in Goree <strong>and</strong> others (2001).<br />
Stream habitat characteristics were documented at<br />
the time <strong>of</strong> aquatic invertebrate sampling. Habitat<br />
assessment included a combination <strong>of</strong> qualitative rankings<br />
<strong>and</strong> quantitative measurements. The qualitative<br />
rankings were determined by characterizing instream<br />
habitat measures such as substrate, sediment deposition,<br />
channel flow, <strong>and</strong> channel alterations, <strong>and</strong> riparian-zone<br />
features at the site, consistent with U.S. Environmental<br />
Protection Agency (USEPA) Rapid Bioassessment Protocols<br />
(RBP) for low-gradient streams (Barbour <strong>and</strong><br />
others, 1999). Ten stream habitat parameters were<br />
scored on a scale <strong>of</strong> 0 to 20 (highest) for each sampling<br />
reach. Scores increase as habitat <strong>quality</strong> increases. A<br />
total score for each site was used to obtain a final stream<br />
habitat rating. Quantitative assessment <strong>of</strong> physical habitat<br />
conditions at the site included measurements <strong>of</strong><br />
instream characteristics (such as stream width, depth,<br />
flow, turbidity, <strong>and</strong> bed-sediment particle-size distribu-<br />
13<br />
tions) <strong>and</strong> riparian characteristics (such as bank structure,<br />
riparian vegetation, <strong>and</strong> canopy cover) at three<br />
equally spaced transects in the sampling reach. The<br />
quantitative measurements <strong>of</strong> habitat conditions are<br />
described by Fitzpatrick <strong>and</strong> others (1998).<br />
Aquatic invertebrate community surveys are one <strong>of</strong><br />
the few means <strong>of</strong> directly assessing the biological integrity<br />
<strong>of</strong> a site <strong>and</strong> defining a group <strong>of</strong> aquatic organisms<br />
sensitive to changes in <strong>water</strong> chemistry <strong>and</strong> physical habitat<br />
(Meador <strong>and</strong> Gurtz, 1994). The aquatic health <strong>of</strong><br />
stream reaches can be characterized by evaluating the<br />
results <strong>of</strong> qualitative <strong>and</strong> quantitative measurements <strong>of</strong><br />
the aquatic invertebrate community. Results <strong>of</strong> aquatic<br />
invertebrate surveys were used to characterize the distribution<br />
<strong>and</strong> community structure <strong>of</strong> aquatic invertebrate<br />
species <strong>and</strong> their relation to the <strong>quality</strong> <strong>of</strong> both <strong>water</strong> <strong>and</strong><br />
bed sediment. The species composition <strong>and</strong> community<br />
structure <strong>of</strong> aquatic invertebrates respond to <strong>and</strong> indicate<br />
physical <strong>and</strong> chemical conditions present in a stream for<br />
time scales ranging from months to years (Cuffney <strong>and</strong><br />
others, 1993).<br />
Aquatic invertebrate samples were collected at<br />
19 sites (March-April 2001) <strong>and</strong> analyzed as <strong>indicators</strong><br />
<strong>of</strong> <strong>water</strong> <strong>quality</strong> to assess the influence <strong>of</strong> drainage area<br />
<strong>and</strong> agricultural l<strong>and</strong>-use intensity on aquatic health.<br />
Samples from instream submerged woody debris (snags)<br />
in the stream reach were collected to represent the taxonomically<br />
richest-targeted habitat areas in accordance<br />
with USGS NAWQA Protocols (Cuffney <strong>and</strong> others,<br />
1993). The Biology Unit <strong>of</strong> the USGS NWQL used<br />
methods described by Moulton <strong>and</strong> others (2000) for the<br />
identification <strong>and</strong> enumeration <strong>of</strong> invertebrate samples.<br />
Site Selection<br />
Water-<strong>quality</strong> data were collected from 29 wells<br />
(fig. 1) <strong>and</strong> 25 surface-<strong>water</strong> sites; aquatic invertebrate<br />
samples were collected <strong>and</strong> habitat characteristics were<br />
documented for 19 surface-<strong>water</strong> sites. Tollett <strong>and</strong> Fendick<br />
(2004) <strong>and</strong> Tollett <strong>and</strong> others (2003) described well<br />
site selection <strong>and</strong> installation.<br />
The study included 24 surface-<strong>water</strong> sites in the<br />
Mermentau River Basin (fig. 2, table 1) <strong>and</strong>, because no<br />
suitable reference site was available in the Mermentau<br />
River Basin, an additional site in the adjacent Calcasieu<br />
River Basin (fig. 3, table 1). The additional site is considered<br />
to be influenced minimally by agricultural practices,<br />
<strong>and</strong> to represent natural physical, chemical, <strong>and</strong><br />
<strong>ecological</strong> characteristics for areas evaluated in this<br />
report. Surface-<strong>water</strong> data collection occurred in three<br />
overlapping phases during the study (table 1). Three<br />
sites were selected to characterize the effects <strong>of</strong> l<strong>and</strong> use<br />
on <strong>water</strong> <strong>quality</strong> over time (long-term sites). These sites
were sampled monthly November 1998-September 2001<br />
<strong>and</strong> semimonthly February-June 1999 <strong>and</strong> 2000. Fourteen<br />
short-term sites were selected to characterize the<br />
occurrence <strong>and</strong> distribution <strong>of</strong> l<strong>and</strong>-use effects on <strong>water</strong><br />
<strong>quality</strong> in the basin. These sites were sampled monthly<br />
February-June 2000. Nineteen sites were selected to<br />
compare <strong>water</strong>-<strong>quality</strong> characteristics with drainage area<br />
<strong>and</strong> agricultural l<strong>and</strong>-use intensity March-May 2001.<br />
These included the 3 long-term sites in the Mermentau<br />
River Basin, 1 long-term reference site in the Calcasieu<br />
River Basin, 8 <strong>of</strong> the short-term sites sampled in 2000,<br />
<strong>and</strong> 7 additional short-term sites. Bed-sediment samples<br />
were collected once at 17 surface-<strong>water</strong> sites during lowflow<br />
conditions August-September 2000.<br />
Two methods were used to group sites. Nineteen<br />
<strong>ecological</strong> data-collection sites were grouped before data<br />
collection according to the study design based on drainage<br />
area <strong>and</strong> agricultural intensity <strong>and</strong> grouped statistically<br />
after data collection using ordination (CCA) <strong>and</strong><br />
classification (cluster analysis) techniques on surface<strong>water</strong><br />
<strong>quality</strong>, habitat, <strong>and</strong> aquatic invertebrate data<br />
(table 1, fig. 7). Drainage areas greater than or equal to<br />
70 mi 2 were considered large basins <strong>and</strong> those smaller<br />
than 70 mi 2 were considered small basins. Sites were<br />
selected to represent <strong>water</strong>-<strong>quality</strong> conditions influenced<br />
by differences in agricultural intensity as indicated by the<br />
percentage <strong>of</strong> the basin used for rice cultivation. In this<br />
report, the term “high-intensity” describes an area where<br />
at least 45 percent <strong>of</strong> the drainage area is used for rice<br />
cultivation; “low-intensity” is used to describe an area<br />
where less than 45 percent <strong>of</strong> the drainage area is used<br />
for rice cultivation. A Geographic Information Systems<br />
(GIS) coverage was used to determine basin areas<br />
(Joseph Holmes, Louisiana Department <strong>of</strong> Environmental<br />
Quality, written commun., 2001). Rice areas also<br />
were determined from this GIS coverage <strong>and</strong> verified by<br />
county agricultural agents within parishes in the basin.<br />
Data Analysis<br />
Concentrations <strong>of</strong> nutrients, major inorganic ions,<br />
trace elements, <strong>and</strong> pesticides were evaluated in relation<br />
to l<strong>and</strong> use <strong>and</strong> to national drinking-<strong>water</strong> regulations or<br />
criteria. Concentrations in ground <strong>water</strong> were compared<br />
with those in surface <strong>water</strong>. Nutrients, major inorganic<br />
ions, <strong>and</strong> trace elements were detected frequently in both<br />
ground <strong>water</strong> <strong>and</strong> surface <strong>water</strong> <strong>and</strong> are discussed<br />
concurrently. Maximum pesticide concentrations are<br />
compared to available aquatic-life criteria, <strong>and</strong> concentrations<br />
for one insecticide, fipronil, are compared to<br />
numeric targets for total maximum daily loads (TMDL’s)<br />
established by USEPA (2002b). Pesticides were detected<br />
14<br />
infrequently in ground <strong>water</strong> <strong>and</strong>, other than in general<br />
terms, are discussed separately from those in surface<br />
<strong>water</strong>.<br />
Primary <strong>and</strong> Secondary Drinking Water Regulations<br />
(U.S. Environmental Protection Agency, 2000a)<br />
were used to evaluate concentrations <strong>of</strong> nitrate <strong>and</strong><br />
selected major inorganic ions, as shown below.<br />
Constituent Concentration<br />
Drinking Water<br />
Regulation<br />
Nitrate 10 mg/L MCL 1<br />
Chloride 250 mg/L SMCL 2<br />
Sulfate 250 mg/L SMCL 2<br />
Iron 300 µg/L SMCL 2<br />
Manganese 50 µg/L SMCL 2<br />
1 Maximum Contaminant Level.<br />
2 Secondary Maximum Contaminant Level.<br />
Primary Drinking Water Regulations <strong>and</strong> health<br />
advisories were used to evaluate concentrations <strong>of</strong> pesticides<br />
(table 3). Primary <strong>and</strong> Secondary Drinking Water<br />
Regulations <strong>and</strong> health advisory levels were established<br />
by USEPA (2000a) <strong>and</strong> include the following:<br />
1. Enforceable Maximum Contaminant Levels<br />
(MCL’s), established to protect public health<br />
by limiting the levels <strong>of</strong> contaminants in<br />
drinking <strong>water</strong>;<br />
2. Nonenforceable Secondary Maximum<br />
Contaminant Levels (SMCL’s), available for<br />
some nutrients <strong>and</strong> major inorganic ions,<br />
established to limit cosmetic (such as skin or<br />
tooth discoloration) or aesthetic (such as<br />
taste, odor, or color) effects in drinking <strong>water</strong>;<br />
<strong>and</strong><br />
3. Nonenforceable health advisory (HA) levels,<br />
established to avoid adverse noncarcinogenic<br />
effects for a lifetime <strong>of</strong> exposure.<br />
Aquatic-life criteria for pesticides in fresh<strong>water</strong><br />
include USEPA <strong>water</strong>-<strong>quality</strong> criteria (2002a), USEPA<br />
TMDL’s (2002b), <strong>and</strong> Canadian <strong>water</strong>-<strong>quality</strong> guidelines<br />
for the protection <strong>of</strong> aquatic life (Canadian Council <strong>of</strong><br />
Ministers <strong>of</strong> the Environment, 2001) (table 3). These<br />
criteria are based on single-chemical toxicity tests <strong>and</strong> do<br />
not consider synergistic or antagonistic effects <strong>of</strong> pesticide<br />
mixtures. Criteria from USEPA (2002a) are<br />
estimates <strong>of</strong> the highest concentration to which an<br />
aquatic community can be exposed indefinitely without
15<br />
GROUPING OF ECOLOGICAL DATA-COLLECTION SITES FOR STATISTICAL ANALYSIS<br />
(n is number <strong>of</strong> samples)<br />
Basin site groups<br />
(based on drainage area)<br />
(n = 19)<br />
Drainage<br />
area ≥ 70<br />
square miles<br />
Large<br />
(n = 11)<br />
a priori groups<br />
(grouping before sampling <strong>and</strong> analysis)<br />
Study-design site groups<br />
(n = 19)<br />
Drainage<br />
area < 70<br />
square miles<br />
Small<br />
(n = 8)<br />
Intensity site groups<br />
(based on agricultural l<strong>and</strong> use)<br />
(n = 19)<br />
≥ 45 percent<br />
rice cultivation<br />
High<br />
(n = 11)<br />
< 45 percent<br />
rice cultivation<br />
Low<br />
(n = 8)<br />
Principal<br />
components<br />
analysis (PCA)<br />
(Environmental variables)<br />
(n = 19)<br />
posteriori groups<br />
(grouping after sampling <strong>and</strong> analysis<br />
Water-<strong>quality</strong><br />
<strong>and</strong> habitat<br />
data<br />
Aquatic<br />
invertebrate<br />
data<br />
Detrended<br />
correspondence<br />
analysis (DCA)<br />
(Species variables)<br />
(n = 19)<br />
Canonical correspondence analysis (CCA) site groups<br />
(based on <strong>environmental</strong> <strong>and</strong> species variables)<br />
(n = 19)<br />
Group A<br />
(n = 3)<br />
Group assignments based on cluster analysis results<br />
Group B<br />
(n = 4)<br />
Group C<br />
(n = 6)<br />
Group D<br />
(n = 6)<br />
Figure 7. Flowchart <strong>of</strong> statistical analysis <strong>of</strong> <strong>ecological</strong> data used in the study. Median values <strong>of</strong> the basin <strong>and</strong> intensity site groups (blue text) were tested for<br />
significant differences (p ≤ 0.05) using a two-factor analysis <strong>of</strong> variance (Wilkinson <strong>and</strong> Coward, 1998) on ranked data (Helsel <strong>and</strong> Hirsch, 1992), <strong>and</strong> canonical<br />
correspondence analysis site groups (green text) were tested for significant differences (p ≤ 0.05) using a one-factor analysis <strong>of</strong> variance (Kruskal-Wallis test) on<br />
ranked data (Wilkinson, 1998).
Table 3. Drinking-<strong>water</strong> regulations, health advisory levels, <strong>and</strong> aquatic-life criteria for selected pesticides<br />
[Concentrations are in micrograms per liter. USEPA, U.S. Environmental Protection Agency; MCL, Maximum Contaminant Level; HA, health<br />
advisory; *, based on an annual mean <strong>of</strong> quarterly samples; --, none; CCME, Canadian Council <strong>of</strong> Ministers <strong>of</strong> the Environment]<br />
USEPA drinking-<strong>water</strong> MCL or HA 1 Aquatic-life criteria<br />
Compound<br />
Criterion Type <strong>of</strong> st<strong>and</strong>ard Criterion Source<br />
Alachlor 2 MCL -- --<br />
Atrazine *3 MCL 1.8 CCME2 Bentazon 200 HA -- --<br />
Bromacil 90 HA 5 CCME2 Carbaryl 700 HA .2 CCME 2<br />
Carb<strong>of</strong>uran 40 MCL 1.8 CCME 2<br />
Chlorpyrifos 20 HA .041<br />
3, 4<br />
USEPA<br />
Cyanazine 1 HA 2 CCME 2<br />
2,4-D 70 MCL -- --<br />
Dacthal (DCPA) 70 HA -- --<br />
Diazinon 0.6 HA -- --<br />
Dinoseb 7 MCL .05 CCME2 Diphenamid 200 HA -- --<br />
Diuron 10 HA -- --<br />
Fipronil (chronic) -- -- 2.3 USEPA5 Fipronil (acute) -- -- 4.6 USEPA 5<br />
Fluometuron 90 HA -- --<br />
Malathion 100 HA .1 USEPA3, 4<br />
MCPA 4 HA -- --<br />
Methomyl 200 HA -- --<br />
Methyl Parathion 2 HA -- --<br />
Metolachlor 100 HA 7.8 CCME2 Metribuzin 200 HA 1 CCME 2<br />
Picloram 500 MCL 29 CCME 2<br />
Prometon 100 HA -- --<br />
Propachlor 90 HA -- --<br />
Simazine 4 MCL 10 CCME2 Tebuthiuron 500 HA 1.6 CCME2 Trifluralin 5 HA .2 CCME 2<br />
1 U.S. Environmental Protection Agency (2000a).<br />
2 Canadian Council <strong>of</strong> Ministers <strong>of</strong> the Environment (2001).<br />
3 U.S. Environmental Protection Agency (2002a).<br />
4 The USEPA aquatic-life criteria for malathion <strong>and</strong> chlorpyrifos are maximum concentrations to which an aquatic organism can be exposed<br />
without harmful effects, <strong>and</strong> should not be exceeded more than once every 3 years.<br />
5<br />
U.S. Environmental Protection Agency (2002b).<br />
resulting in an unacceptable effect. Numeric targets for<br />
chronic <strong>and</strong> acute TMDL’s for fipronil were established<br />
primarily for fish <strong>and</strong> wildlife propagation (U.S. Environmental<br />
Protection Agency, 2002b). Acute numeric<br />
targets apply to stream mixing zones, areas defined by<br />
the Louisiana Department <strong>of</strong> Environmental Quality<br />
(2003) as “portions <strong>of</strong> <strong>water</strong> bodies where effluent <strong>water</strong>s<br />
are dispersed into receiving <strong>water</strong>s.” Chronic numeric<br />
targets apply to portions <strong>of</strong> the <strong>water</strong> body outside mix-<br />
16<br />
ing zones. Canadian <strong>water</strong>-<strong>quality</strong> guidelines for 12 pesticides<br />
were established to protect species <strong>of</strong> aquatic life.<br />
Ecological data were summarized <strong>and</strong> compared<br />
with surface-<strong>water</strong> <strong>quality</strong> data. Water <strong>quality</strong> (app. 4),<br />
quantitative habitat (app. 5) <strong>and</strong> qualitative habitat data<br />
(app. 6 <strong>and</strong> 7) used for the statistical analyses are<br />
included in this report. When appropriate, log <strong>and</strong><br />
square-root transformations <strong>of</strong> <strong>water</strong>-<strong>quality</strong> <strong>and</strong> habitat<br />
data <strong>and</strong> natural log transformations <strong>of</strong> aquatic inverte-
ate data (app. 8) were performed to approximate normal<br />
distributions.<br />
The mean values <strong>of</strong> quantitative habitat variables<br />
for the site (reach) were used for analysis <strong>of</strong> habitat data,<br />
except euphotic <strong>and</strong> Secchi-disk depths, which were<br />
measured once for the reach. Ranked <strong>and</strong> scored values<br />
were used for bank-erosion score <strong>and</strong> bank-stability<br />
index variables so these variables could be statistically<br />
analyzed. Each reach was ranked in the same way with<br />
a score from 1 to 6 that represented the number <strong>of</strong><br />
observed stream banks with erosion at six transect points<br />
within the reach. The bank-stability index was determined<br />
as described in Fitzpatrick <strong>and</strong> others (1998).<br />
Aquatic invertebrate community data were processed<br />
using the Invertebrate Data Analysis System<br />
(IDAS, version 2.0.6) a program developed by Thomas<br />
Cuffney (USGS, written commun., 2001) for the compilation<br />
<strong>and</strong> analysis <strong>of</strong> NAWQA invertebrate samples.<br />
Ambiguous taxa were resolved using IDAS by combining<br />
the abundance <strong>of</strong> children (species or genus) <strong>of</strong><br />
ambiguous parents <strong>and</strong> adding abundance to the parent<br />
(genus or family). Invertebrate taxa in the dataset that<br />
were difficult or impossible to identify, terrestrial adults,<br />
<strong>and</strong> rare taxa (occurring at only one site) were eliminated<br />
from the final analysis. Aquatic invertebrate community<br />
metrics were calculated in IDAS <strong>and</strong> statistically analyzed<br />
based on this processed dataset.<br />
Exploratory analysis <strong>of</strong> <strong>environmental</strong> variables—<br />
<strong>water</strong>-<strong>quality</strong> <strong>and</strong> habitat data—(fig. 7) was performed<br />
using principal component analysis (PCA) to reduce the<br />
number <strong>of</strong> <strong>environmental</strong> variables (ter Braak <strong>and</strong> Smilauer,<br />
1998). Redundant variables were removed from<br />
subsequent analyses <strong>and</strong> surrogate variables were identified<br />
to represent a group <strong>of</strong> correlated variables.<br />
Results <strong>of</strong> a correspondence analysis (CA) <strong>of</strong> the aquatic<br />
invertebrate data (ter Braak <strong>and</strong> Smilauer, 1998) showed<br />
an arch effect with sites <strong>and</strong> species grouped along the<br />
x- <strong>and</strong> y-axes, which warranted use <strong>of</strong> detrended correspondence<br />
analysis (DCA) to examine distributions <strong>of</strong><br />
aquatic invertebrate communities (Jongman <strong>and</strong> others,<br />
1995). Distributions <strong>of</strong> aquatic invertebrate communities<br />
at five or more sites (38 species) were investigated by<br />
DCA.<br />
Direct gradient analysis was performed using<br />
canonical correspondence analysis (CCA) (fig. 7) to<br />
evaluate patterns among sites based on the relative abundance<br />
<strong>of</strong> aquatic invertebrates <strong>and</strong> on <strong>environmental</strong><br />
variables (ter Braak <strong>and</strong> Smilauer, 1998). The CCA was<br />
used to establish similarity between sites based on study<br />
results <strong>and</strong> to identify important <strong>environmental</strong> variables<br />
that influenced aquatic invertebrate communities. The<br />
CCA included 36 <strong>environmental</strong> variables determined by<br />
PCA to be important from 19 sites. This determination<br />
17<br />
was based on (1) results <strong>of</strong> final PCA analyses <strong>of</strong> <strong>water</strong><strong>quality</strong><br />
<strong>and</strong> habitat variables (app. 9); (2) correlations<br />
between <strong>environmental</strong> variables, based on a Spearman<br />
rank correlation test with an alpha value <strong>of</strong> 0.05<br />
(Wilkinson, Engelman, <strong>and</strong> Marcantonio, 1998); <strong>and</strong><br />
(3) variables considered important for describing <strong>water</strong><br />
<strong>quality</strong> <strong>and</strong> aquatic invertebrate communities in an agricultural<br />
l<strong>and</strong>-use <strong>setting</strong> in southwestern Louisiana. The<br />
forward selection process <strong>of</strong> the CCA was used to test<br />
<strong>environmental</strong> variables for statistical significance<br />
(p ≤ 0.05) using a Monte Carlo simulation before adding<br />
it to the final model (ter Braak <strong>and</strong> Smilauer, 1998).<br />
Cluster analysis (fig. 7) was used to determine<br />
which sites had similar <strong>water</strong> <strong>quality</strong>, habitat, <strong>and</strong> aquatic<br />
invertebrate characteristics. Ward's method <strong>of</strong> hierarchical<br />
cluster analysis (Wilkinson <strong>and</strong> others, 1998) was<br />
used with a correlation matrix derived from site scores <strong>of</strong><br />
the first two axes <strong>of</strong> the CCA. A correlation distance <strong>of</strong><br />
2 (cut-level) was used to determine the number <strong>of</strong> clusters,<br />
<strong>and</strong> discriminate analysis (Engelman, 1998) <strong>of</strong> cluster<br />
analysis groups was used to verify group assignment.<br />
Environmental variables <strong>and</strong> aquatic invertebrate<br />
metrics within the study-design (a priori, before sampling)<br />
<strong>and</strong> CCA (posteriori, after sampling) site groups<br />
were compared (fig. 7). Differences in median values<br />
among site groups were determined using nonparametric<br />
statistical methods with an alpha level <strong>of</strong> 0.05. Differences<br />
were determined for large-basin (n = 11 sites) <strong>and</strong><br />
small-basin (n = 8 sites) site groups, <strong>and</strong> for high-intensity<br />
(n = 11 sites) <strong>and</strong> low-intensity (n = 8 sites) site<br />
groups, using a two-factor analysis <strong>of</strong> variance<br />
(ANOVA) (Wilkinson <strong>and</strong> Coward, 1998) on ranked data<br />
(Helsel <strong>and</strong> Hirsch, 1992). CCA site groups (A, n = 3<br />
sites; B, n = 4 sites; C, n = 6 sites; <strong>and</strong> D, n = 6 sites) were<br />
tested using a one-factor ANOVA on ranked data<br />
(Kruskal-Wallis test). When results from the Kruskal-<br />
Wallis test indicated significant differences, the Tukeys<br />
(Wilkinson, 1998) multiple comparison test was used on<br />
ranked data (Helsel <strong>and</strong> Hirsch, 1992) to determine<br />
which site groups were significantly different (fig. 7).<br />
Relations between significant variables <strong>and</strong> relative<br />
abundances <strong>of</strong> aquatic invertebrates at sites were examined<br />
to evaluate invertebrate relations to these variables.<br />
WATER-QUALITY CHARACTERISTICS<br />
Median concentrations <strong>of</strong> nutrients <strong>and</strong> concentrations<br />
<strong>of</strong> pesticides generally were lower in ground <strong>water</strong><br />
than in surface <strong>water</strong>, but median concentrations <strong>of</strong> major<br />
inorganic ions <strong>and</strong> trace elements <strong>of</strong>ten were higher in<br />
ground <strong>water</strong> than in surface <strong>water</strong>. The MCL for nitrate<br />
<strong>and</strong> the SMCL’s for sulfate, iron, <strong>and</strong> manganese were<br />
exceeded in ground <strong>water</strong>; the SMCL’s for sodium, iron,
<strong>and</strong> manganese were exceeded in surface <strong>water</strong>. Concentrations<br />
<strong>of</strong> nutrients <strong>and</strong> major inorganic ions in<br />
ground <strong>water</strong> <strong>and</strong> surface <strong>water</strong> generally were largest in<br />
the southeastern part <strong>of</strong> the study area. In ground <strong>water</strong>,<br />
concentrations <strong>of</strong> 16 pesticides <strong>and</strong> degradation products<br />
were detected but did not exceed MCL’s, HA’s, or<br />
aquatic-life criteria. In surface <strong>water</strong>, 59 pesticides <strong>and</strong><br />
degradation products were detected. Concentrations <strong>of</strong><br />
three pesticides exceeded criteria for the protection <strong>of</strong><br />
drinking <strong>water</strong> or aquatic life, <strong>and</strong> peak concentrations <strong>of</strong><br />
one pesticide exceeded numeric targets for TMDL’s.<br />
Nutrients<br />
Nitrogen <strong>and</strong> phosphorus are nutrients <strong>of</strong> particular<br />
importance because they are necessary for the proper<br />
growth <strong>and</strong> development <strong>of</strong> plants, but can cause the<br />
eutrophication <strong>of</strong> lakes, streams, <strong>and</strong> rivers, <strong>and</strong> at high<br />
levels may adversely affect human health. Eutrophication<br />
is the enrichment <strong>of</strong> a <strong>water</strong> body with nutrients that<br />
can occur naturally, but most <strong>of</strong>ten results from discharge<br />
<strong>of</strong> waste<strong>water</strong> effluent, or run<strong>of</strong>f from agricultural areas.<br />
Streams enriched with nutrients might be subject to<br />
excessive plant growth resulting in algal blooms <strong>and</strong><br />
propagation <strong>of</strong> invasive aquatic plants, such as <strong>water</strong>hyacinth<br />
<strong>and</strong> hydrilla, that contribute to recreational<br />
impairment <strong>and</strong> adverse effects on aquatic life. The<br />
USEPA (2002b) has identified Bayou Nezpique, Bayou<br />
Mallet, <strong>and</strong> Bayou des Cannes as impaired by nutrients,<br />
<strong>and</strong> Bayou Plaquemine Brule, Bayou Queue de Tortue,<br />
Bayou Lacassine, <strong>and</strong> the Mermentau River as impaired<br />
specifically by nitrogen. The USEPA (2002b) established<br />
an MCL <strong>of</strong> 10 mg/L for nitrate as nitrogen in<br />
drinking <strong>water</strong> because concentrations greater than this<br />
increase the risks <strong>of</strong> methemoglobinemia (blue-baby<br />
syndrome) (Hem, 1992). Nitrogen concentrations determined<br />
for this study include ammonia; dissolved <strong>and</strong><br />
total ammonia plus organic nitrogen; nitrite; <strong>and</strong> nitrite<br />
plus nitrate as nitrogen. Minimum, median, <strong>and</strong> maximum<br />
concentrations <strong>of</strong> nitrogen are shown in table 4.<br />
Maximum concentrations <strong>of</strong> nutrients in surface <strong>water</strong><br />
occurred at sites with high agricultural intensity between<br />
February <strong>and</strong> July.<br />
Ammonium is the recommended form <strong>of</strong> nitrogen<br />
used to fertilize rice because nitrate is reduced to nitrous<br />
oxide <strong>and</strong> nitrogen gas in flooded rice fields. The highest<br />
concentrations <strong>of</strong> dissolved ammonia <strong>and</strong> dissolved<br />
ammonia plus organic nitrogen in ground <strong>and</strong> surface<br />
<strong>water</strong> occurred in the southeastern part <strong>of</strong> the study area.<br />
Although the median concentration <strong>of</strong> dissolved ammonia<br />
in surface <strong>water</strong> (0.11 mg/L) was more than three<br />
times the median concentration in ground <strong>water</strong><br />
(0.032 mg/L) (table 4), the maximum concentration<br />
occurred in ground <strong>water</strong> (2.56 mg/L at well 41)<br />
18<br />
(table 5). The maximum concentration in surface <strong>water</strong><br />
(1.65 mg/L) occurred at Theriot (table 5), a site with high<br />
agricultural intensity. The median concentration <strong>of</strong> dissolved<br />
ammonia plus organic nitrogen in surface <strong>water</strong><br />
(0.86 mg/L) was more than eight times the median concentration<br />
in ground <strong>water</strong> (less than 0.10 mg/L). Concentrations<br />
<strong>of</strong> dissolved ammonia greater than 0.50 mg/L<br />
<strong>and</strong> concentrations <strong>of</strong> ammonia plus organic nitrogen<br />
greater than 2.0 mg/L occurred at surface-<strong>water</strong> sites that<br />
drained areas with high agricultural intensity. The maximum<br />
concentration <strong>of</strong> dissolved ammonia plus organic<br />
nitrogen occurred in surface <strong>water</strong> (4.0 mg/L at Theriot);<br />
the maximum concentration in ground <strong>water</strong> (2.7 mg/L)<br />
occurred at well 41. Concentrations <strong>of</strong> total ammonia<br />
plus organic nitrogen were determined for surface-<strong>water</strong><br />
samples only (table 4); the median concentration was<br />
1.3 mg/L <strong>and</strong> the highest concentration (5.1 mg/L)<br />
occurred at Mermentau, a site with high agricultural<br />
intensity.<br />
The median concentration <strong>of</strong> nitrite plus nitrate<br />
(nitrate) was higher in surface <strong>water</strong> (0.230 mg/L) than<br />
in ground <strong>water</strong> (less than 0.050 mg/L), but the highest<br />
concentration (12.6 mg/L) occurred in ground <strong>water</strong><br />
(fig. 8) at well 22. Concentrations greater than<br />
1.00 mg/L occurred at three sites (Des Cannes, Iota, <strong>and</strong><br />
Plaquemine) with high agricultural intensity; however,<br />
the maximum concentration in surface <strong>water</strong><br />
(3.03 mg/L) occurred at the Church Point site, a site with<br />
low agricultural intensity. The peak nitrate concentrations<br />
at Church Point may have been caused by livestock<br />
(fig. 9) <strong>and</strong> at the other three sites by fertilizer applications<br />
in fall <strong>and</strong> spring (fig. 10). The nitrate concentration<br />
at well 22 (12.6 mg/L) was the only exceedance <strong>of</strong><br />
the USEPA (2000a) MCL for nitrate (10 mg/L) in<br />
ground- or surface-<strong>water</strong> samples. This well is shallow<br />
(30 ft), <strong>and</strong> l<strong>and</strong> around the well was used previously for<br />
poultry <strong>and</strong> swine production. Leaching <strong>of</strong> animal waste<br />
may account for the nitrate concentration in the well.<br />
Nutrients from ground <strong>water</strong> used for agricultural<br />
irrigation do not contribute significantly to eutrophication<br />
in surface <strong>water</strong>. Concentrations <strong>of</strong> nitrogen <strong>and</strong><br />
phosphorus in samples from ground <strong>water</strong> generally<br />
were below the thresholds for total nitrogen (1.50 mg/L)<br />
<strong>and</strong> total phosphorus (0.075 mg/L) indicating eutrophic<br />
potential (Dodds <strong>and</strong> others, 1998), whereas concentrations<br />
in samples from surface <strong>water</strong> generally exceeded<br />
the thresholds. In ground <strong>water</strong>, the median concentration<br />
<strong>of</strong> total dissolved nitrogen (the sum <strong>of</strong> dissolved<br />
ammonia plus organic nitrogen <strong>and</strong> nitrite plus nitrate)<br />
was less than the sum <strong>of</strong> detection limits (0.15 mg/L)<br />
(table 4), <strong>and</strong> the median concentration <strong>of</strong> dissolved<br />
phosphorus was 0.07 mg/L (table 6). In surface <strong>water</strong>,
19<br />
Table 4. Minimum, median, <strong>and</strong> maximum concentrations <strong>of</strong> selected nitrogen species for ground- <strong>and</strong> surface-<strong>water</strong> samples from the Mermentau River Basin,<br />
southwestern Louisiana, 1998-2001<br />
[Total nitrogen includes the sum <strong>of</strong> total ammonia plus organic nitrogen <strong>and</strong> dissolved nitrite plus nitrate. Concentrations are in milligrams per liter.
the median concentration <strong>of</strong> total nitrogen (the sum <strong>of</strong><br />
total ammonia plus organic nitrogen <strong>and</strong> dissolved nitrite<br />
plus nitrate) was greater than the eutrophic threshold<br />
March-June <strong>and</strong> December, <strong>and</strong> the median concentration<br />
<strong>of</strong> total phosphorus was greater than the eutrophic<br />
20<br />
threshold throughout the year. Thus, the greatest potential<br />
for eutrophic conditions in surface <strong>water</strong>, based on<br />
nutrient concentrations, existed March-June, about the<br />
same time ricefields were drained, <strong>and</strong> December,<br />
shortly after fertilizers were applied.<br />
Table 5. Maximum concentrations <strong>and</strong> occurrence <strong>of</strong> selected nutrients in ground <strong>water</strong> <strong>and</strong> surface <strong>water</strong> in the<br />
Mermentau River Basin, southwestern Louisiana, 1998-2001<br />
[Concentrations are in milligrams per liter. NA, not applicable]<br />
Nutrient<br />
Ground <strong>water</strong> Surface <strong>water</strong><br />
Concentration Well number Concentration Site name<br />
Dissolved ammonia 2.56 41 1.65 Theriot<br />
Dissolved ammonia plus organic nitrogen 2.7 41 4.0 Theriot<br />
Nitrite plus nitrate, dissolved 12.6 22 3.03 Church Point<br />
Dissolved phosphorus .445 41 1.33 Church Point<br />
Orthophosphorus, dissolved .249 24 1.20 Church Point<br />
Total phosphorus NA NA 1.83 Church Point<br />
Table 6. Minimum, median, <strong>and</strong> maximum concentrations <strong>of</strong> selected phosphorus species for ground- <strong>and</strong> surface<strong>water</strong><br />
samples from the Mermentau River Basin, southwestern Louisiana, 1998-2001<br />
[Concentrations are in milligrams per liter.
CONCENTRATIONS, IN MILLIGRAMS PER LITER<br />
CONCENTRATIONS, IN<br />
MICROGRAMS PER LITER<br />
2.5<br />
2.0<br />
1.5<br />
1.0<br />
0.5<br />
0<br />
600<br />
500<br />
400<br />
300<br />
200<br />
100<br />
0<br />
250<br />
200<br />
150<br />
100<br />
50<br />
5,000<br />
4,000<br />
3,000<br />
2,000<br />
1,000<br />
Ground<br />
Water<br />
DISSOLVED<br />
AMMONIA<br />
Ground<br />
Water<br />
Ground<br />
Water<br />
Ground<br />
Water<br />
SULFATE<br />
Surface<br />
Water<br />
Surface<br />
Water<br />
CHLORIDE<br />
Surface<br />
Water<br />
Surface<br />
Water<br />
MANGANESE<br />
2,000<br />
1,500<br />
1,000<br />
500<br />
TOTAL AMMONIA PLUS<br />
ORGANIC NITROGEN<br />
24<br />
300<br />
250<br />
100<br />
0 0<br />
5<br />
4<br />
3<br />
2<br />
1<br />
0<br />
20<br />
15<br />
10<br />
5<br />
0<br />
Ground<br />
Water<br />
Ground<br />
Water<br />
Ground<br />
Water<br />
Ground<br />
Water<br />
SODIUM<br />
IRON<br />
Surface<br />
Water<br />
POTASSIUM<br />
Surface<br />
Water<br />
Surface<br />
Water<br />
Surface<br />
Water<br />
12<br />
10<br />
60<br />
40<br />
20<br />
8<br />
6<br />
4<br />
2<br />
DISSOLVED NITRITE<br />
PLUS NITRATE<br />
MAGNESIUM<br />
High outlier<br />
Median<br />
4<br />
3<br />
2<br />
1<br />
DISSOLVED AMMONIA<br />
PLUS ORGANIC NITROGEN<br />
120<br />
100<br />
0 0 0<br />
80<br />
60<br />
40<br />
20<br />
EXPLANATION<br />
75th percentile<br />
25th percentile<br />
CALCIUM<br />
Observation less than or equal to<br />
1.5 times the interquartile range<br />
Observation equal to or less than<br />
1.5 times the interquartile range<br />
Low outlier<br />
Maximum Contaminant Level<br />
Figure 8. Concentrations <strong>of</strong> selected nutrients <strong>and</strong> major inorganic ions in ground <strong>water</strong> <strong>and</strong> surface <strong>water</strong> from the<br />
Mermentau River Basin, southwestern Louisiana 1998-2001. Maximum Contaminant Levels <strong>and</strong> Secondary<br />
Maximum Contaminant Levels established by the U.S. Environmental Protection Agency (2000a).<br />
21<br />
0<br />
Ground<br />
Water<br />
Ground<br />
Water<br />
Surface<br />
Water<br />
Surface<br />
Water<br />
0<br />
Secondary Maximum<br />
Contaminant Level<br />
Ground<br />
Water<br />
Ground<br />
Water<br />
Surface<br />
Water<br />
Surface<br />
Water
Photograph by Dennis K. Demcheck, U.S. Geological Survey, 2001<br />
Figure 9. Grazing livestock near a surface-<strong>water</strong> data-collection site in the Mermentau River Basin, southwestern<br />
Louisiana.<br />
Comparisons between thresholds <strong>and</strong> the concentrations<br />
determined during the sampling period should be<br />
made carefully for the following reasons:<br />
1. Nutrient concentrations greater than the<br />
thresholds might not cause excessive or<br />
nuisance plant growth immediately, because<br />
other factors such as turbidity <strong>and</strong> stream<br />
shading affect light penetration, <strong>and</strong><br />
influence photosynthesis <strong>and</strong> aquatic-plant<br />
productivity. Downstream, these factors<br />
might become more favorable for eutrophic<br />
conditions to occur.<br />
2. Drought <strong>and</strong> streamflow conditions that<br />
occurred during the sampling period may not<br />
represent long-term conditions (fig. 6).<br />
3. Nutrient thresholds are probably lower for<br />
subtropical streams, including those found in<br />
the study area, than for the more northern<br />
22<br />
temperate streams for which they were<br />
developed (Walter Dodds, Kansas State<br />
University, written commun., June 6, 2002).<br />
Phosphorus exists in natural <strong>water</strong> in several forms<br />
but transformation pathways for phosphorus are not as<br />
numerous as those for nitrogen. Most phosphorus in<br />
aquatic systems is not available for biological uptake<br />
because the solubility <strong>of</strong> phosphorus is relatively low <strong>and</strong><br />
phosphorus adsorbs strongly to particles. Concentrations<br />
<strong>of</strong> dissolved phosphorus <strong>and</strong> orthophosphorus in<br />
ground <strong>water</strong> <strong>and</strong> surface <strong>water</strong>, <strong>and</strong> total phosphorus in<br />
surface <strong>water</strong> were determined for this study <strong>and</strong> are<br />
listed in table 6.<br />
The median concentration <strong>of</strong> dissolved phosphorus<br />
was 0.070 mg/L in ground <strong>water</strong> <strong>and</strong> 0.094 mg/L in surface<br />
<strong>water</strong> (table 6). The highest concentrations <strong>of</strong> phosphorus<br />
in surface <strong>water</strong> occurred February-June.<br />
Concentrations greater than 0.25 mg/L were detected at
NITRITE PLUS NITRATE AND POTASSIUM<br />
CONCENTRATIONS, IN MILLIGRAMS PER LITER<br />
10.00<br />
1.00<br />
0.10<br />
0.01<br />
Nov.<br />
Jan.<br />
Mar.<br />
May<br />
July<br />
Sept.<br />
Nov.<br />
Jan.<br />
Mar.<br />
1998 1999 2000 2001<br />
DATE<br />
Potassium<br />
Nitrite plus nitrate<br />
Suspended sediment<br />
Figure 10. Concentrations <strong>of</strong> nitrite plus nitrate, potassium, <strong>and</strong> suspended sediment at the Mermentau data-collection<br />
site in the Mermentau River Basin, southwestern Louisiana, 1998-2001.<br />
six sites in the eastern half <strong>of</strong> the study area: Plaquemine,<br />
Wik<strong>of</strong>f, Gr<strong>and</strong> Marais, Mallet, Church Point, <strong>and</strong> Theriot.<br />
The highest concentration <strong>of</strong> dissolved phosphorus<br />
(1.33 mg/L) was detected in surface <strong>water</strong> at the Church<br />
Point site <strong>and</strong> was more than four times the maximum<br />
concentration in ground <strong>water</strong> (0.445 mg/L at well 41).<br />
The median concentration <strong>of</strong> orthophosphorus was<br />
0.056 mg/L in ground <strong>water</strong> <strong>and</strong> 0.066 mg/L in surface<br />
<strong>water</strong>. Concentrations greater than 0.25 mg/L were<br />
detected at six sites: Chene, Plaquemine, Wik<strong>of</strong>f, Gr<strong>and</strong><br />
Marais, Church Point, <strong>and</strong> Theriot. The highest concentration<br />
<strong>of</strong> orthophosphorus (1.20 mg/L) was detected in<br />
surface <strong>water</strong> at the Church Point site (table 5), <strong>and</strong> was<br />
more than four times the maximum concentration in<br />
ground <strong>water</strong> (0.249 mg/L at well 24). Orthophosphorus<br />
was not detected at three <strong>of</strong> the northernmost sites with<br />
low agricultural intensity, Boggy, Caney, <strong>and</strong> Castor.<br />
Total phosphorus concentrations were determined for<br />
May<br />
23<br />
July<br />
EXPLANATION<br />
Sept.<br />
Nov.<br />
Jan.<br />
Mar.<br />
May<br />
Period <strong>of</strong> rice seeding<br />
Period <strong>of</strong> fertilizer application<br />
July<br />
Sept.<br />
600<br />
500<br />
400<br />
300<br />
200<br />
100<br />
0<br />
SUSPENDED-SEDIMENT CONCENTRATIONS,<br />
IN MILLIGRAMS PER LITER<br />
surface-<strong>water</strong> samples only <strong>and</strong> correlate positively with<br />
suspended-sediment concentrations (Pearson r = 0.72).<br />
The maximum concentration (1.83 mg/L) occurred at the<br />
Church Point site. The median concentration <strong>of</strong> total<br />
phosphorus was 0.266 mg/L. Concentrations greater<br />
than 1.00 mg/L were detected at three sites: East Lacassine,<br />
Blue, <strong>and</strong> Church Point. Elevated concentrations <strong>of</strong><br />
phosphorus in ground <strong>water</strong> may result from marine<br />
deposits (Hem, 1992) or agriculture, <strong>and</strong> in surface <strong>water</strong><br />
may result from agriculture. The Church Point site<br />
drains a large area with low agricultural intensity, <strong>and</strong><br />
grazing livestock may have caused the relatively high<br />
phosphorus concentration. In a previous study, Demcheck<br />
(1994) found similar results for Church Point <strong>and</strong><br />
suggested the elevated phosphorus concentrations might<br />
result from run<strong>of</strong>f <strong>of</strong> agricultural fertilizer. The highest<br />
phosphorus concentrations coincide with fertilizer applications<br />
in mid-spring <strong>and</strong> late fall.
Major Inorganic Ions <strong>and</strong> Trace Elements<br />
Dissolved concentrations <strong>of</strong> 7 major inorganic ions<br />
were determined for ground- <strong>and</strong> surface-<strong>water</strong> samples,<br />
<strong>and</strong> dissolved concentrations <strong>of</strong> 16 trace elements were<br />
determined for samples from all wells <strong>and</strong> one surface<strong>water</strong><br />
site, Mermentau. Concentrations <strong>of</strong> major inorganic<br />
ions <strong>and</strong> trace elements were compared with<br />
MCL’s <strong>and</strong> SMCL’s (U.S. Environmental Protection<br />
Agency, 2000a). MCL’s were established to protect public<br />
health by limiting the levels <strong>of</strong> contaminants in drinking<br />
<strong>water</strong>; SMCL’s were established to limit cosmetic<br />
(for example, skin or tooth discoloration) or aesthetic<br />
affects (for example, taste, odor, or color) in drinking<br />
<strong>water</strong>. No MCL’s were exceeded in either ground- or surface-<strong>water</strong><br />
samples; however, one or more SMCL’s were<br />
exceeded in samples from 20 wells <strong>and</strong> all the surface<strong>water</strong><br />
sites (fig. 8). Concentrations <strong>of</strong> antimony, arsenic,<br />
barium, beryllium, cadmium, chromium, copper, lead,<br />
selenium, <strong>and</strong> thallium generally were below detection<br />
limits, but when detected did not exceed MCL’s.<br />
Median concentrations <strong>of</strong> calcium <strong>and</strong> magnesium<br />
in ground <strong>water</strong> were more than three times the median<br />
concentrations in surface <strong>water</strong> (fig. 8). The median concentrations<br />
for calcium <strong>and</strong> magnesium in ground <strong>water</strong><br />
were 66.0 mg/L <strong>and</strong> 25.2 mg/L; maximum concentrations<br />
occurred at well 35 (129 mg/L) <strong>and</strong> well 8<br />
(61.1 mg/L). The median concentrations for calcium <strong>and</strong><br />
magnesium in surface <strong>water</strong> were 15.9 mg/L <strong>and</strong><br />
7.02 mg/L; maximum concentrations occurred at Theriot<br />
(69.3 mg/L) <strong>and</strong> Lacassine (38.5 mg/L), sites with high<br />
agricultural intensity (table 7).<br />
24<br />
Median potassium concentrations were about three<br />
times higher in surface <strong>water</strong> than in ground <strong>water</strong><br />
(fig. 8). The maximum <strong>and</strong> median potassium concentrations<br />
in ground <strong>water</strong> were 3.61 mg/L <strong>and</strong> 1.52 mg/L<br />
<strong>and</strong> in surface <strong>water</strong> were 22.8 mg/L <strong>and</strong> 4.31 mg/L. The<br />
maximum concentration detected in ground <strong>water</strong> was at<br />
well 10 <strong>and</strong> in surface <strong>water</strong> was at Theriot (table 7).<br />
Potassium concentrations in surface <strong>water</strong> peaked twice<br />
annually (fig. 10), in mid-spring <strong>and</strong> late fall; peaks<br />
probably were caused by run<strong>of</strong>f from fertilizer applications<br />
<strong>and</strong> by re-solution <strong>of</strong> detrital plant material (Hem,<br />
1992).<br />
Median concentrations <strong>of</strong> sodium <strong>and</strong> chloride<br />
(fig. 8) were higher in ground <strong>water</strong> than in surface<br />
<strong>water</strong>, but the highest concentrations <strong>of</strong> both constituents<br />
occurred in surface <strong>water</strong> (fig. 8). The median sodium<br />
concentration in ground <strong>water</strong> was 64.3 mg/L <strong>and</strong> the<br />
median chloride concentration was 101 mg/L; the highest<br />
concentrations were 275 mg/L at well 7, <strong>and</strong><br />
328 mg/L at well 22 (table 7). Chloride concentrations<br />
in ground <strong>water</strong> exceeded the SMCL (250 mg/L) (U.S.<br />
Environmental Protection Agency, 2000a) in four wells:<br />
well 35 (264 mg/L), well 25 (281 mg/L), well 7<br />
(293 mg/L), <strong>and</strong> well 22 (328 mg/L). The median chloride<br />
<strong>and</strong> sodium concentrations in surface <strong>water</strong> were<br />
33.4 mg/L <strong>and</strong> 33.0 mg/L. The maximum concentrations<br />
<strong>of</strong> sodium (327 mg/L) <strong>and</strong> chloride (586 mg/L) in<br />
surface <strong>water</strong> occurred at Lacassine (table 7) in March<br />
2000 <strong>and</strong> probably resulted from salt<strong>water</strong> intrusion<br />
induced by flow reversal (bidirectional) during the<br />
drought. The chloride concentration exceeded the<br />
SMCL (U.S. Environmental Protection Agency, 2000a).<br />
Table 7. Maximum concentrations <strong>and</strong> occurrence <strong>of</strong> selected major inorganic ions in ground <strong>water</strong> <strong>and</strong> surface <strong>water</strong><br />
in the Mermentau River Basin, southwestern Louisiana, 1998-2001<br />
[mg/L, milligrams per liter; µg/L, micrograms per liter]<br />
Major inorganic ion<br />
Ground <strong>water</strong> Surface <strong>water</strong><br />
Concentration Well number Concentration Site name<br />
Calcium, in mg/L 129 35 69.3 Theriot<br />
Magnesium, in mg/L 61.1 8 38.5 Lacassine<br />
Potassium, in mg/L 3.61 10 22.8 Theriot<br />
Sodium, in mg/L 275 7 327 Lacassine<br />
Chloride, in mg/L 328 22 586 Lacassine<br />
Alkalinity as calcium<br />
carbonate, in mg/L<br />
546 10 380 Theriot<br />
Sulfate, in mg/L 272 10 79.2 Lacassine<br />
Iron, in µg/L 2,190 49 1,430 Chene<br />
Manganese, in µg/L 739 9 5,270 Boggy
The median value for alkalinity in ground <strong>water</strong> was<br />
more than three times that in surface <strong>water</strong>. The maximum<br />
<strong>and</strong> median values were 546 mg/L <strong>and</strong> 302 mg/L in<br />
ground <strong>water</strong>, <strong>and</strong> 380 mg/L <strong>and</strong> 82 mg/L in surface<br />
<strong>water</strong>. The highest value in ground <strong>water</strong> was at well 10<br />
<strong>and</strong> in surface <strong>water</strong> at Theriot (table 7).<br />
Median <strong>and</strong> maximum sulfate concentrations were<br />
higher in ground <strong>water</strong> than in surface <strong>water</strong> (fig. 8). In<br />
ground <strong>water</strong>, the median concentration was 6.1 mg/L;<br />
the maximum concentration (272 mg/L) occurred at<br />
well 10 <strong>and</strong> was the only concentration to exceed the<br />
SMCL (250 mg/L) (U.S. Environmental Protection<br />
Agency, 2000a). In surface <strong>water</strong>, the median concentration<br />
was 4.55 mg/L, <strong>and</strong> the maximum concentration<br />
occurred at Lacassine (79.2 mg/L) during March 2000.<br />
Iron concentrations exceeded the SMCL (300 µg/L)<br />
(U.S. Environmental Protection Agency, 2000a) in<br />
ground <strong>water</strong> <strong>and</strong> surface <strong>water</strong> (fig. 8). Although the<br />
median iron concentration in ground <strong>water</strong> (20 µg/L)<br />
was one-third the median in surface <strong>water</strong> (60 µg/L), the<br />
highest concentration occurred in ground <strong>water</strong>. In seven<br />
wells, iron concentrations exceeded the SMCL; the maximum<br />
(2,190 µg/L) occurred at well 49. Iron concentrations<br />
in surface <strong>water</strong> exceeded the SMCL at eight sites:<br />
Blue, Lacassine, Mermentau, Boggy, East Lacassine,<br />
Caney, Castor, <strong>and</strong> Chene; the maximum, 1,430 µg/L,<br />
occurred at Chene in May 2000 (table 7).<br />
CONCENTRATION, IN MICROGRAMS<br />
PER LITER<br />
1,000.00<br />
100.00<br />
10.00<br />
1.00<br />
0.10<br />
0.01<br />
0.00<br />
2,4-D<br />
Malathion<br />
Bentazon<br />
Chlorimuron-Ethyl<br />
Metribuzin<br />
Metolachlor<br />
Picloram<br />
Imazaquin<br />
Alachlor<br />
PESTICIDE<br />
25<br />
Manganese concentrations exceeded the SMCL<br />
(50 µg/L) (U.S. Environmental Protection Agency,<br />
2000a) in ground <strong>water</strong> <strong>and</strong> surface <strong>water</strong>. The median<br />
manganese concentration in ground <strong>water</strong> (121 µg/L)<br />
was less than the median in surface <strong>water</strong> (150 µg/L).<br />
The maximum concentration in surface <strong>water</strong> was more<br />
than seven times the maximum in ground <strong>water</strong> (table 7).<br />
Manganese concentrations exceeded the SMCL in 17<br />
wells. Manganese concentrations in ground <strong>water</strong><br />
exceeding the SMCL ranged between 52.8 µg/L <strong>and</strong><br />
739 µg/L; the maximum occurred at well 9. Manganese<br />
concentrations exceeded the SMCL at all surface-<strong>water</strong><br />
sites <strong>and</strong> were highest at Blue, Caney, Boggy, <strong>and</strong> Castor,<br />
in the northwestern part <strong>of</strong> the study area; the maximum<br />
(5,270 µg/L) occurred at Boggy. Manganese leached<br />
from geologic deposits may cause the higher concentrations.<br />
Pesticides<br />
Fewer pesticides were detected in ground <strong>water</strong><br />
than in surface <strong>water</strong>. Thirty-eight percent <strong>of</strong> the samples<br />
collected from wells contained at least one pesticide,<br />
<strong>and</strong> all surface-<strong>water</strong> samples contained at least three<br />
pesticides. Pesticide concentrations in ground <strong>water</strong> did<br />
not exceed criteria for drinking <strong>water</strong> or the protection <strong>of</strong><br />
aquatic life (fig. 11). In surface <strong>water</strong>, however, concentrations<br />
<strong>of</strong> atrazine, malathion, <strong>and</strong> tebuthiuron exceeded<br />
Maximum concentration<br />
Drinking-<strong>water</strong> criterion<br />
Aquatic-life criterion<br />
Metalaxyl<br />
Deethylatrazine<br />
Atrazine<br />
Diethyldeisopropylatrazine<br />
2-Hydroxyatrazine<br />
Flumetsulam<br />
Tebuthiuron<br />
Chlorpyrifos<br />
Diuron<br />
3 (4-Chlorophenyl)-1-<br />
Methyl Urea<br />
Figure 11. Drinking-<strong>water</strong> <strong>and</strong> aquatic-life criteria, <strong>and</strong> maximum detected concentrations <strong>of</strong> selected pesticides in<br />
ground <strong>water</strong> in the Mermentau River Basin, southwestern Louisiana, 2000-2001 (Diuron was detected, but concentration<br />
was not quantified).
criteria for the protection <strong>of</strong> drinking <strong>water</strong> or aquatic life<br />
(fig. 12). Concentrations <strong>of</strong> fipronil exceeded USEPA<br />
(2002b) numeric targets for TMDL’s (table 3). Although<br />
atrazine concentrations in three samples collected in the<br />
spring exceeded 3 µg/L, the MCL (U.S. Environmental<br />
Protection Agency, 2000a) was not exceeded because it<br />
is based on an annual average <strong>of</strong> quarterly samples. Concentrations<br />
larger than 3 µg/L were not detected in samples<br />
collected during other times <strong>of</strong> the year, <strong>and</strong> the<br />
average annual concentrations did not exceed 3 µg/L for<br />
sites sampled throughout the year.<br />
Concentrations were determined for 109 pesticides<br />
<strong>and</strong> degradation products in samples from 29 wells.<br />
Concentrations were detected in less than 1 percent (25)<br />
<strong>of</strong> the analyses for ground-<strong>water</strong> samples; 19 pesticides<br />
<strong>and</strong> degradations products were detected (fig. 11). Pesticides<br />
<strong>and</strong> degradation products were detected in samples<br />
from 11 wells; samples from wells 6 <strong>and</strong> 35 each<br />
accounted for 24 percent <strong>of</strong> the detections. Pesticides<br />
<strong>and</strong> degradation products detected most frequently were<br />
the herbicides bentazon (3 detections) <strong>and</strong> atrazine<br />
(5 detections).<br />
Concentrations were determined for 109 pesticides<br />
<strong>and</strong> degradation products in surface-<strong>water</strong> samples; concentrations<br />
were detected in 20 percent <strong>of</strong> these analyses.<br />
Concentrations <strong>of</strong> 47 pesticides <strong>and</strong> degradation products<br />
were detected in surface <strong>water</strong>; at least 3 pesticides<br />
were detected in all samples. Annual maximum concentrations<br />
<strong>of</strong> different pesticides <strong>and</strong> pesticide degradation<br />
products usually occurred during the spring, about the<br />
time ricefields were drained, as shown in figure 13 for<br />
the Mermentau site. More than 190 samples collected<br />
from 24 surface-<strong>water</strong> sites were analyzed for<br />
51 hydrophilic pesticides <strong>and</strong> degradation products<br />
(app. 2); 28 pesticides were detected. A total <strong>of</strong> 36 samples<br />
collected from Des Cannes, Lacassine, <strong>and</strong> Mermentau<br />
sites were analyzed for 58 hydrophobic<br />
pesticides <strong>and</strong> degradation products. Nineteen pesticides<br />
were detected, <strong>and</strong> at least 3 were detected in more than<br />
70 percent <strong>of</strong> the samples.<br />
The herbicides atrazine, molinate, <strong>and</strong> tebuthiuron,<br />
<strong>and</strong> the insecticide fipronil were detected in samples collected<br />
from all surface-<strong>water</strong> sites. Herbicides were<br />
detected more frequently <strong>and</strong> in larger concentrations<br />
than insecticides. Atrazine occurred in over 92 percent<br />
<strong>of</strong> the samples; concentrations in 3 samples exceeded the<br />
criterion (3 µg/L) for drinking <strong>water</strong>, <strong>and</strong> concentrations<br />
in 10 samples exceeded the criterion for the protection <strong>of</strong><br />
aquatic life (1.8 µg/L). Molinate occurred in more than<br />
86 percent <strong>of</strong> the samples <strong>and</strong> at the largest concentration<br />
(154 µg/L) for any <strong>of</strong> the pesticides detected in the study<br />
area. Tebuthiuron <strong>and</strong> malathion each were detected<br />
once in concentrations exceeding criteria for the protec-<br />
26<br />
tion <strong>of</strong> aquatic life. Fipronil concentrations at 17 sites<br />
exceeded the fresh<strong>water</strong> chronic numeric target concentration<br />
for TMDL <strong>of</strong> 2.3 µg/L (table 3), <strong>and</strong> at 3 sites<br />
exceeded the acute numeric target concentration for<br />
TMDL <strong>of</strong> 4.6 µg/L (U.S. Environmental Protection<br />
Agency, 2002b).<br />
Atrazine is the most commonly used herbicide in<br />
the United States (Hayes <strong>and</strong> others, 2002). Two atrazine<br />
degradation products, 2-hydroxyatrazine <strong>and</strong> deethylatrazine,<br />
were detected in 83 <strong>and</strong> 90 percent <strong>of</strong> the samples.<br />
Although concentrations at Riceville (5.23 µg/L)<br />
<strong>and</strong> Lacassine (5.83 <strong>and</strong> 8.91 µg/L) exceeded 3 µg/L, the<br />
USEPA (2000a) MCL (3 µg/L) was not exceeded<br />
because it is based on an annual average <strong>of</strong> quarterly<br />
samples. Concentrations at Riceville, Mermentau, <strong>and</strong><br />
Lacassine exceeded the criterion for the protection <strong>of</strong><br />
aquatic life (1.8 µg/L). There is some evidence that atrazine<br />
disrupts the endocrine system in some amphibians at<br />
concentrations less than 1 µg/L (Hayes <strong>and</strong> others,<br />
2002). Concentrations greater than 1 µg/L were detected<br />
at Des Cannes, Mermentau, Riceville, Lake Arthur,<br />
Lacassine, Tortue, Church Point, <strong>and</strong> Mallet sites. Concentrations<br />
greater than 0.1 µg/L were detected at all<br />
sites except Boggy, Castor, Blue, Upper Des Cannes, <strong>and</strong><br />
Caney.<br />
Tebuthiuron, a urea-based broad-spectrum herbicide,<br />
is used to control weeds in rights-<strong>of</strong>-way, industrial<br />
sites, <strong>and</strong> rangel<strong>and</strong> (Oregon State University, 1996).<br />
Tebuthiuron was detected at all the surface-<strong>water</strong> sites<br />
<strong>and</strong> in 95 percent <strong>of</strong> all surface-<strong>water</strong> samples. The largest<br />
concentration (6.33 µg/L) was detected at the Des<br />
Cannes site <strong>and</strong> was the only detection exceeding the criterion<br />
(1.6 µg/L) for the protection <strong>of</strong> aquatic life<br />
(table 3).<br />
Malathion, an organophosphate insecticide, is used<br />
for public health mosquito control (U.S. Environmental<br />
Protection Agency, 2000b), recommended for control <strong>of</strong><br />
household insects by homeowners (Louisiana State University<br />
Agricultural Center, 2002), <strong>and</strong> recommended for<br />
control <strong>of</strong> stinkbugs associated with rice agriculture<br />
(Louisiana State University Agricultural Center, 2001).<br />
Malathion was detected at 16 surface-<strong>water</strong> sites; the<br />
largest concentration (0.113 µg/L) occurred at the<br />
Lacassine site <strong>and</strong> was the only detection that exceeded<br />
the criterion (0.1 µg/L) for the protection <strong>of</strong> aquatic life<br />
(table 3).<br />
In 1999, carb<strong>of</strong>uran was replaced with fipronil, a<br />
relatively new phenypyrazole insecticide, to control the<br />
rice <strong>water</strong> weevil. Carb<strong>of</strong>uran was sprayed in areas<br />
where the rice <strong>water</strong> weevil was observed, whereas<br />
fipronil is used prophylactically as a seed coating prior to<br />
planting (fig. 13). Fipronil was detected in more than
CONCENTRATION, IN MICROGRAMS<br />
PER LITER<br />
CONCENTRATION, IN MICROGRAMS<br />
PER LITER<br />
1,000.00<br />
100.00<br />
10.00<br />
1.00<br />
0.10<br />
0.01<br />
0.001<br />
1,000.00<br />
100.00<br />
10.00<br />
1.00<br />
0.10<br />
0.01<br />
0.001<br />
Maximum concentration<br />
Drinking-<strong>water</strong> criterion<br />
Aquatic-life criterion<br />
2, 4-D 2, 4 -Dm ethylester 2-Hydroxyatrazine Acetochlor<br />
Acifluorfen Alachlor Atrazine Benomyl<br />
Bensulfuron-methyl Bentazon<br />
Bromacil Carbaryl Carb<strong>of</strong>uran Chlorimuron-ethyl<br />
Ethoprophos Fluometuron Imazaquin Malathion MCPA<br />
Metalaxyl Methomyl<br />
Methyl-Parathion Metolachlor<br />
Metribuzin Molinate p, p’ -DDE<br />
Pendimethalin Prometon Propachlor<br />
Propanil<br />
Propiconazoel Siduron Simazine Sulfometuron-methyl<br />
Tebuthu i ron<br />
Thiobencarb<br />
Triclopyr<br />
Triflurali<br />
PESTICIDE<br />
Chlorpyrifos Cyanazine Deethylatrazine Deethyldeisopropylatrazine Deisopropylatrazine Diazinon Dieldrin Dinoseb<br />
Diphenamid Diuron Fp i ronil (chronic) Fipronil (acut e)<br />
EPTC<br />
Maximum concentration<br />
Drinking-<strong>water</strong> criterion<br />
Aquatic-life criterion<br />
Figure 12. Drinking-<strong>water</strong> <strong>and</strong> aquatic-life criteria, <strong>and</strong> maximum detected concentrations <strong>of</strong> selected pesticides<br />
in surface <strong>water</strong> in the Mermentau River Basin, southwestern Louisiana, 1998-2001.<br />
27<br />
n
28<br />
CONCENTRATION, IN MICROGRAMS PER LITER<br />
6<br />
5<br />
4<br />
3<br />
2<br />
1<br />
0<br />
Nov.<br />
1998<br />
Ja n.<br />
Mar.<br />
May<br />
July S ept.<br />
Nov.<br />
Jan.<br />
Ma. r<br />
yMa<br />
1999 2000 2001<br />
Atrazine<br />
Molinate<br />
Metolachlor<br />
DATE<br />
July EXPLANATION<br />
Sept. Tebuthiuron<br />
Carb<strong>of</strong>uran<br />
Figure 13. Concentrations <strong>of</strong> selected pesticides at the Mermentau data-collection site in the Mermentau River Basin, southwestern<br />
Louisiana, 1998-2001.<br />
Fipronil<br />
Nov. Jan<br />
.<br />
Mar.<br />
May July<br />
Sept.
72 percent <strong>of</strong> the surface-<strong>water</strong> samples. Maximum concentrations<br />
<strong>of</strong> fipronil <strong>and</strong> degradation products occurred<br />
in the head<strong>water</strong>s <strong>of</strong> small bayous surrounded by rice<br />
agriculture during March <strong>and</strong> April, which coincided<br />
with the release <strong>of</strong> ricefield tail<strong>water</strong>s (Demcheck <strong>and</strong><br />
Skrobialowski, 2003). Concentrations <strong>of</strong> fipronil at surface-<strong>water</strong><br />
sites (app. 3) ranged from less than<br />
0.004 µg/L to 6.41 µg/L <strong>and</strong> exceeded the fresh<strong>water</strong><br />
acute numeric target for TMDL (4.6 µg/L) at Gr<strong>and</strong><br />
Marais (5.19 µg/L), East Lacassine (5.29 µg/L), <strong>and</strong><br />
Blue (6.41 µg/L), <strong>and</strong> the chronic numeric target for<br />
TMDL (2.3 µg/l) (U.S. Environmental Protection<br />
Agency, 2002b) at 14 other surface-<strong>water</strong> sites. Fipronil<br />
can be degraded by several pathways into at least six degradation<br />
products, four <strong>of</strong> which were analyzed for <strong>and</strong><br />
detected in this study: RPA 105048, fipronil sulfone,<br />
fipronil sulfide, <strong>and</strong> desulfinylfipronil. Each <strong>of</strong> the<br />
reported degradation products occurred in more samples<br />
than the parent compound. Fipronil sulfone, fipronil sulfide,<br />
<strong>and</strong> desulfinylfipronil are more persistent <strong>and</strong> toxic<br />
to some aquatic life than the parent compound (Connelly,<br />
2001). Fipronil is toxic to hatchling crawfish at concentrations<br />
as low as 4.95 µg/L <strong>and</strong> toxic to large crawfish<br />
at 43.5 µg/L (Ottea <strong>and</strong> Romaire, 2001). Fipronil concentrations<br />
as low as 0.005 µg/L can affect survival,<br />
reproduction <strong>and</strong> growth <strong>of</strong> estuarine shrimp (U.S. Environ-mental<br />
Protection Agency, 1996). The USEPA<br />
(1996) also states<br />
1. Fipronil sulfone is 3.3 times more toxic to<br />
native bluegill sunfish than the parent<br />
compound;<br />
2. Fipronil sulfone is 6.6 times more toxic <strong>and</strong><br />
fipronil sulfide is 1.9 times more toxic to<br />
fresh<strong>water</strong> invertebrates than the parent<br />
compound; <strong>and</strong><br />
3. Desulfinylfipronil is extremely stable <strong>and</strong> is<br />
more toxic than the parent compound.<br />
Demcheck <strong>and</strong> Skrobialowski (2003) also found<br />
that fipronil rapidly degrades within the <strong>water</strong> column,<br />
usually within 3 months. Desulfinylfipronil is the primary<br />
degradation product in the <strong>water</strong> column, whereas<br />
fipronil sulfone <strong>and</strong> fipronil sulfide are predominant in<br />
bed sediment.<br />
Bed-sediment samples collected at 17 surface-<strong>water</strong><br />
sites in 2000 were analyzed for hydrophobic pesticides.<br />
Of the 39 pesticides analyzed, only degradation products<br />
from DDT <strong>and</strong> fipronil were detected. Degradation<br />
products from DDT, mostly DDE, were detected in bottom<br />
material from 10 sites (Goree <strong>and</strong> others, 2002).<br />
Concentrations <strong>of</strong> DDE at Des Cannes <strong>and</strong> the Church<br />
Point site exceeded interim fresh<strong>water</strong> sediment <strong>quality</strong><br />
guidelines (1.42 µg/kg) for the protection <strong>of</strong> aquatic life<br />
29<br />
(Canadian Council <strong>of</strong> Ministers <strong>of</strong> the Environment,<br />
1999). Of the fipronil degradation products, concentrations<br />
<strong>of</strong> fipronil sulfide were highest <strong>and</strong> were detected at<br />
all 17 sites, fipronil sulfone was detected at 16 sites, <strong>and</strong><br />
desulfinylfipronil was detected at 17 sites. Demcheck<br />
<strong>and</strong> Skrobialowski (2003) concluded fipronil degradation<br />
products in bed sediment accumulate <strong>and</strong> concentrations<br />
generally increase from head<strong>water</strong> streams to the<br />
mainstem <strong>of</strong> the Mermentau River. Guidelines are not<br />
available (2002) to evaluate the <strong>environmental</strong> effects <strong>of</strong><br />
fipronil <strong>and</strong> fipronil degradation products in bed sediment.<br />
ECOLOGICAL INDICATORS OF<br />
SURFACE-WATER QUALITY<br />
Results <strong>of</strong> ANOVA testing <strong>of</strong> study-design <strong>and</strong><br />
CCA site groups indicated that habitat characteristics<br />
including channel size <strong>and</strong> morphology, <strong>water</strong> clarity,<br />
open canopy, <strong>and</strong> substrate differed between streams in<br />
the northern <strong>and</strong> southern parts <strong>of</strong> the study area. In the<br />
northern part <strong>of</strong> the study area, characterized by low agricultural<br />
intensity, streams drain a transitional zone where<br />
mixed pine hardwood forests change to wet prairie.<br />
These small streams with incised channels were typically<br />
clear, with little open canopy, <strong>and</strong> contained fine s<strong>and</strong> to<br />
clay substrates with abundant woody debris. In the<br />
southern part <strong>of</strong> the study area, characterized by high<br />
agricultural intensity, streams drain treeless wet prairie<br />
where an impermeable clay layer (hardpan) prevents vertical<br />
drainage <strong>of</strong> surface <strong>water</strong> <strong>and</strong> growth <strong>of</strong> tree roots.<br />
Where the hardpan is discontinuous, <strong>water</strong> cypresstupelo<br />
hardwoods grow along flood plains <strong>and</strong> wetl<strong>and</strong>s,<br />
which may contain submerged <strong>and</strong> emergent macrophytes<br />
(aquatic plants). These large, wide streams typically<br />
were turbid, had open canopy, <strong>and</strong> contained<br />
organic-rich silt <strong>and</strong> clay substrates with some woody<br />
debris.<br />
Stream habitat ratings were based on the total <strong>of</strong> 10<br />
habitat parameter scores using the RBP habitat characterization<br />
(Barbour <strong>and</strong> others, 1999). Scores increase as<br />
habitat <strong>quality</strong> increases. Ratings at 16 <strong>of</strong> 19 sites ranged<br />
from suboptimal (102-154) to optimal (155-200) for biological<br />
communities (app. 6 <strong>and</strong> 7). Theriot, Tortue, <strong>and</strong><br />
Gr<strong>and</strong> Marais sites were rated as marginal (49-101) for<br />
biological communities because <strong>of</strong> disturbances in the<br />
habitat. Heavy deposits <strong>of</strong> sediment in the stream at<br />
these sites may affect availability <strong>of</strong> aquatic invertebrate<br />
habitat by decreasing potential colonization locations<br />
because <strong>of</strong> silt- <strong>and</strong> clay-coated woody debris. At Tortue<br />
<strong>and</strong> Gr<strong>and</strong> Marais, the streams have been channelized<br />
<strong>and</strong> lack the microhabitat diversity normally present at<br />
other similar-size stream reaches studied. Decreased
ank stability at Tortue <strong>and</strong> the reduced riparian vegetative<br />
zone at Gr<strong>and</strong> Marais also contributed to lower RBP<br />
habitat scores for these sites.<br />
Typically, organisms considered tolerant <strong>of</strong> turbidity,<br />
organic enrichment, <strong>and</strong> low dissolved-oxygen concentrations<br />
were common in the entire study area <strong>and</strong><br />
dominated the overall aquatic invertebrate community.<br />
Sensitive taxa such as Ephemeroptera (mayflies), Plecoptera<br />
(stoneflies), <strong>and</strong> Trichoptera (caddisflies) (EPT)<br />
were rare at all sites in the Mermentau River Basin <strong>and</strong><br />
were only abundant at the Whisky site in the Calcasieu<br />
River Basin. Tolerant taxa abundant throughout the Mermentau<br />
River Basin included Diptera (true flies), especially<br />
the family Chironomidae (midges); Tubificida<br />
(aquatic worms); the tolerant Ephemeroptera family<br />
Caenidae (caenids); <strong>and</strong> the Gastropoda (snails, limpets)<br />
family Physidae (pouch snails).<br />
A total <strong>of</strong> 22,678 aquatic invertebrates were collected<br />
at <strong>ecological</strong> data-collection sites, including<br />
95 species, 80 genera, <strong>and</strong> 43 families. Taxon groups <strong>of</strong><br />
Diptera were the most common (40 species), followed by<br />
Coleoptera (beetles; 14 species), Trichoptera (7 species),<br />
Ephemeroptera (6 species), <strong>and</strong> Gastropoda (5 species).<br />
Greater than 80 percent <strong>of</strong> all sampled aquatic invertebrates<br />
were accounted for by the orders Diptera (46 percent),<br />
Amphipoda (scuds, sideswimmers; 18 percent),<br />
Tubificida (7 percent), Ephemeroptera (6 percent), <strong>and</strong><br />
Gastropoda (5 percent) (app. 8).<br />
Comparison <strong>of</strong> Site Groups<br />
The study design, based on drainage area <strong>and</strong> agricultural<br />
l<strong>and</strong>-use intensity, was used to determine natural<br />
<strong>and</strong> human-related influences on surface-<strong>water</strong> <strong>quality</strong> at<br />
19 <strong>ecological</strong> data-collection sites. Aquatic invertebrate<br />
communities were used as <strong>ecological</strong> <strong>indicators</strong> <strong>of</strong> <strong>water</strong><br />
<strong>quality</strong> <strong>and</strong> habitat conditions at these sites. Through<br />
CCA, four significant (p ≤ 0.05) <strong>environmental</strong> variables<br />
(instream cover score, percentage <strong>of</strong> open canopy, <strong>and</strong><br />
concentrations <strong>of</strong> dissolved oxygen <strong>and</strong> maximum dissolved<br />
fipronil) were identified that described the distribution<br />
<strong>of</strong> aquatic invertebrate communities among<br />
<strong>ecological</strong> data-collection sites. Cluster analysis <strong>of</strong> CCA<br />
site scores from the first two axes identified four site<br />
groups which separated <strong>ecological</strong> data-collection sites<br />
geographically within the study. Environmental variables<br />
<strong>and</strong> aquatic invertebrate metrics within the studydesign<br />
(a priori, before sampling) <strong>and</strong> CCA (posteriori,<br />
after sampling) site groups were compared (fig. 7).<br />
30<br />
Study-Design Site Groups<br />
The study was designed to determine significant<br />
differences in chemical, biological, <strong>and</strong> physical habitat<br />
<strong>indicators</strong> <strong>of</strong> surface-<strong>water</strong> <strong>quality</strong> among (1) basin site<br />
groups (large <strong>and</strong> small), <strong>and</strong> (2) intensity site groups<br />
(high <strong>and</strong> low agricultural intensity). Low-intensity sites<br />
were used to characterize natural chemical, biological,<br />
<strong>and</strong> physical habitat conditions. Site groups were compared<br />
to evaluate aquatic invertebrate relations to <strong>environmental</strong><br />
variables.<br />
Stream Habitat Characteristics<br />
Significant statistical differences (p ≤ 0.05) in<br />
stream habitat characteristics occurred between basin<br />
<strong>and</strong> intensity site groups (table 8). Bank erosion scores<br />
<strong>and</strong> bankfull <strong>and</strong> wetted channel widths differed between<br />
basin site groups, whereas the bank stability index <strong>and</strong><br />
pool substrate differed between intensity site groups.<br />
Differences in bank characteristics, channel width, <strong>and</strong><br />
pool substrate may account for some differences in<br />
aquatic invertebrate communities among site groups.<br />
Generally, median bank erosion scores <strong>and</strong> median<br />
measurements <strong>of</strong> bankfull <strong>and</strong> wetted channel widths<br />
were greatest at sites with large drainage areas. Median<br />
bank erosion scores at large-basin sites were 2.5 times<br />
the scores at small-basin sites. Median bankfull <strong>and</strong> wetted<br />
channel widths at large-basin sites were at least two<br />
times the median at small-basin sites.<br />
Generally, the median bank stability index <strong>and</strong> pool<br />
substrate characterization score were lowest at all site<br />
groups with high agricultural intensity. The bank stability<br />
index (Fitzpatrick <strong>and</strong> others, 1998) was used to<br />
assess stream bank structure among site groups <strong>and</strong><br />
included bank measurements <strong>of</strong> angle, vegetative cover,<br />
height, <strong>and</strong> substrate. A higher bank stability index indicated<br />
a less stable bank. Eighty percent <strong>of</strong> the sites were<br />
classified as having unstable banks. High-intensity sites<br />
had greater bank stability (smaller median bank stability<br />
index) than low-intensity sites. Differences in the bank<br />
stability index between intensity site groups were attributed<br />
to differences in bank height. As bank height<br />
increased the bank stability index increased. The median<br />
pool substrate characterization score at low-intensity<br />
sites was more than 1.5 times the score at high-intensity<br />
sites. The high-intensity sites had mud- or clay-dominated<br />
pool substrate containing few or no root mats <strong>and</strong><br />
little or no submerged vegetation. Pool substrate at lowintensity<br />
sites was fine s<strong>and</strong> mixed with mud or clay with<br />
some root mats <strong>and</strong> submerged vegetation.
Table 8. Median stream habitat variables for study-design site groups in southwestern Louisiana, 2001<br />
[Boldface values indicate significant differences (p ≤ 0.05) among site groups. Pool substrate characterization protocols from Barbour <strong>and</strong><br />
others (1999). n, number <strong>of</strong> sites; RBP, Rapid Bioassessment Protocols (Barbour <strong>and</strong> others, 1999)]<br />
Stream habitat variables<br />
Large<br />
(n=11)<br />
Basin<br />
site groups<br />
Quantitative measurements<br />
31<br />
Small<br />
(n=8)<br />
High<br />
(n=11)<br />
Intensity<br />
site groups<br />
Bank angle (degrees) 49 48 53 43<br />
Bank erosion score 5 2 4 3<br />
Bank height (meter) 3.1 2.0 1.3 3.2<br />
Bank stability index 13 12 11 13<br />
Bankfull channel width (meter) 28.6 14.3 21.6 20.3<br />
Wetted channel width (meter) 20.4 6.8 16.2 9.2<br />
Qualitative measurements (score)<br />
Pool substrate characterization (0-20) 13 9 9 15<br />
RBP total site score (0-200) 142 149 142 163<br />
Aquatic Invertebrate Communities<br />
Significant statistical differences (p ≤ 0.05) in<br />
aquatic invertebrate community metrics occurred<br />
between basin <strong>and</strong> intensity site groups (table 9). Generally,<br />
aquatic invertebrate community structures were<br />
significantly different based on the percentage <strong>of</strong> noninsects,<br />
abundance <strong>of</strong> midge taxa, abundance <strong>and</strong> percentage<br />
<strong>of</strong> feeding groups, <strong>and</strong> number <strong>of</strong> tolerant organisms<br />
between intensity site groups. A significant interaction<br />
between drainage area <strong>and</strong> agricultural intensity is evident<br />
in the percentage <strong>of</strong> noninsects <strong>and</strong> the percentage<br />
<strong>of</strong> collector-gatherer taxa. The percentage <strong>of</strong> noninsects,<br />
notably Amphipods <strong>and</strong> Gastropods, was largest in largebasin<br />
sites with high intensity. Highest abundances <strong>of</strong><br />
total aquatic invertebrates occurred at low-intensity sites<br />
regardless <strong>of</strong> drainage area. The abundance <strong>of</strong> midges,<br />
particularly the percentage <strong>of</strong> Tanytarsini midges, largely<br />
accounts for the differences in abundance <strong>of</strong> total aquatic<br />
invertebrates (total abundance) between intensity site<br />
groups. Diversity metrics were similar within basin <strong>and</strong><br />
intensity site groups. Percentages <strong>of</strong> collector-gatherers,<br />
notably Orthocladiinae midges, generally were higher at<br />
small-basin sites, particularly those with high agricultural<br />
intensity. The abundance <strong>of</strong> omnivores was higher<br />
<strong>and</strong> percentage <strong>of</strong> shredder taxa was lower at low-intensity<br />
sites. The abundance-weighted tolerance (biotic<br />
index) was consistent with composition metrics <strong>and</strong> indicated<br />
the most tolerant organisms typically were present<br />
at high-intensity sites.<br />
Low<br />
(n=8)<br />
The largest differences in percentages <strong>of</strong> predominant<br />
groups occurred between intensity site groups<br />
(fig. 14). All predominant groups except Diptera, Malacostraca,<br />
<strong>and</strong> Oligochaeta varied by less than 7 percent<br />
between large- <strong>and</strong> small-basin <strong>and</strong> between high- <strong>and</strong><br />
low-intensity site groups. Diptera dominated low-intensity<br />
sites regardless <strong>of</strong> drainage area. Low-intensity sites<br />
had 22 percent more Diptera <strong>and</strong> 18 percent fewer Malacostraca<br />
than high-intensity sites. Malacostraca, particularly<br />
more tolerant Amphipods such as Hyalella azteca<br />
<strong>and</strong> the Gastropoda families Physidae <strong>and</strong> Planorbidae<br />
(orb snails), dominated large-basin sites with high intensity.<br />
Oligochaeta, especially tubificids, were more abundant<br />
at small-basin sites than at large-basin sites.<br />
Median abundance <strong>of</strong> aquatic invertebrates, midges,<br />
<strong>and</strong> Tanytarsini midges varied between intensity site<br />
groups (fig. 15, table 9). Generally, abundances doubled<br />
from high- to low-intensity sites regardless <strong>of</strong> drainage<br />
area. The abundance <strong>of</strong> Tanytarsini midges was expected<br />
to decrease with increased perturbation at a site (Barbour<br />
<strong>and</strong> others, 1999). The percentage <strong>of</strong> Tanytarsini midges<br />
remained the same between large- <strong>and</strong> small-basin sites<br />
but increased from 4 percent at the high-intensity sites to<br />
16 percent at the low-intensity sites (table 9). The<br />
smaller abundance <strong>of</strong> total aquatic invertebrates, midges,<br />
<strong>and</strong> Tanytarsini midges at high-intensity sites indicated<br />
that these organisms may be sensitive to <strong>water</strong>-<strong>quality</strong><br />
<strong>and</strong> habitat conditions associated with agricultural intensity.
Table 9. Median aquatic invertebrate metrics for basin <strong>and</strong> intensity site groups in southwestern Louisiana, 2001<br />
[Median densities <strong>and</strong> taxa <strong>of</strong> aquatic invertebrates are rounded to the nearest whole number. Densities are reported as organisms per square meter.<br />
Boldface values indicate significant differences (p ≤ 0.05) among site groups, based on results <strong>of</strong> two-factor analysis <strong>of</strong> variance (ANOVA).<br />
n, number <strong>of</strong> sites;
MEDIAN PREDOMINANT INVERTEBRATE<br />
GROUPS, IN PERCENT<br />
100<br />
90<br />
80<br />
70<br />
60<br />
50<br />
40<br />
30<br />
20<br />
10<br />
0<br />
LARGE<br />
BASIN<br />
SMALL<br />
BASIN<br />
HIGH<br />
INTENSITY<br />
STUDY-DESIGN SITE GROUPS<br />
LOW<br />
INTENSITY<br />
Other Insects<br />
(springtails, hellgrammites, dobson,<br />
damsel <strong>and</strong> dragonflies)<br />
Malacostraca<br />
(amphipods, decapods, <strong>and</strong><br />
isopods)<br />
Mollusca<br />
(gastropods <strong>and</strong> bivalves)<br />
EXPLANATION<br />
PREDOMINANT INVERTEBRATE<br />
GROUPS<br />
Ephemeroptera, Plecoptera,<br />
Trichoptera (mayflies, stoneflies,<br />
<strong>and</strong> caddisflies)<br />
Coleoptera<br />
(beetles)<br />
Diptera<br />
(true flies <strong>and</strong> midges)<br />
Oligochaeta<br />
(aquatic worms)<br />
Figure 14. Composition <strong>of</strong> predominant groups <strong>of</strong> aquatic invertebrates at basin <strong>and</strong> intensity site groups in<br />
southwestern Louisiana, 2001 (data listed in appendix 8).<br />
MEDIAN ABUNDANCE OF ORGANISMS<br />
PER SQUARE METER<br />
1,800<br />
1,600<br />
1,400<br />
1,200<br />
1,000<br />
800<br />
600<br />
400<br />
200<br />
0<br />
LARGE<br />
BASIN<br />
SMALL<br />
BASIN<br />
HIGH<br />
INTENSITY<br />
STUDY-DESIGN SITE GROUPS<br />
LOW<br />
INTENSITY<br />
Other Noninsects (hydras,<br />
flatworms, roundworms,<br />
leeches, <strong>and</strong> arthropods)<br />
STUDY-DESIGN SITE GROUPS<br />
LARGE BASIN- Drainage area ><br />
70 square miles<br />
SMALL BASIN- Drainage area <<br />
70 square miles<br />
HIGH INTENSITY- Percentage <strong>of</strong><br />
drainage area used for rice<br />
cultivation > 45 percent<br />
LOW INTENSITY- Percentage <strong>of</strong><br />
drainage area used for rice<br />
cultivation < 45 percent<br />
EXPLANATION<br />
ABUNDANCE OF ORGANISMS<br />
Aquatic invertebrates<br />
Chironomidae (midges)<br />
Tanytarsini midges<br />
STUDY-DESIGN SITE GROUPS<br />
LARGE BASIN- Drainage area ><br />
70 square miles<br />
SMALL BASIN- Drainage area <<br />
70 square miles<br />
HIGH INTENSITY- Percentage <strong>of</strong><br />
drainage area used for rice<br />
cultivation > 45 percent<br />
LOW INTENSITY- Percentage <strong>of</strong><br />
drainage area used for rice<br />
cultivation < 45 percent<br />
Figure 15. Median abundances <strong>of</strong> aquatic invertebrates, Chironomidae (midges), <strong>and</strong> Tanytarsini midges<br />
at basin <strong>and</strong> intensity site groups in southwestern Louisiana, 2001 (data listed in appendix 8).<br />
33
habitat conditions associated with drainage area than by<br />
conditions associated with agricultural intensity.<br />
The abundance-weighted tolerance (biotic index)<br />
results were consistent with composition metrics results<br />
<strong>and</strong> indicated most tolerant organisms occurred at highintensity<br />
sites, mainly the large high-intensity sites<br />
(table 9). The abundance-weighted values were calculated<br />
by weighting the tolerance value by the abundance<br />
<strong>of</strong> the organism in the sample. Tolerance values were<br />
based on a scale from 0 to 10, where 0 represented the<br />
tolerance value <strong>of</strong> an extremely sensitive organism <strong>and</strong><br />
10 represented the value for a tolerant organism. Thus,<br />
a higher abundance-weighted tolerance value indicated<br />
that the communities at these sites were composed <strong>of</strong><br />
more organisms considered tolerant to many types <strong>of</strong><br />
stress associated with stream disturbance. Median abundance-weighted<br />
tolerance was greater at the high-intensity<br />
sites (7.11) than at the low-intensity sites (6.18).<br />
Canonical Correspondence Analysis Site<br />
Groups<br />
For this report, CCA (ter Braak <strong>and</strong> Smilauer, 1998)<br />
was used to evaluate patterns among sites based on the<br />
relative abundance <strong>of</strong> aquatic invertebrates <strong>and</strong> <strong>environmental</strong><br />
variables. The CCA <strong>and</strong> the forward selection<br />
process reduced 36 <strong>environmental</strong> variables to 4 that best<br />
described the relations among <strong>water</strong> <strong>quality</strong>, habitat, <strong>and</strong><br />
invertebrate communities among sites. The CCA identified<br />
four significant (p ≤ 0.05) <strong>environmental</strong> variables<br />
(instream cover score, percentage <strong>of</strong> open canopy, concentrations<br />
<strong>of</strong> dissolved oxygen, <strong>and</strong> maximum concentration<br />
<strong>of</strong> dissolved fipronil) that described the distribution<br />
<strong>of</strong> aquatic invertebrate communities among <strong>ecological</strong><br />
data-collection sites (fig. 16). The first CCA axis<br />
represents the dissolved oxygen <strong>and</strong> open canopy gradient,<br />
<strong>and</strong> the second CCA axis represents the instream<br />
cover <strong>and</strong> fipronil concentration gradient. The labeled<br />
34<br />
arrows (vectors) in the CCA biplot indicate spatial associations<br />
<strong>of</strong> site <strong>and</strong> species scores with <strong>environmental</strong><br />
variables. The value <strong>of</strong> the <strong>environmental</strong> variable<br />
increases in the direction the vector points. The length <strong>of</strong><br />
the vector reflects the importance <strong>of</strong> the <strong>environmental</strong><br />
variable in the CCA model. Vectors parallel to an axis<br />
are highly correlated with that axis <strong>and</strong> vectors perpendicular<br />
to an axis are poorly correlated with that axis<br />
(table 10).<br />
Cluster analysis using site scores from the first two<br />
CCA axes (Wilkinson <strong>and</strong> others, 1998) identified four<br />
site groups (A, B, C, <strong>and</strong> D) that had similar <strong>water</strong> <strong>quality</strong>,<br />
habitat, <strong>and</strong> aquatic invertebrate characteristics.<br />
These site groups were geographically separated within<br />
the study (fig. 17). Group A included 2 sites in the northern<br />
part <strong>of</strong> the Mermentau River Basin <strong>and</strong> 1 site in the<br />
adjacent Calcasieu River Basin. Other sites, all in the<br />
Mermentau River Basin, were grouped as follows: 4 sites<br />
in the southeastern part <strong>of</strong> the basin (group B), 6 sites in<br />
the north-central <strong>and</strong> southeastern parts (group C), <strong>and</strong> 6<br />
in the south-central <strong>and</strong> southwestern parts (group D).<br />
Discriminate analysis (Engelman, 1998) showed statistical<br />
significance (Wilk’s lambda = 0.014, p ≤ 0.001) <strong>of</strong><br />
cluster analysis site group assignments with 89 percent<br />
<strong>of</strong> sites correctly classified to CCA site groups.<br />
Figure 16 shows the distribution <strong>of</strong> <strong>ecological</strong> datacollection<br />
sites <strong>and</strong> site groups in relation to CCA <strong>environmental</strong><br />
variables. The highest instream cover <strong>and</strong><br />
smallest fipronil concentrations were present at sites in<br />
group A. Sites in group B were characterized by moderate<br />
instream cover, open canopy, <strong>and</strong> dissolved oxygen<br />
concentrations, <strong>and</strong> small fipronil concentrations. Group<br />
C sites were characterized by large dissolved-oxygen <strong>and</strong><br />
fipronil concentrations. The largest amount <strong>of</strong> open canopy<br />
<strong>and</strong> the smallest dissolved-oxygen concentrations<br />
were present at sites in group D. Figure 16 also shows<br />
the CCA distribution <strong>of</strong> relative abundances <strong>of</strong> aquatic<br />
Table 10. Canonical correlation coefficients <strong>of</strong> <strong>environmental</strong> variables with the first four canonical correspondence<br />
analysis axes for aquatic invertebrates at <strong>ecological</strong> data-collection sites in southwestern Louisiana, 2001<br />
[Numbers in parentheses are eigenvalues]<br />
Canonical correspondence analysis model<br />
<strong>environmental</strong> variables<br />
Axis 1<br />
(0.31)<br />
Axis 2<br />
(0.18)<br />
Axis 3<br />
(0.16)<br />
Axis 4<br />
(0.09)<br />
Open canopy 0.67 0.16 0.14 0.80<br />
Instream cover - .21 .32 - .80 .56<br />
Dissolved oxygen - .64 - .51 .14 .69<br />
Dissolved fipronil (maximum) < .01 - .96 - .53 - .07<br />
Cumulative percent <strong>of</strong> species variance explained 16.0 25.4 33.6 38.4<br />
Cumulative percent <strong>of</strong> species-environment variance explained 41.8 66.2 87.4 100
CCA AXIS 1<br />
CCA AXIS 1<br />
1.0<br />
0.5<br />
0<br />
-0.5<br />
-1.0<br />
1.0<br />
0.5<br />
0<br />
-0.5<br />
-1.0<br />
-1.0<br />
A<br />
GROUP A<br />
Whisky<br />
Blue<br />
Boggy<br />
Dissolved<br />
oxygen<br />
concentration<br />
B<br />
Rheocric<br />
Dissolved<br />
oxygen<br />
concentration<br />
Caney<br />
Instream<br />
cover score<br />
Guidry<br />
Instream<br />
cover score<br />
Corynon<br />
Rheotany<br />
Enchidae<br />
Nezpique<br />
Wik<strong>of</strong>f<br />
GROUP B<br />
Mallet<br />
Church<br />
Point<br />
Theriot<br />
Castor<br />
Upper<br />
Des Cannes<br />
GROUP C<br />
Lirceus<br />
Criortho<br />
Gr<strong>and</strong><br />
Marais<br />
Chironom<br />
Chpsyche<br />
Atrichop<br />
Crangony<br />
Thienema<br />
Tribelos<br />
Tubfidae<br />
Cricotop<br />
Tanytars<br />
Mictanyt<br />
Bezzpalp<br />
Dicdipes<br />
Physella<br />
Tropist<br />
Caenis<br />
Enochrus<br />
Megadril<br />
Acari<br />
Turbell<br />
Nematoda<br />
Collemb<br />
Scirtdae<br />
Naididae<br />
Nanoclad<br />
Micromen Eo r pidae<br />
Mermentau<br />
Des Cannes<br />
Plaquemine<br />
Percentage<br />
open<br />
canopy<br />
Tortue<br />
East Lacassine<br />
Lacassine<br />
GROUP D<br />
Maximum dissolved<br />
fipronil concentration<br />
Hydra<br />
Hydrinae<br />
Ablabesm<br />
Hedrodon<br />
Glydipes<br />
Percentage<br />
open<br />
canopy<br />
Hyazteca<br />
Maximum dissolved<br />
fipronil concentration<br />
-0.5 0<br />
CCA AXIS 2<br />
-0.5<br />
1.0<br />
Instream<br />
cover<br />
score<br />
Church<br />
Point<br />
Glydipes<br />
SPECIES GROUPS<br />
EXPLANATION<br />
Environmental variable <strong>and</strong><br />
variable name<br />
Species <strong>and</strong> species<br />
abbreviation (See appendix 8<br />
for scientific names)<br />
GROUP A CCA site group<br />
Chironomidae (midges)<br />
Othrocladiinae midges<br />
Tanytarsini midges<br />
Ephemeroptera, Plechoptera, Trichoptera<br />
Noninsects<br />
Other insects<br />
Ecological sampling site <strong>and</strong><br />
abbreviation (See table 1 <strong>and</strong><br />
appendix 1 for site names)<br />
BASIN AND INTENSITY SITE GROUPS<br />
Small basin site with low intensity<br />
Small basin site with high intensity<br />
Large basin site with low intensity<br />
Large basin site with high intensity<br />
Figure 16. Canonical correspondence analysis (CCA) ordination biplot showing site (A) <strong>and</strong> species (B) locations<br />
in relation to <strong>environmental</strong> variables <strong>of</strong> <strong>ecological</strong> data-collection sites in southwestern Louisiana, 2001. The<br />
<strong>environmental</strong> variables shown are related significantly (p≤0.05) to one or more <strong>of</strong> the CCA axes. The value <strong>of</strong> the<br />
<strong>environmental</strong> variable increases in the direction the arrow (vector) points. The length <strong>of</strong> the vector reflects the<br />
importance <strong>of</strong> an <strong>environmental</strong> variable <strong>and</strong> direction <strong>of</strong> influence in the CCA model.<br />
35
invertebrate species in relation to <strong>environmental</strong> variables.<br />
Communities at large-basin sites tended to vary<br />
along the dissolved-oxygen <strong>and</strong> open-canopy gradient,<br />
whereas communities at small-basin sites tended to vary<br />
along the instream-cover <strong>and</strong> fipronil-concentration gradient.<br />
Water-Quality Characteristics<br />
Significant statistical differences (p ≤ 0.05) in<br />
<strong>water</strong>-<strong>quality</strong> characteristics occurred among CCA site<br />
groups (table 11). Median values were smallest for 17<br />
<strong>water</strong>-<strong>quality</strong> variables at group A sites <strong>and</strong> largest for<br />
11 <strong>water</strong>-<strong>quality</strong> variables at group B sites. Median values<br />
<strong>of</strong> turbidity, <strong>and</strong> concentrations <strong>of</strong> total ammonia<br />
37<br />
plus organic nitrogen, nitrate, total phosphorus, <strong>and</strong> dissolved<br />
fipronil, were largest at group C sites. Group D<br />
sites were characterized by midrange concentrations for<br />
all <strong>water</strong>-<strong>quality</strong> variables except concentrations <strong>of</strong> dissolved<br />
oxygen, which were lowest.<br />
Possible explanations for the differences in <strong>water</strong><br />
<strong>quality</strong> among site groups include the differences in (1)<br />
general soil composition <strong>and</strong> drainage characteristics<br />
(Touchet <strong>and</strong> others, 1974), <strong>and</strong> (2) the percentage <strong>of</strong><br />
l<strong>and</strong> used for agriculture in these basins. Drainage areas<br />
for sites in group A are low in agricultural intensity <strong>and</strong><br />
contain pine upl<strong>and</strong>s <strong>and</strong> alluvial terraces. Soils are<br />
acidic <strong>and</strong> loamy with moderate s<strong>and</strong> content <strong>and</strong> are<br />
moderately well-drained. Drainage areas for group B<br />
Table 11. Median <strong>water</strong>-<strong>quality</strong> variables for canonical correspondence analysis (CCA) site groups in<br />
southwestern Louisiana, 2001<br />
[Boldface values indicate significant differences (p ≤ 0.05) among site groups, based on Kruskal-Wallis test; for each variable, values preceded by<br />
the same superscript letter are not significantly different from each other. n, number <strong>of</strong> sites; mg/L, milligrams per liter; µS/cm, microsiemens per<br />
centimeter at 25 degrees Celsius; NTU, nephelometric turbidity units;
sites are mixed in agricultural intensity <strong>and</strong> contain loess<br />
upl<strong>and</strong>s <strong>and</strong> low terrace areas that are influenced by post<br />
prairie-age loess. Soils are loamy with clayey subsoil,<br />
<strong>and</strong> are poorly drained. Drainage areas for group C sites<br />
are mixed in agricultural intensity. Soils contain alluvial<br />
<strong>and</strong> outwash deposits, are loamy with clayey subsoils,<br />
<strong>and</strong> are poorly drained. Increased turbidity <strong>and</strong><br />
increased concentrations <strong>of</strong> nutrients <strong>and</strong> insecticides,<br />
which are normally associated with agricultural activities,<br />
occurred at group C sites. Drainage areas for sites<br />
in group D are high in agricultural activities. Group D<br />
sites contain mixtures <strong>of</strong> upstream <strong>water</strong>, which may<br />
explain the midrange concentrations <strong>of</strong> <strong>water</strong>-<strong>quality</strong><br />
constituents at these sites.<br />
Stream Habitat Characteristics<br />
Water clarity <strong>and</strong> the amount <strong>of</strong> open canopy among<br />
CCA site groups were significantly different (p ≤ 0.05)<br />
(table 12). Streams in group A were clear with little open<br />
canopy. Streams in group B were slightly turbid with<br />
some open canopy. In group C, streams were turbid with<br />
some open canopy; <strong>water</strong> clarity was lowest <strong>and</strong> turbidity<br />
highest in these streams. Streams in group D were<br />
slightly turbid, with open canopy. Median euphotic <strong>and</strong><br />
Secchi disk depths were greater for group A (1.35 m <strong>and</strong><br />
0.66 m) than for group C (0.13 m <strong>and</strong> 0.03 m). Median<br />
values for open canopy differed between group A<br />
(8 percent) <strong>and</strong> group D (65 percent), <strong>and</strong> between<br />
group C (26 percent) <strong>and</strong> group D. Differences in <strong>water</strong><br />
clarity probably were related to agricultural intensity,<br />
whereas differences in the canopy were probably related<br />
to drainage-area characteristics. Differences in <strong>water</strong><br />
clarity <strong>and</strong> open canopy may account for some differences<br />
in aquatic invertebrate communities.<br />
Aquatic Invertebrate Communities<br />
Aquatic invertebrate community metrics were significantly<br />
different (p ≤ 0.05) in the percentage <strong>of</strong> noninsects,<br />
abundance <strong>of</strong> midge taxa, abundance <strong>of</strong> feeding<br />
groups, <strong>and</strong> number <strong>of</strong> tolerant organisms among inten-<br />
38<br />
sity (table 9) <strong>and</strong> CCA (table 13) site groups. Comparable<br />
to the large basin sites with high intensity,<br />
noninsects, notably Amphipods, dominated sites in<br />
group D. Similar to intensity site groups, CCA site<br />
groups differed in abundance <strong>of</strong> total aquatic invertebrates,<br />
midges, <strong>and</strong> Tanytarsini midges. The relative<br />
highest total abundances were at groups A <strong>and</strong> D. The<br />
relative abundance <strong>of</strong> midges, particularly the percentage<br />
<strong>of</strong> Tanytarsini midges, largely accounts for the differences<br />
in total abundance between groups A <strong>and</strong> D.<br />
Diversity metrics were similar between basin <strong>and</strong> intensity<br />
site groups but dominance <strong>and</strong> diversity differed significantly<br />
among CCA site groups. Diversity metrics<br />
differed between groups B <strong>and</strong> C <strong>and</strong> between groups B<br />
<strong>and</strong> D. Although the abundance <strong>and</strong> richness <strong>of</strong> collector-gatherers<br />
were similar among CCA site groups, the<br />
percentage <strong>of</strong> collector-gatherer Orthocladiinae midges<br />
generally was larger in small head<strong>water</strong> streams, particularly<br />
in groups A <strong>and</strong> B. The abundance-weighted tolerance<br />
(biotic index) indicated the most tolerant<br />
organisms typically were present at sites in group D, similar<br />
to large basin sites with high intensity.<br />
Figure 18 shows the composition <strong>of</strong> predominant<br />
invertebrate groups for the CCA site groups. Among all<br />
CCA site groups, the composition <strong>of</strong> predominant invertebrate<br />
groups was most balanced in group B. The greatest<br />
shifts in predominant invertebrate groups was<br />
between groups A <strong>and</strong> D. Diptera dominated group A<br />
(similar to small basins with low intensity) <strong>and</strong> Malacostraca,<br />
especially Amphipoda, dominated site group D<br />
(similar to large basins with high intensity). The median<br />
percentage <strong>of</strong> Amphipoda (table 13) for group D<br />
(38 percent) differed from all other CCA site groups (all<br />
less than 1 percent). The median percentages <strong>of</strong> Mollusca<br />
plus Crustacea (table 13), as well as noninsects<br />
(table 13), differed between group D (45, 58 percent) <strong>and</strong><br />
group A (4, 6 percent) <strong>and</strong> between group C (5, 15 percent)<br />
<strong>and</strong> group D. Although not sampled for aquatic<br />
invertebrates, macrophytes such as <strong>water</strong> hyacinth <strong>and</strong><br />
alligator weed provide good habitat for Molluscs <strong>and</strong><br />
Crustaceans, especially Amphipods, at group D sites.<br />
Table 12. Median stream habitat variables for canonical correspondence analysis (CCA) site groups in southwestern<br />
Louisiana, 2001<br />
[Boldface values indicate significant differences (p ≤ 0.05) among site groups, based on Kruskal-Wallis test; for each variable, values preceded by<br />
the same superscript letter are not significantly different from each other. n, number <strong>of</strong> sites]<br />
Stream-habitat variable<br />
A<br />
(n=3)<br />
B<br />
(n=4)<br />
CCA site groups<br />
C<br />
(n=6)<br />
D<br />
(n=6)<br />
Quantitative measurements<br />
Euphotic depth (meter) 1.35 0.31 0.13 0.21<br />
Open canopy (percent)<br />
a<br />
8 25<br />
a<br />
26<br />
b<br />
65<br />
Secchi disk depth (meter) .66 .09 .03 .08
Table 13. Median aquatic invertebrate metrics for canonical correspondence analysis (CCA) site groups in<br />
southwestern Louisiana, 2001<br />
[Median densities <strong>of</strong> aquatic invertebrates are rounded to the nearest whole number <strong>and</strong> reported as organisms per square meter. Boldface values<br />
indicate significant differences (p ≤ 0.05) among site groups, based on results <strong>of</strong> Kruskal-Wallis test; for each variable, values preceded by the same<br />
superscript letter are not significantly different from each other. n, number <strong>of</strong> sites;
MEDIAN PREDOMINANT INVERTEBRATE<br />
GROUPS, IN PERCENT<br />
MEDIAN ABUNDANCE OF ORGANISMS<br />
PER SQUARE METER<br />
100<br />
90<br />
80<br />
70<br />
60<br />
50<br />
40<br />
30<br />
20<br />
10<br />
0<br />
Figure 18. Composition <strong>of</strong> predominant groups <strong>of</strong> aquatic invertebrates at canonical correspondence<br />
analysis (CCA) site groups in southwestern Louisiana, 2001 (data listed in appendix 8).<br />
2,500<br />
2,000<br />
1,500<br />
1,000<br />
500<br />
0<br />
GROUP A GROUP B GROUP C GROUP D<br />
CCA SITE GROUPS<br />
GROUP A GROUP B<br />
CCA SITE GROUPS<br />
GROUP C GROUP D<br />
Mollusca<br />
(gastropods <strong>and</strong> bivalves)<br />
Oligochaeta<br />
(aquatic worms)<br />
EXPLANATION<br />
Ephemeroptera, Plecoptera, Trichoptera<br />
(mayflies, stoneflies, <strong>and</strong> caddisflies)<br />
Coleoptera<br />
(beetles)<br />
Diptera<br />
(true flies <strong>and</strong> midges)<br />
Other Insects<br />
(springtails, hellgrammites, dobson,<br />
damsel <strong>and</strong> dragonflies)<br />
Malacostraca<br />
(amphipods, decapods, <strong>and</strong> isopods)<br />
Other Noninsects<br />
(hydras, flatworms, roundworms,<br />
leeches, <strong>and</strong> arthropods)<br />
EXPLANATION<br />
Aquatic invertebrates<br />
Chironomidae (midges)<br />
Tanytarsini midges<br />
Figure 19. Median abundances <strong>of</strong> aquatic invertebrates, Chironomidae (midges), <strong>and</strong> Tanytarsini midges<br />
at canonical correspondence analysis (CCA) site groups in southwestern Louisiana, 2001 (data listed in<br />
appendix 8).<br />
40
Median abundance <strong>and</strong> richness as measures <strong>of</strong><br />
feeding differed among CCA groups (table 13). Unlike<br />
results for basin <strong>and</strong> intensity site groups, abundance <strong>and</strong><br />
richness <strong>of</strong> collector-gatherers except Orthocladiinae<br />
midges were similar among CCA groups. Orthocladiinae<br />
midge abundances were more than five times higher<br />
in groups A (13 percent) <strong>and</strong> B (15 percent) than in<br />
groups C (2 percent) <strong>and</strong> D (2 percent). Orthocladiinae<br />
midge richness was higher in groups A (5) <strong>and</strong> B (4) than<br />
in groups C (2) <strong>and</strong> D (2). Omnivores were present only<br />
at low-intensity sites <strong>and</strong> in groups A <strong>and</strong> B. Median<br />
abundance <strong>of</strong> omnivores was highest in group A (17).<br />
The abundance-weighted tolerance values (biotic<br />
index) were highest for group D sites (table 13) <strong>and</strong> large<br />
basin sites with high intensity (table 9). The median<br />
abundance-weighted tolerance values differed between<br />
groups A (5.92) <strong>and</strong> D (7.51). Patterns in abundanceweighted<br />
tolerance were similar for basin <strong>and</strong> intensity<br />
site groups <strong>and</strong> CCA site groups, <strong>and</strong> indicated greater<br />
abundance <strong>of</strong> sensitive organisms at low-intensity sites.<br />
Relations Between Species <strong>and</strong><br />
Environmental Variables<br />
Scatter plots were used to evaluate relations<br />
between aquatic invertebrates <strong>and</strong> significant <strong>environmental</strong><br />
variables from the CCA model. One genus <strong>of</strong> tolerant<br />
mayfly, Caenis, <strong>and</strong> one genus <strong>of</strong> midge,<br />
Rheotanytarsus, were selected to illustrate these relations.<br />
These species were selected because <strong>of</strong> their wide<br />
distribution among <strong>ecological</strong> data-collection sites <strong>and</strong><br />
because the observed patterns were common for many<br />
other species. The <strong>environmental</strong> variables used for the<br />
evaluation were instream cover score, percentage <strong>of</strong> open<br />
canopy, concentrations <strong>of</strong> dissolved oxygen, <strong>and</strong> maximum<br />
concentrations <strong>of</strong> dissolved fipronil.<br />
The relative abundance <strong>of</strong> Caenis sp. (fig. 20)<br />
decreased with increasing instream cover <strong>and</strong> fipronil<br />
concentrations but showed little to no relation to<br />
dissolved-oxygen concentrations or open canopy.<br />
Caenis sp. abundance may be an indicator <strong>of</strong> <strong>water</strong> <strong>quality</strong><br />
in streams influenced by fipronil because this species<br />
exhibits little sensitivity to most <strong>environmental</strong> variables<br />
except increasing instream cover <strong>and</strong> concentrations <strong>of</strong><br />
fipronil. Tanytarsini midges, particularly Rheotanytarsus<br />
sp. (fig. 20), were similarly sensitive to fipronil as<br />
Caenis sp., but also to other <strong>environmental</strong> variables.<br />
Relative abundance <strong>of</strong> Rheotanytarsus sp. increased as<br />
dissolved oxygen <strong>and</strong> instream cover increased, <strong>and</strong><br />
decreased as open canopy increased. Relative abundance<br />
<strong>of</strong> Orthocladiinae midges <strong>and</strong> the amphipod, Hyalella<br />
azteca, were similar to that <strong>of</strong> Rheotanytarsus sp. in similar<br />
habitats. Orthocladiinae midges may be an indicator<br />
<strong>of</strong> <strong>water</strong> <strong>quality</strong> for small-basin sites. Hyalella azteca<br />
41<br />
favored large-basin sites, notably those with high agricultural<br />
intensity. The Hyalella azteca amphipod<br />
decreased in relative abundance as dissolved oxygen<br />
increased, <strong>and</strong> increased as open canopy increased.<br />
Ali <strong>and</strong> others (1998) showed two species <strong>of</strong> chironomid<br />
(midge) larvae were highly susceptible to<br />
fipronil. In the study described in this report, scatter<br />
plots (fig. 20) indicate that an increase in the maximum<br />
concentration <strong>of</strong> dissolved fipronil was the only significant<br />
<strong>environmental</strong> variable in the CCA model that was<br />
related to consistent decreases in relative abundance for<br />
many species, notably midges. The degradation products<br />
<strong>of</strong> fipronil also are toxic. The USEPA (1996) states that<br />
fipronil sulfone is 6.6 times more toxic, <strong>and</strong> fipronil sulfide<br />
is 1.9 times more toxic to fresh<strong>water</strong> invertebrates<br />
than the parent compound. Findings in this study were<br />
similar to those <strong>of</strong> the USEPA: Relative abundances for<br />
many species decreased at lower concentrations <strong>of</strong><br />
fipronil degradation products (fipronil sulfone, fipronil<br />
sulfide, <strong>and</strong> desulfinylfipronil) than <strong>of</strong> the fipronil parent<br />
compound. Demcheck <strong>and</strong> Skrobialowski (2003) concluded<br />
these fipronil degradation products accumulate in<br />
bed sediment, <strong>and</strong> concentrations generally increase<br />
from head<strong>water</strong> streams to the mainstem <strong>of</strong> the Mermentau<br />
River. This possibly would explain the negative<br />
response between aquatic invertebrate abundance <strong>and</strong><br />
fipronil.<br />
SUMMARY AND CONCLUSIONS<br />
A study was completed in the Mermentau River<br />
Basin in 2001 to better underst<strong>and</strong> the relations among<br />
ground-<strong>water</strong> <strong>and</strong> surface-<strong>water</strong> <strong>and</strong> bed-sediment <strong>quality</strong>;<br />
aquatic invertebrate communities; <strong>and</strong> habitat conditions<br />
with respect to l<strong>and</strong> use <strong>and</strong> agricultural intensity.<br />
The study area is located entirely within the Acadian<br />
Pontchartrain Study Unit, a part <strong>of</strong> the National Water-<br />
Quality Assessment Program. Water from wells <strong>and</strong><br />
streams used to irrigate ricefields is returned to streams<br />
<strong>and</strong> bayous <strong>and</strong> may return to the ground through infiltration,<br />
be used downstream for agriculture, or drain to<br />
the Gulf <strong>of</strong> Mexico. Low-gradient streams with bidirectional<br />
flow, modifications for navigation, <strong>and</strong> <strong>water</strong> control<br />
structures are characteristic <strong>of</strong> the hydrology in the<br />
study area. The northwestern part <strong>of</strong> the study area is<br />
mostly forested <strong>and</strong> l<strong>and</strong> in the remainder <strong>of</strong> the study<br />
area is used for rice agriculture. Throughout the study<br />
area, a drought occurred in 1999 <strong>and</strong> intensified to<br />
extreme conditions in 2000. Soils contain more s<strong>and</strong> <strong>and</strong><br />
are moderately well drained in the northwestern part <strong>of</strong><br />
the study area, are loamy <strong>and</strong> clayey in the center <strong>and</strong><br />
south, <strong>and</strong> contain thick loess deposits in the southeastern<br />
part.
RELATIVE ABUNDANCE OF CAENIS SP. (MAYFLY)<br />
30<br />
20<br />
10<br />
0<br />
0 5 10 15 20 25<br />
0<br />
0 5 10 15 20 25<br />
30<br />
INSTREAM COVER SCORE<br />
40<br />
20<br />
10<br />
0<br />
0 10 20 30 40 50 60 70 80<br />
0<br />
0 10 20 30 40 50 60 70 80<br />
30<br />
PERCENTAGE OPEN CANOPY<br />
40<br />
20<br />
10<br />
0<br />
3 4 5 6 7 8 9 10<br />
30<br />
20<br />
10<br />
0<br />
0 1 2 3 4 5 6 7<br />
DISSOLVED OXYGEN, IN MILLIGRAMS PER LITER<br />
40<br />
MAXIMUM DISSOLVED FIPRONIL, IN MICROGRAMS PER LITER<br />
40<br />
30<br />
20<br />
10<br />
30<br />
20<br />
10<br />
0<br />
3 4 5 6 7 8 9 10<br />
30<br />
20<br />
10<br />
0<br />
0 1 2 3 4 5 6 7<br />
Figure 20. Relative abundances <strong>of</strong> Caenis sp. (mayfly) <strong>and</strong> Rheotanytarsus sp. (midge), <strong>and</strong> significant habitat <strong>and</strong><br />
<strong>water</strong>-<strong>quality</strong> variables identified by canonical correspondence analysis (CCA) for <strong>ecological</strong> data-collection sites in<br />
southwestern Louisiana, 2001. Increases in concentration <strong>of</strong> maximum dissolved fipronil was the only significant<br />
variable in the CCA model that was related to consistent decreases in relative abundance for many species.<br />
42<br />
30<br />
20<br />
10<br />
RELATIVE ABUNDANCE OF RHEOTANYTARSUS SP. (MIDGE)
Water-<strong>quality</strong> data were compared to drinking<strong>water</strong><br />
<strong>and</strong> aquatic-life criteria <strong>and</strong> bed-sediment data<br />
were compared to aquatic-life criteria. Water-<strong>quality</strong><br />
data were analyzed statistically <strong>and</strong> related to agricultural<br />
l<strong>and</strong>-use intensity. Samples from 29 wells <strong>and</strong> 24<br />
stream sites analyzed for selected nutrients, major inorganic<br />
ions, <strong>and</strong> pesticides indicate the following:<br />
Nutrients<br />
Concentrations <strong>of</strong> nutrients <strong>and</strong> major inorganic<br />
ions in ground <strong>and</strong> surface <strong>water</strong> generally were<br />
largest in the southeastern part <strong>of</strong> the study area, an<br />
area <strong>of</strong> intense agriculture.<br />
The only drinking <strong>water</strong> regulation exceeded in a<br />
ground-<strong>water</strong> sample was that for nitrate in a well<br />
located in an area previously used for raising poultry<br />
<strong>and</strong> swine.<br />
Concentrations <strong>of</strong> nutrients from ground <strong>water</strong> used<br />
for agricultural irrigation were not high enough to<br />
contribute to eutrophication in surface <strong>water</strong>.<br />
The greatest potential for eutrophic conditions in<br />
surface <strong>water</strong>, based on nutrient thresholds,<br />
occurred March-May, at about the same time or<br />
shortly after ricefields were drained.<br />
Major Inorganic Ions <strong>and</strong> Trace Elements<br />
Secondary Maximum Contaminant Levels established<br />
by the U.S. Environmental Protection<br />
Agency were exceeded in samples from 20 wells—<br />
sulfate in 1 well, chloride in 4 wells, iron in 7 wells,<br />
<strong>and</strong> manganese in 17 wells.<br />
Secondary Maximum Contaminant Levels were<br />
exceeded in samples from all surface-<strong>water</strong> sites—<br />
iron at 8 sites, <strong>and</strong> manganese at all sites.<br />
The maximum concentrations <strong>of</strong> sodium <strong>and</strong> chloride<br />
in surface <strong>water</strong> occurred at Bayou Lacassine<br />
near Lake Arthur <strong>and</strong> probably resulted from salt<strong>water</strong><br />
intrusion induced by reverse flow during the<br />
drought.<br />
Pesticides<br />
Fewer pesticides <strong>and</strong> degradation products were<br />
detected in ground <strong>water</strong> than in surface <strong>water</strong>.<br />
Concentrations were lower in ground <strong>water</strong> than in<br />
surface <strong>water</strong>, <strong>and</strong> did not exceed drinking <strong>water</strong> or<br />
aquatic life criteria. Concentrations were detected<br />
in less than 1 percent <strong>of</strong> all analyses; 19 pesticides<br />
<strong>and</strong> degradation products were detected in samples<br />
from 11 wells.<br />
Pesticides <strong>and</strong> degradation products most frequently<br />
detected in ground <strong>water</strong> were the herbicides<br />
bentazon <strong>and</strong> atrazine.<br />
Concentrations <strong>of</strong> 47 pesticides <strong>and</strong> degradation<br />
products were detected in surface <strong>water</strong>. At least 3<br />
43<br />
pesticides were detected in all surface-<strong>water</strong> samples.<br />
In 72 percent <strong>of</strong> the samples at least<br />
5 hydrophylic pesticides were detected, <strong>and</strong> in more<br />
than 70 percent <strong>of</strong> the samples at least 3 hydrophobic<br />
pesticides were detected.<br />
Although atrazine concentrations in three surface<strong>water</strong><br />
samples exceeded 3 µg/L (micrograms per<br />
liter), the Maximum Contaminant Level established<br />
by the U.S. Environmental Protection Agency was<br />
not exceeded because it is based on an annual average<br />
<strong>of</strong> quarterly samples. Concentrations larger<br />
than 3.0 µg/L were not detected in samples collected<br />
during other times <strong>of</strong> the year, <strong>and</strong> the average<br />
annual concentrations did not exceed 3 µg/L for<br />
sites sampled throughout the year.<br />
Pesticides concentrations in surface <strong>water</strong> exceeded<br />
aquatic-life criteria for atrazine (1.8 µg/L), tebuthiuron<br />
(1.6 µg/L), <strong>and</strong> malathion (0.1 µg/L).<br />
Fipronil was detected in concentrations exceeding<br />
the numeric targets for acute total maximum daily<br />
loads (2.30 µg/L) at 3 surface-<strong>water</strong> sites <strong>and</strong> the<br />
numeric targets for chronic total maximum daily<br />
loads (4.6 µg/L) at 14 sites.<br />
Maximum pesticide concentrations in surface <strong>water</strong><br />
usually occurred in the spring at about the same<br />
time or shortly after ricefields were drained.<br />
Concentrations <strong>of</strong> DDE in bed sediment at Des<br />
Cannes <strong>and</strong> Church Point sites exceeded interim<br />
fresh<strong>water</strong> sediment-<strong>quality</strong> guidelines for the protection<br />
<strong>of</strong> aquatic life.<br />
Fipronil sulfide was detected at all bed-sediment<br />
sites, but there are no current (2002) guidelines with<br />
which to evaluate the <strong>environmental</strong> effects <strong>of</strong><br />
fipronil <strong>and</strong> degradation products.<br />
The study design, based on drainage basin area <strong>and</strong><br />
agricultural l<strong>and</strong>-use intensity, was used to determine<br />
differences in natural <strong>and</strong> human-related influences on<br />
surface-<strong>water</strong> <strong>quality</strong> at 19 <strong>ecological</strong> data-collection<br />
sites. Aquatic invertebrate communities were used as<br />
<strong>indicators</strong> <strong>of</strong> surface-<strong>water</strong> <strong>quality</strong> <strong>and</strong> habitat conditions<br />
at these sites. Canonical correspondence analysis (CCA)<br />
identified four significant <strong>environmental</strong> variables<br />
(instream cover score, percentage <strong>of</strong> open canopy, <strong>and</strong><br />
concentrations <strong>of</strong> dissolved oxygen <strong>and</strong> maximum dissolved<br />
fipronil) that described the distribution <strong>of</strong> aquatic<br />
invertebrate communities among <strong>ecological</strong> data-collection<br />
sites. Cluster analysis revealed four site groups<br />
which separated <strong>ecological</strong> data-collection sites geographically<br />
within the study. Environmental data <strong>and</strong><br />
aquatic invertebrate metrics within the study design <strong>and</strong><br />
CCA-assigned site groups were compared <strong>and</strong> indicate<br />
the following:
Stream habitat ratings using RBP habitat characterizations<br />
were rated optimal to marginal for all <strong>ecological</strong><br />
data-collection sites; ratings for 16 sites<br />
were rated optimal to suboptimal.<br />
Generally, median bank erosion scores <strong>and</strong> median<br />
measurements <strong>of</strong> bankfull <strong>and</strong> wetted channel<br />
widths were greatest at all site groups with large<br />
drainage areas.<br />
Generally, the median bank stability index <strong>and</strong> pool<br />
substrate characterization score were lowest at all<br />
site groups with high agricultural intensity.<br />
Median values were lowest for 17 <strong>water</strong>-<strong>quality</strong><br />
variables at group A sites <strong>and</strong> highest for 11 <strong>water</strong><strong>quality</strong><br />
variables at group B sites.<br />
Possible explanations for the differences in <strong>water</strong><br />
<strong>quality</strong> among site groups include the differences in<br />
general soil types <strong>and</strong> agricultural l<strong>and</strong> use in these<br />
basins.<br />
Increased turbidity <strong>and</strong> concentrations <strong>of</strong> nutrients<br />
<strong>and</strong> insecticides, which normally are associated<br />
with agricultural activities, occurred at group C<br />
sites.<br />
Water clarity <strong>and</strong> the amount <strong>of</strong> open canopy differed<br />
among CCA site groups.<br />
Organisms tolerant <strong>of</strong> turbidity, organic enrichment,<br />
<strong>and</strong> low dissolved-oxygen concentrations are common<br />
in the study <strong>and</strong> dominated the aquatic invertebrate<br />
community.<br />
Aquatic invertebrate communities at large-basin<br />
sites tended to vary along the dissolved-oxygen <strong>and</strong><br />
open-canopy gradient, whereas communities at<br />
small-basin sites tended to vary along the instreamcover<br />
<strong>and</strong> fipronil-concentration gradient.<br />
Aquatic invertebrate communities were significantly<br />
different in percentage <strong>of</strong> noninsects, abundance<br />
a<strong>of</strong> midge taxa, abundance <strong>of</strong> feeding groups,<br />
<strong>and</strong> number <strong>of</strong> tolerant organisms among intensity<br />
<strong>and</strong> CCA site groups.<br />
Diversity metrics were similar among study-design<br />
site groups but significant differences in dominance<br />
<strong>and</strong> diversity occurred among CCA site groups.<br />
In this study, the maximum concentration <strong>of</strong> dissolved<br />
fipronil was the only significant <strong>environmental</strong><br />
variable related to consistent decreases in<br />
relative abundance for many species, notably<br />
midges.<br />
Relative abundances for many species decreased at<br />
lower concentrations <strong>of</strong> the fipronil degradation<br />
products (fipronil sulfone, fipronil sulfide, <strong>and</strong> desulfinylfipronil)<br />
than <strong>of</strong> the fipronil parent compound.<br />
44<br />
REFERENCES CITED<br />
Ali, Arshad, Nayar, J.K., <strong>and</strong> Gu, W.D., 1998, Toxicity<br />
<strong>of</strong> a phenyl pyrazole insecticide, fipronil, to mosquito<br />
<strong>and</strong> chironomid midge larvae in the laboratory:<br />
Journal <strong>of</strong> the American Mosquito Control Assoc.,<br />
v. 14, no. 2, p. 216-218.<br />
Allain, Larry, Vidrine, Malcolm, Grafe, Vicki, Allen,<br />
Charles, <strong>and</strong> Johnson, Steve, 2000, Paradise lost? The<br />
Coastal Prairie <strong>of</strong> Louisiana <strong>and</strong> Texas: U.S. Fish <strong>and</strong><br />
Wildlife Service, 39 p.<br />
Avery, Jimmy, <strong>and</strong> Lorio, Wendell, 1999, Louisiana<br />
Cooperative Extension Service, Crawfish production<br />
manual: Baton Rouge, La., Louisiana State University<br />
Agricultural Center, Pub. 2637, 38 p.<br />
Barbour, M.T., Gerritsen, Jeroen, Snyder, B.D., <strong>and</strong><br />
Stribling, J.B., 1999, Rapid Bioassessment Protocols<br />
for use in streams <strong>and</strong> wadeable rivers—Periphyton,<br />
benthic macroinvertebrates <strong>and</strong> fish (2d ed.):<br />
Washington, D.C., U.S. Environmental Protection<br />
Agency, Office <strong>of</strong> Water, EPA-841-B-99-002, 339 p.<br />
Brower, J.E., <strong>and</strong> Zar, J.H., 1984, Field <strong>and</strong> laboratory<br />
methods for general ecology (2d ed.): Dubuque, Iowa,<br />
Wm. C. Brown Publishers, p. 226.<br />
Brown, C.A., 1972, Wildflowers <strong>of</strong> Louisiana <strong>and</strong><br />
adjoining states: Baton Rouge, La., Louisiana State<br />
University Press, 247 p.<br />
Canadian Council <strong>of</strong> Ministers <strong>of</strong> the Environment,<br />
1999, Canadian <strong>environmental</strong> <strong>quality</strong> guidelines,<br />
Canadian sediment <strong>quality</strong> guidelines for the<br />
protection <strong>of</strong> aquatic life—Summary tables, exerpt<br />
from Publication no. 1299, ISBN 1-896997-34-1:<br />
accessed March 1, 2001, at URL<br />
http://www.ec.gc.ca/ceqg-rcqe/sedtbl_e.PDF<br />
Canadian Council <strong>of</strong> Ministers <strong>of</strong> the Environment,<br />
2001, Canadian <strong>water</strong> <strong>quality</strong> guidelines for the<br />
protection <strong>of</strong> aquatic life—Summary table, Canadian<br />
<strong>environmental</strong> <strong>quality</strong> guidelines, 1999: Winnipeg,<br />
Canadian Council <strong>of</strong> Ministers <strong>of</strong> the Environment,<br />
7p.<br />
Connelly, Pete, 2001, Environmental fate <strong>of</strong> fipronil:<br />
California Environmental Protection Agency, Department<br />
<strong>of</strong> Pesticide Regulation: accessed on October 16,<br />
2002, at URL<br />
http://www.pw.ucr.edu/textfiles/fipronil.pdf<br />
Cuffney, T.F., Gurtz, M.E., <strong>and</strong> Meador, M.R., 1993,<br />
Methods for collecting benthic invertebrate samples as<br />
part <strong>of</strong> the National Water-Quality Assessment Program:<br />
U.S. Geological Survey Open-File Report 93-<br />
406, 66 p.
Demas, C.R., Demcheck, D.K., Anderson, M.L., <strong>and</strong><br />
Garon, J.D., 1999, National Water-Quality Assessment<br />
Program—Acadian-Pontchartrain Study Unit:<br />
U.S. Geological Survey Fact Sheet FS-185-99, 4 p.<br />
Demcheck, D.K., 1994, Louisiana hydrologic atlas map<br />
no. 7: Water-<strong>quality</strong> survey <strong>of</strong> the Mermentau River<br />
Basin, 1989-90: U.S. Geological Survey Water-<br />
Resources Investigations Report 92-4181, 3 sheets.<br />
Demcheck, D.K., <strong>and</strong> Skrobialowski, S.C., 2003,<br />
Fipronil <strong>and</strong> degradation products in the rice-producing<br />
areas <strong>of</strong> the Mermentau River Basin, Louisiana,<br />
February-September 2000: U.S. Geological Survey<br />
Fact Sheet FS-010-03, 6 p.<br />
DeWalt, R.E., 1997, Fish <strong>and</strong> macroinvertebrate taxonomic<br />
richness, habitat <strong>quality</strong>, <strong>and</strong> in-situ <strong>water</strong><br />
chemistry <strong>of</strong> ecoregion reference streams in the Western<br />
Gulf Coastal Plains <strong>and</strong> Terrace Upl<strong>and</strong>s Ecoregions<br />
<strong>of</strong> southern Louisiana: Prepared for Louisiana<br />
Department <strong>of</strong> Environmental Quality, 72 p.<br />
Dodds, W.K., Jones, J.R., <strong>and</strong> Welch, E.B., 1998, Suggested<br />
classification <strong>of</strong> stream trophic state—distributions<br />
<strong>of</strong> temperate stream types by chlorophyll, total<br />
nitrogen, <strong>and</strong> phosphorus: Water Research, v. 32, no.<br />
5, p. 1455-1462.<br />
Engelman, Laszlo, 1998, Discriminant analysis, in<br />
SYSTAT 8.0 Statistics, Wilkinson, Lel<strong>and</strong> (ed.):<br />
Chicago, SPSS Inc., p. 245-296.<br />
Fishman, M.J., <strong>and</strong> Friedman, L.C., 1989, Methods for<br />
determination <strong>of</strong> inorganic substances in <strong>water</strong> <strong>and</strong><br />
fluvial sediments: U.S. Geological Survey Techniques<br />
<strong>of</strong> Water-Resources Investigations, book 5, chap. A1,<br />
545 p.<br />
Fitzpatrick, F.A., Waite, I.R., D’Arconte, P.J., Meador,<br />
M.R., Maupin, M.A., <strong>and</strong> Gurtz, M.E., 1998, Revised<br />
methods for characterizing stream habitat in the<br />
National Water-Quality Assessment Program: U.S.<br />
Geological Survey Water-Resources Investigations<br />
Report 98-4052, 67 p.<br />
Foreman, W.T., Connor, B.F., Furlong, E.T., Vaught,<br />
D.G., <strong>and</strong> Merten, L.M., 1995, Methods <strong>of</strong> analysis by<br />
the U.S. Geological Survey National Water Quality<br />
Laboratory—Determination <strong>of</strong> organochlorine pesticides<br />
<strong>and</strong> polychlorinated biphenyls in bottom sediment<br />
by dual capillary-column gas chromatography<br />
with electron-capture detection: U.S. Geological Survey<br />
Open-File Report 95-140, 78 p.<br />
45<br />
Furlong, E.T., Anderson, B.D., Werner, S.L., Soliven,<br />
P.P., C<strong>of</strong>fey, L.J., <strong>and</strong> Burkhardt, M.R., 2001, Methods<br />
<strong>of</strong> analysis by the U.S. Geological Survey<br />
National Water Quality Laboratory–Determination <strong>of</strong><br />
pesticides in <strong>water</strong> by graphitized carbon-based solidphase<br />
extraction <strong>and</strong> high-performance liquid chromatography/mass<br />
spectrometry: U.S. Geological Survey<br />
Water-Resources Investigations Report 01-4134, 73 p.<br />
Gilliom, R.J., Alley, W.M., <strong>and</strong> Gurtz, M.E., 1995,<br />
Design <strong>of</strong> the National Water-Quality Assessment<br />
Program—occurrence <strong>and</strong> distribution <strong>of</strong> <strong>water</strong><strong>quality</strong><br />
conditions: U.S. Geological Survey Circular<br />
1112, 33 p.<br />
Goree, B.B., Lovelace, W.M., Montgomery, P.A.,<br />
Resweber, J.C., Sasser, D.C., Jr., <strong>and</strong> Walters, D.J.,<br />
2001, Water resources data—Louisiana, <strong>water</strong> year<br />
2000: U.S. Geological Survey Water-Data Report<br />
LA-00-1, 563 p.<br />
Goree, B.B., Lovelace, W.M., Montgomery, P.A.,<br />
Resweber, J.C., Sasser, D.C., Jr., <strong>and</strong> Walters, D.J.,<br />
2002, Water resources data—Louisiana, <strong>water</strong> year<br />
2001: U.S. Geological Survey Water-Data Report<br />
LA-01-1, 638 p.<br />
Goree, B.B., Lovelace, W.M., Montgomery, P.A.,<br />
Resweber, J.C., <strong>and</strong> Walters, D.J., 2000, Water<br />
resources data—Louisiana, <strong>water</strong> year 1999: U.S.<br />
Geological Survey Water-Data Report LA-99-1,<br />
635 p.<br />
Hach Company, 1999, Model 2100N laboratory turbidimeter<br />
instruction manual: Lovel<strong>and</strong>, Colo., Hach<br />
Company, 79 p.<br />
Hayes, T.B., Collins Atif, Lee, Melissa, Mendoza,<br />
Magdelena, Noriega, Nigel, Stuart, A.A., <strong>and</strong> Vonk,<br />
Aaron, 2002, Hermaphroditic, demasculinized frogs<br />
after exposure to the herbicide atrazine at low <strong>ecological</strong>ly<br />
relevant doses: Proceedings <strong>of</strong> the National<br />
Academy <strong>of</strong> Sciences, v. 99, no. 8, p. 5476-5480.<br />
Helsel, D.R., <strong>and</strong> Hirsch, R.M., 1992, Statistical methods<br />
in <strong>water</strong> resources: New York, Elsevier Science<br />
Publishers, 522 p.<br />
Hem, J.D., 1992, Study <strong>and</strong> interpretation <strong>of</strong> chemical<br />
characteristics <strong>of</strong> natural <strong>water</strong> (3d ed.): U.S. Geological<br />
Survey Water-Supply Paper 2254, p. 263.<br />
Hynes, H.B.N., 2001, The ecology <strong>of</strong> running <strong>water</strong>s:<br />
Caldwell, N.J., The Blackburn Press, 555 p.
Jongman, R.H.G., ter Braak, C.J.F., <strong>and</strong> van Tongeren,<br />
O.F.R., 1995, Data analysis in community <strong>and</strong> l<strong>and</strong>scape<br />
ecology: Cambridge, U.K., Cambridge University<br />
Press, 299 p.<br />
Koterba, M.T., Wilde, F.D., <strong>and</strong> Lapham, W.W., 1995,<br />
Ground-<strong>water</strong> data-collection protocols <strong>and</strong> procedures<br />
for the National Water-Quality Assessment Program—Collection<br />
<strong>and</strong> documentation <strong>of</strong> <strong>water</strong><strong>quality</strong><br />
samples <strong>and</strong> related data: U.S. Geological Survey<br />
Open-File Report 95-399, accessed September 13,<br />
2002, at URL http://<strong>water</strong>.usgs.gov/nawqa/OFR95-<br />
399.html<br />
Leahy, P.P., Rosenshein, J.S., <strong>and</strong> Knopman, D.S., 1990,<br />
Implementation plan for the National Water-Quality<br />
Assessment Program: U.S. Geological Survey Open-<br />
File Report 90-174, 10 p.<br />
Linscombe, S.D., Saichuk, J.K., Seiban, K.P., Bollich,<br />
P.K., <strong>and</strong> Funderburg, E.R., 1999, General agronomic<br />
guidelines, in Louisiana Cooperative Extension Service,<br />
Louisiana rice production h<strong>and</strong>book: Baton<br />
Rouge, La., Louisiana State University Agricultural<br />
Center, Pub. 2321, p. 5-12.<br />
Louisiana Cooperative Extension Service, 1998, Louisiana<br />
summary—Agriculture <strong>and</strong> natural resources:<br />
Baton Rouge, La., Louisiana State University Agricultural<br />
Center, Pub. 2382, 318 p.<br />
Louisiana Cooperative Extension Service, 2000, Louisiana<br />
summary—Agriculture <strong>and</strong> natural resources:<br />
Baton Rouge, La., Louisiana State University Agricultural<br />
Center, Pub. 2382, 322 p.<br />
Louisiana Department <strong>of</strong> Environmental Quality, 2003,<br />
Title 33 Environmental Regulatory Code, Part IX:<br />
accessed April 14, 2003, at URL<br />
http://www.deq.state.la.us/planning/regs/title33/<br />
33v09.pdf<br />
Louisiana State University Agricultural Center, 2001,<br />
Louisiana recommendations for control <strong>of</strong> insects on<br />
rice: accessed August 14, 2002, at URL<br />
http://www.agctr.lsu.edu/Subjects/guides/pests/pdfs/<br />
RICE-2001.pdf<br />
Louisiana State University Agricultural Center, 2002,<br />
Louisiana recommendations for control <strong>of</strong> household<br />
insects by homeowners: accessed August 14, 2002, at<br />
URL http://www.agctr.lsu.edu/Subjects/guides/pests/<br />
pdfs/RICE-2001.pdf<br />
Lovelace, J.K., 1999, Distribution <strong>of</strong> salt<strong>water</strong> in the<br />
Chicot aquifer system <strong>of</strong> southwestern Louisiana,<br />
1995-96: Louisiana Department <strong>of</strong> Transportation<br />
<strong>and</strong> Development Water Resources Technical Report<br />
no. 66, 61 p.<br />
46<br />
Madsen, J.E., S<strong>and</strong>strom, M.W., <strong>and</strong> Zaugg, S.D., 2003,<br />
Methods <strong>of</strong> analysis by the U.S. Geological Survey<br />
National Water Quality Laboratory—A method<br />
supplement for the determination <strong>of</strong> fipronil <strong>and</strong><br />
degradates in <strong>water</strong> by gas chromatography/mass<br />
spectrometry: U.S. Geological Survey Open-File<br />
Report 02-462, 11 p.<br />
Meador, M.R., <strong>and</strong> Gurtz, M.E., 1994, Biology as an<br />
integrated component <strong>of</strong> the U.S. Geological Survey’s<br />
National Water-Quality Assessment Program: U.S.<br />
Geological Survey Open-File Report 94-83, 4 p.<br />
Moulton, S.R., II, Carter, J.L., Grotheer, S.A., Cuffney,<br />
T.F., <strong>and</strong> Short, T.M., 2000, Methods <strong>of</strong> analysis by<br />
the U.S. Geological Survey National Water Quality<br />
Laboratory—Processing, taxonomy, <strong>and</strong> <strong>quality</strong><br />
control <strong>of</strong> benthic macroinvertebrate samples: U.S.<br />
Geological Survey Open-File Report 00-212, 49 p.<br />
Moulton, S.R., II, Kennen, J.G., Goldstein, R.M., <strong>and</strong><br />
Hambrook, J.A., 2002, Revised protocols for<br />
sampling algal, invertebrate, <strong>and</strong> fish communities in<br />
the National Water-Quality Assessment Program:<br />
U.S. Geological Survey Open-File Report 02-150,<br />
75 p.<br />
Mueller, D.K., Martin J.D., <strong>and</strong> Lopes, T.J., 1997,<br />
Quality-control design for surface-<strong>water</strong> sampling in<br />
the National Water-Quality Assessment Program:<br />
U.S. Geological Survey Open-File Report 97-223,<br />
17 p.<br />
National Transportation Safety Board, 2002, Railroad<br />
Accident Report—Derailment <strong>of</strong> Union Pacific<br />
Railroad train QFPLI-26 at Eunice, Louisiana, May<br />
27, 2000: Washington, D.C., National Transportation<br />
Safety Board, PB2002-916303, 39 p.<br />
Omernik, J.M., 1987, Ecoregions <strong>of</strong> the conterminous<br />
United States on a scale <strong>of</strong> 1:7,500,000: Annuals <strong>of</strong><br />
the Association <strong>of</strong> American Geographers, v. 77,<br />
p. 118-125.<br />
Oregon State University, 1996, Tebuthiuron: Extension<br />
Toxicology Network, Pesticide information pr<strong>of</strong>iles:<br />
accessed on August 16, 2002, at URL<br />
http://ace.ace.orst.edu/info/extoxnet/pips/<br />
tebuthiu.htm<br />
Ottea, Jim, <strong>and</strong> Romaire, Robert, 2001, Effects <strong>of</strong> size<br />
<strong>and</strong> temperature on the acute toxicity <strong>of</strong> fipronil<br />
(Icon) to red swamp crawfish, Procambarus clarkii:<br />
accessed on April 15, 2003, at URL<br />
http://www.lsuagcenter.com/Subjects/icon/pdfs/<br />
IconToxicityTestforWeb_final_1.pdf
S<strong>and</strong>strom, M.W., 1995, Filtration <strong>of</strong> <strong>water</strong>-sediment<br />
samples for the determination <strong>of</strong> organic compounds:<br />
U.S. Geological Survey Water-Resources Investigations<br />
Report 95-4105, 13 p.<br />
S<strong>and</strong>strom, M.W., Wydoski, D.S., Schroeder, M.P.,<br />
Zamboni, J.L., <strong>and</strong> Foreman, W.T., 1992, Methods <strong>of</strong><br />
analysis by the U.S. Geological Survey National<br />
Water Quality Laboratory—Determination <strong>of</strong><br />
organonitrogen herbicides in <strong>water</strong> by solid-phase<br />
extraction <strong>and</strong> capillary-column gas<br />
chromatography/mass spectrometry with selected-ion<br />
monitoring: U.S. Geological Survey Open-File<br />
Report 91-519, 26 p.<br />
Shelton, L.R., 1994, Field guide for collecting <strong>and</strong><br />
processing stream-<strong>water</strong> samples for the National<br />
Water-Quality Assessment Program: U.S. Geological<br />
Survey Open-File Report 94-0455, 42 p.<br />
Shelton, L.R., <strong>and</strong> Capel, P.D., 1994, Guidelines for<br />
collecting <strong>and</strong> processing samples <strong>of</strong> streambed<br />
sediment for the analysis <strong>of</strong> trace elements <strong>and</strong> organic<br />
contaminants for the National Water-Quality<br />
Assessment Program: U.S. Geological Survey Open-<br />
File Report 94-458, 20 p.<br />
Sloss, Raymond, 1971, Drainage area <strong>of</strong> Louisiana<br />
streams: Louisiana Department <strong>of</strong> Public Works<br />
Basic Records Report no. 6, 117 p.<br />
Spearing, Darwin, 1995, Roadside geology <strong>of</strong> Louisiana:<br />
Missoula, Mont., Mountain Press, 225 p.<br />
ter Braak, C.J.F., <strong>and</strong> Smilauer, Petr, 1998, CANOCO<br />
reference manual <strong>and</strong> user’s guide to Canoco for Windows—S<strong>of</strong>tware<br />
for canonical community ordination<br />
(version 4.0): New York, Microcomputer Power,<br />
352 p.<br />
Tollett, R.W., <strong>and</strong> Fendick, R.B., Jr, 2004, Quality <strong>of</strong><br />
<strong>water</strong> from shallow wells in the rice-growing area in<br />
southwestern Louisiana, 1999 through 2001: U.S.<br />
Geological Survey Water-Resources Investigations<br />
Report 03-4050, 44 p.<br />
Tollett, R.W., Fendick, R.B., Jr., <strong>and</strong> Simmons, L.B.,<br />
2003, Quality <strong>of</strong> <strong>water</strong> in domestic wells in the Chicot<br />
<strong>and</strong> Chicot equivalent aquifer systems, southern Louisiana<br />
<strong>and</strong> southwestern Mississippi, 2000-2001: U.S.<br />
Geological Survey Water-Resources Investigations<br />
Report 03-4122, 85 p.<br />
Touchet, A.B., Clark, H.L., Redlich, C.M., Roy, A.J.,<br />
Griffis, B.J., Zaunbrecher, S.J., <strong>and</strong> Hollier, R.M.,<br />
1974, Soil survey <strong>of</strong> Evangeline Parish, Louisiana:<br />
U.S. Department <strong>of</strong> Agriculture, Soil Conservation<br />
Service in cooperation with the Louisiana Agricultural<br />
Experiment Station, 68 p. (also includes 56 map sheets<br />
<strong>and</strong> 2 index maps, various scales)<br />
47<br />
U.S. Environmental Protection Agency, 1996, New pesticide<br />
Fact Sheet: Washington, D.C., U.S. Environmental<br />
Protection Agency, Office <strong>of</strong> Prevention,<br />
Pesticides <strong>and</strong> Toxic Substances, EPA 737-F-96-005,<br />
10 p.<br />
U.S. Environmental Protection Agency, 2000a, Drinking<br />
<strong>water</strong> st<strong>and</strong>ards <strong>and</strong> health advisories: Washington,<br />
D.C., U.S. Environmental Protection Agency, Office<br />
<strong>of</strong> Water, EPA 822-B-00-001, variously paginated.<br />
U.S. Environmental Protection Agency, 2000b,<br />
Malathion summary, Office <strong>of</strong> Pesticide Programs:<br />
accessed August 14, 2002, at URL<br />
http://www.epa.gov/pesticides/op/malathion/<br />
summary.htm<br />
U.S. Environmental Protection Agency, 2002a, National<br />
recommended <strong>water</strong> <strong>quality</strong> criteria—2002:<br />
Washington, D.C., U.S. Environmental Protection<br />
Agency, Office <strong>of</strong> Science <strong>and</strong> Technology, Office <strong>of</strong><br />
Water (4304T) EPA 822-R-02-047, 33 p.<br />
U.S. Environmental Protection Agency, 2002b, Total<br />
maximum daily load for the pesticide fipronil in the<br />
Mermentau River Basin: accessed October 16, 2002,<br />
at URL http://www.epa.gov/region6/<strong>water</strong>/ecopro/<br />
latmdl/fipronil_merm(f).pdf<br />
U.S. Environmental Protection Agency, 2002c, Total<br />
maximum daily loads: accessed December 13, 2002,<br />
at URL<br />
http://oaspub.epa.gov/<strong>water</strong>s/<strong>water</strong>s_list.tmdls?state=<br />
LA<br />
U.S. Geological Survey, 1997 to present, National field<br />
manual for the collection <strong>of</strong> <strong>water</strong>-<strong>quality</strong> data: U.S.<br />
Geological Survey Techniques <strong>of</strong> Water-Resources<br />
Investigations, book 9, chaps. A1-A9, 2 v., variously<br />
paged. [Also available online at<br />
http://pubs.<strong>water</strong>.usgs.gov/twri9A . Chapters<br />
originally were published from 1997-1999; updates<br />
<strong>and</strong> revisions are ongoing <strong>and</strong> are summarized at:<br />
http://<strong>water</strong>.usgs.gov/owq/FieldManual/mastererrata.<br />
html ]<br />
Wetzel, R.G., <strong>and</strong> Likens, G.E., 1991, Limnological<br />
analyses (2d ed.): New York, Springer-Verlag<br />
Publishing, p. 21.<br />
Wilkinson, Lel<strong>and</strong>, 1998, Nonparametric statistics, in<br />
SYSTAT 8.0 Statistics, Wilkinson, Lel<strong>and</strong> (ed.): Chicago,<br />
SPSS Inc., p. 693-714.<br />
Wilkinson, Lel<strong>and</strong>, <strong>and</strong> Coward, Mark, 1998, Linear<br />
models II—Analysis <strong>of</strong> variance, in SYSTAT 8.0<br />
Statistics, Wilkinson, Lel<strong>and</strong> (ed.): Chicago, SPSS<br />
Inc., p. 401-456.
Wilkinson, Lel<strong>and</strong>, Engelman, Laszlo, Corter, James,<br />
<strong>and</strong> Coward, Mark, 1998, Cluster analysis, in<br />
SYSTAT 8.0 Statistics, Wilkinson, Lel<strong>and</strong> (ed.):<br />
Chicago, SPSS Inc., p. 53-86.<br />
Wilkinson, Lel<strong>and</strong>, Engelman, Laszlo, <strong>and</strong> Marcantonio,<br />
Rick, 1998, Correlations, similarities, <strong>and</strong> distance<br />
measures, in SYSTAT 8.0 Statistics, Wilkinson,<br />
Lel<strong>and</strong> (ed.): Chicago, SPSS Inc., p. 115-148.<br />
48<br />
Zaugg, S.D., S<strong>and</strong>strom, M.W., Smith, S.G., <strong>and</strong> Fehlberg,<br />
K.M., 1995, Methods <strong>of</strong> analysis by the U.S.<br />
Geological Survey National Water Quality Laboratory--Determination<br />
<strong>of</strong> pesticides in <strong>water</strong> by C-18<br />
solid-phase extraction <strong>and</strong> capillary-column gas chromatography/mass<br />
spectrometry with selected-ion<br />
monitoring: U.S. Geological Survey Open-File Report<br />
95-181, 60 p.
APPENDIXES<br />
1. Complete names for surface-<strong>water</strong> <strong>and</strong> <strong>ecological</strong> data-collection sites in the Mermentau River Basin <strong>and</strong><br />
adjacent Calcasieu River Basin in southwestern Louisiana, 1998-2001<br />
2. Pesticides <strong>and</strong> degradation products analyzed, use, <strong>and</strong> occurrence in ground- <strong>and</strong> surface-<strong>water</strong> samples<br />
from the Mermentau River Basin, southwestern Louisiana, 1998-2001<br />
3. Concentrations <strong>of</strong> fipronil <strong>and</strong> degradation products in surface <strong>water</strong>, Mermentau River Basin, southwestern<br />
Louisiana, 1999-2001<br />
4. Selected physiochemical properties <strong>and</strong> fipronil concentrations for <strong>ecological</strong> data-collection sites in<br />
southwestern Louisiana, 2001<br />
5. Mean quantitative habitat variables from <strong>ecological</strong> data-collection sites in southwestern Louisiana, 2001<br />
6. Classification ranking <strong>of</strong> U.S. Environmental Protection Agency's Rapid Bioassessment Protocols habitat<br />
variables for <strong>ecological</strong> data-collection sites in southwestern Louisiana, 2001<br />
7. Habitat assessment results using U.S. Environmental Protection Agency's Rapid Bioassessment Protocols<br />
for <strong>ecological</strong> data-collection sites in southwestern Louisiana, 2001<br />
8. Taxa <strong>and</strong> densities <strong>of</strong> richest-targeted habitat aquatic invertebrates for <strong>ecological</strong> data-collection sites in<br />
southwestern Louisiana, March-April 2001<br />
9. Loadings <strong>of</strong> <strong>environmental</strong> variables on the first two principal components (PC) derived from principal<br />
components analysis (PCA) <strong>of</strong> <strong>ecological</strong> data-collection sites in southwestern Louisiana, 2001<br />
49
Appendix 1. Complete names for surface-<strong>water</strong> <strong>and</strong> <strong>ecological</strong> data-collection sites in the Mermentau River Basin<br />
<strong>and</strong> adjacent Calcasieu River Basin in southwestern Louisiana, 1998-2001<br />
Site<br />
number<br />
(fig. 2)<br />
1 Shown in figure 3.<br />
Abbreviated site<br />
name Complete site name<br />
Mermentau River Basin<br />
1 Des Cannes Bayou des Cannes near Eunice 08010000<br />
2 Wik<strong>of</strong>f Bayou Wik<strong>of</strong>f near Rayne 08010500<br />
3 Plaquemine Bayou Plaquemine Brule at Estherwood 08011020<br />
4 Boggy Boggy Bayou at State Hwy. 106 near Pine Prairie 08011500<br />
5 Castor Castor Creek at Cottongin Castor Road near Oberlin 08011800<br />
6 Nezpique Bayou Nezpique at State Hwy. 376 north <strong>of</strong> Basile 08011860<br />
7 Mermentau Mermentau River at Mermentau 08012150<br />
8 Riceville Bayou Queue de Tortue at Riceville 08012300<br />
50<br />
U.S. Geological<br />
Survey station<br />
number<br />
9 Lake Arthur Mermentau River at Lake Arthur 08012400<br />
10 Chene Bayou Chene at State Hwy. 382 near Welsh 08012447<br />
11 Lacassine Bayou Lacassine near Lake Arthur 08012470<br />
12 Tortue Bayou Queue de Tortue at State Hwy. 13 near Lelieux 300446092214200<br />
13 Gr<strong>and</strong> Marais Bayou Gr<strong>and</strong> Marais at State Hwy. 699 near Kaplan 300514092173500<br />
14 Theriot Bayou Queue de Tortue at Theriot Road near Rayne 301154092145900<br />
15 East Lacassine East Bayou Lacassine at State Hwy. 99 north <strong>of</strong> Welsh 301520092491800<br />
16 Roanoke West Bayou Gr<strong>and</strong> Marais at Aaron Road near Roanoke 301538092421900<br />
17 Iota Bayou des Cannes at State Hwy. 98 west <strong>of</strong> Iota 301959092323400<br />
18 Panchoville Bayou Nezpique near Panchoville 302128092373800<br />
19 Church Point Bayou Plaquemine Brule at State Hwy. 370 near Church Point 302403092152300<br />
20 Mallet Bayou Mallet at State Hwy. 367 near Eunice 302749092203500<br />
21 Guidry Bayou Nezpique at Guidry Road north <strong>of</strong> Basile 303206092360000<br />
22 Blue Bayou Blue at State Hwy. 26 near Elton 303209092401800<br />
23 Upper Des Cannes Bayou des Cannes at State Hwy. 104 near Ville Platte 303755092190400<br />
24 Caney Caney Creek at Bond Road near Oakdale<br />
Calcasieu River Basin (additional site)<br />
304130092344100<br />
125 Whisky Whisky Chitto Creek near Oberlin 08014500
Appendix<br />
Appendix<br />
2.<br />
2.<br />
Pesticides<br />
Pesticides<br />
<strong>and</strong><br />
<strong>and</strong><br />
degradation<br />
degradation<br />
products<br />
products<br />
analyzed,<br />
analyzed,<br />
use,<br />
use,<br />
<strong>and</strong><br />
<strong>and</strong><br />
occurrence<br />
occurrence<br />
in<br />
in<br />
groundground<strong>and</strong><br />
<strong>and</strong><br />
surface-<strong>water</strong><br />
surface-<strong>water</strong><br />
samples<br />
samples<br />
from<br />
from<br />
the<br />
the<br />
Mermentau<br />
Mermentau<br />
River<br />
River<br />
Basin,<br />
Basin,<br />
southwestern<br />
southwestern<br />
Louisiana,<br />
Louisiana,<br />
1998-2001<br />
1998-2001—Continued<br />
[H, herbicide; DP, degredation product; I, insecticide; F, fungicide; Pesticides in bold italics were analyzed before analytical method approval, <strong>and</strong><br />
data in this report are provisional.]<br />
Pesticide or degradation product Use<br />
Number <strong>of</strong><br />
samples<br />
collected<br />
51<br />
Ground <strong>water</strong> Surface <strong>water</strong><br />
Samples with<br />
detected<br />
concentrations<br />
(percent)<br />
Number <strong>of</strong><br />
samples<br />
collected<br />
Samples with<br />
detected<br />
concentrations<br />
(percent)<br />
2,4-D H 29 3 36 77.8<br />
2,4-D methyl ester H 29 0 36 27.8<br />
2,4-DB H 29 0 36 .0<br />
2,6-Diethylaniline H, DP 29 0 242 .0<br />
2-Hydroxyatrazine H, DP 29 3 36 83.3<br />
3(4-Chlorophenyl)-1-methyl urea H, DP 29 3 36 .0<br />
3-Hydroxycarb<strong>of</strong>uran I, DP 29 0 36 .0<br />
3-Ketocarb<strong>of</strong>uran I, DP 29 0 36 .0<br />
Acetochlor H 29 0 242 .4<br />
Acifluorfen H 29 0 36 .0<br />
Alachlor H 29 3 242 10.7<br />
Aldicarb I 29 0 36 .0<br />
Aldicarb sulfone I, DP 29 0 36 .0<br />
Aldicarb sulfoxide I, DP 29 0 36 .0<br />
alpha-HCH I 29 0 242 .0<br />
Atrazine H 29 3 242 99.6<br />
Bendiocarb I 29 0 36 .0<br />
Benfluralin H 29 0 242 .0<br />
Benomyl F 29 0 36 36.1<br />
Bensulfuron-methyl H 29 0 36 47.2<br />
Bentazon H 29 10 36 75.0<br />
Bromacil H 29 0 36 22.2<br />
Bromoxynil H 29 0 36 .0<br />
Butylate H 29 0 242 .0<br />
Carbaryl I 29 0 241 26.1<br />
Carb<strong>of</strong>uran I 29 0 242 25.2<br />
Chloramben, methyl ester H 29 0 36 .0<br />
Chlorimuron-ethyl H 29 3 36 2.8<br />
Chlorothalonil H 29 0 36 .0<br />
Chlorpyrifos I 29 3 242 5.8<br />
Clopyralid H 29 0 36 .0<br />
Cyanazine H 29 0 242 .8<br />
Cycloate H 29 0 36 .0<br />
Dacthal (DCPA) H 29 0 242 .4<br />
Dacthal monoacid H, DP 29 0 36 .0<br />
Deethylatrazine H, DP 29 3 242 90.1<br />
Deethyldeisopropylatrazine H, DP 29 7 36 13.9<br />
Deisopropylatrazine H, DP 29 0 36 22.2<br />
Desulfinylfipronil I, DP 29 0 186 89.2<br />
Diazinon I 29 0 242 39.3<br />
Dicamba H 29 0 36 .0
Appendix 2. Pesticides <strong>and</strong> degradation products analyzed, use, <strong>and</strong> occurrence in ground- <strong>and</strong> surface-<strong>water</strong> samples<br />
from the Mermentau River Basin, southwestern Louisiana, 1998-2001—Continued<br />
Pesticide or degradation product Use<br />
Number <strong>of</strong><br />
samples<br />
collected<br />
Dichlorprop H 29 0 36 0.0<br />
Dieldrin I 29 0 242 .8<br />
Dinoseb H 29 0 36 2.8<br />
Diphenamid H 29 0 36 33.3<br />
Disulfoton I 29 0 242 .0<br />
Diuron H 29 3 36 91.7<br />
EPTC H 29 0 242 11.6<br />
Ethalfluralin H 29 0 242 .0<br />
Ethoprophos I 29 0 242 5.4<br />
Fenuron H 29 0 36 .0<br />
Fipronil I 29 0 192 72.4<br />
Fipronil degradate RPA105048 I, DP 29 0 207 84.1<br />
Fipronil Sulfone I, DP 29 0 207 87.4<br />
Fipronil Sulfide I, DP 29 0 207 88.8<br />
Flumetsulam H 29 3 36 .0<br />
Fluometuron H 29 0 36 5.6<br />
Fon<strong>of</strong>os I 29 0 242 .0<br />
Imazaquin H 29 7 36 8.3<br />
Imazethapyr H 29 0 36 .0<br />
Imidacloprid I 29 0 36 .0<br />
Lindane I 29 0 242 .0<br />
Linuron H 29 0 242 .0<br />
Malathion I 29 3 242 19.4<br />
MCPA H 29 0 36 2.8<br />
MCPB H 29 0 36 .0<br />
Metalaxyl F 29 3 36 38.9<br />
Methiocarb I 29 0 36 .0<br />
Methomyl I 29 0 36 .0<br />
Methomyl oxime I, DP 29 0 36 .0<br />
Methyl-Azinphos I 29 0 242 .0<br />
Methyl-Parathion I 29 0 242 1.2<br />
Metolachlor H 29 7 242 92.6<br />
Metribuzin H 29 3 242 33.1<br />
Metsulfuron methyl H 29 0 36 .0<br />
Molinate H 29 0 242 86.4<br />
Napropamide H 29 0 242 2.1<br />
Neburon H 29 0 36 .0<br />
Nicosulfuron H 29 0 36 .0<br />
Norflurazon H 29 0 36 .0<br />
Oryzalin H 29 0 36 .0<br />
Oxamyl I, DP 29 0 36 .0<br />
52<br />
Ground <strong>water</strong> Surface <strong>water</strong><br />
Samples with<br />
detected<br />
concentrations<br />
(percent)<br />
Number <strong>of</strong><br />
samples<br />
collected<br />
Samples with<br />
detected<br />
concentrations<br />
(percent)
Appendix 2. Pesticides <strong>and</strong> degradation products analyzed, use, <strong>and</strong> occurrence in ground- <strong>and</strong> surface-<strong>water</strong> samples<br />
from the Mermentau River Basin, southwestern Louisiana, 1998-2001—Continued<br />
Pesticide or degradation product Use<br />
Number <strong>of</strong><br />
samples<br />
collected<br />
Oxamyl oxime I, DP 29 0 36 0.0<br />
p,p'-DDE I, DP 29 0 242 .4<br />
Parathion I 29 0 242 .0<br />
Pebulate H 29 0 242 .0<br />
Pendimethalin H 29 0 242 4.1<br />
Permethrin-cis I 29 0 242 .0<br />
Phorate I 29 0 242 .0<br />
Picloram H 29 3 36 .0<br />
Prometon H 29 0 242 44.2<br />
Propachlor H 29 0 242 1.2<br />
Propanil H 29 0 242 10.3<br />
Propargite I 29 0 241 .0<br />
Propham H 29 0 36 .0<br />
Propiconazole F 29 0 36 25.0<br />
Propoxur I 29 0 36 2.8<br />
Propyzamide H 29 0 242 .0<br />
Siduron H 29 0 36 2.8<br />
Simazine H 29 0 239 32.6<br />
Sulfometuron-methyl H 29 0 36 30.6<br />
Tebuthiuron H 29 7 242 95.0<br />
Terbacil H 29 0 36 .0<br />
Terbufos I 29 0 242 .0<br />
Thiobencarb H 29 0 242 18.2<br />
Tri-allate H 29 0 242 .0<br />
Tribenuron-methyl H 29 0 36 .0<br />
Triclopyr H 29 0 36 52.8<br />
Trifluralin H 29 0 242 4.1<br />
53<br />
Ground <strong>water</strong> Surface <strong>water</strong><br />
Samples with<br />
detected<br />
concentrations<br />
(percent)<br />
Number <strong>of</strong><br />
samples<br />
collected<br />
Samples with<br />
detected<br />
concentrations<br />
(percent)
Appendix 3. Concentrations <strong>of</strong> fipronil <strong>and</strong> degradation products in surface <strong>water</strong>, Mermentau River Basin,<br />
Appendix<br />
southwestern<br />
3.<br />
Louisiana,<br />
Concentrations<br />
1999-2001<br />
<strong>of</strong> fipronil <strong>and</strong> degradation products in surface <strong>water</strong>, Mermentau River Basin,<br />
[Concentrations in micrograms per liter;
Appendix 3. Concentrations <strong>of</strong> fipronil <strong>and</strong> degradation products in surface <strong>water</strong>, Mermentau River Basin,<br />
southwestern Louisiana, 1999-2001—Continued<br />
USGS station<br />
number<br />
Abbreviated site<br />
name 1 Date<br />
Desulfinylfipronil<br />
08011020 Plaquemine 06/01/2000 0.157 0.017 0.129 0.062 0.243<br />
08011020 Plaquemine 06/28/2000 .049 .013 .066 .034 .019<br />
08011020 Plaquemine 03/13/2001 E.003 E.002 E.005 .003
Appendix 3. Concentrations <strong>of</strong> fipronil <strong>and</strong> degradation products in surface <strong>water</strong>, Mermentau River Basin,<br />
southwestern Louisiana, 1999-2001—Continued<br />
USGS station<br />
number<br />
Abbreviated site<br />
name 1 Date<br />
Desulfinylfipronil<br />
08012150 Mermentau 07/18/2000 0.04 0.015 0.074 0.035 0.016<br />
08012150 Mermentau 08/22/2000 .039 .009 .062 .031 .017<br />
08012150 Mermentau 09/28/2000 .036 .007 .055 .03 .014<br />
08012150 Mermentau 11/14/2000 E.009 .011 .013 .01 .004<br />
08012150 Mermentau 12/13/2000 E.008 .011 .015 .009
Appendix 3. Concentrations <strong>of</strong> fipronil <strong>and</strong> degradation products in surface <strong>water</strong>, Mermentau River Basin,<br />
southwestern Louisiana, 1999-2001—Continued<br />
USGS station<br />
number<br />
Abbreviated site<br />
name 1 Date<br />
Desulfinylfipronil<br />
08012470 Lacassine 04/04/2000 0.226 0.01 0.077 0.081 1.94<br />
08012470 Lacassine 04/20/2000 .219 .022 .08 .068 1.04<br />
08012470 Lacassine 05/09/2000 .059 .015 .048 .029 .176<br />
08012470 Lacassine 06/01/2000 .08 .019 .072 .033 .097<br />
08012470 Lacassine 06/20/2000 .094 .014 .075 .033 .056<br />
08012470 Lacassine 06/28/2000 .121 .015 .085 .042 .052<br />
08012470 Lacassine 07/18/2000 .057 .022 .09 .039 .02<br />
08012470 Lacassine 08/23/2000 .051 .012 .054 .03 .013<br />
08012470 Lacassine 11/14/2000 .015 .012 .021 .012 .007<br />
08012470 Lacassine 12/13/2000 E.009 .021 .013 .008
Appendix 3. Concentrations <strong>of</strong> fipronil <strong>and</strong> degradation products in surface <strong>water</strong>, Mermentau River Basin,<br />
southwestern Louisiana, 1999-2001—Continued<br />
USGS station<br />
number<br />
Abbreviated site<br />
name 1 Date<br />
Desulfinylfipronil<br />
300446092214200 Tortue 04/23/2001 0.32 0.013 0.123 0.119 1.86<br />
300446092214200 Tortue 05/21/2001 .122 .007 .07 .039 .432<br />
300514092173500 Gr<strong>and</strong> Marais 03/23/2001 .059 E.003 E.006 .011 .324<br />
300514092173500 Gr<strong>and</strong> Marais 04/23/2001 .085 .014 .017 .018 .156<br />
300514092173500 Gr<strong>and</strong> Marais 05/21/2001 .037 .006 .016 .006 .006<br />
301154092145900 Theriot 03/16/2001 E.002
Appendix 3. Concentrations <strong>of</strong> fipronil <strong>and</strong> degradation products in surface <strong>water</strong>, Mermentau River Basin,<br />
southwestern Louisiana, 1999-2001—Continued<br />
USGS station<br />
number<br />
Abbreviated site<br />
name 1 Date<br />
302749092203500 Mallet 02/22/2000 NA E0.005 NA 0.005
60<br />
Appendix 4. Selected physiochemical properties <strong>and</strong> fipronil concentrations for <strong>ecological</strong> data-collection sites in southwestern Louisiana, 2001<br />
[mg/L, milligram per liter; µS/cm, microsiemens per centimeter at 25 degrees Celsius; ºC, degrees Celsius, NTU, nephelometric turbidity units; µg/L, micrograms per liter]<br />
Site<br />
number<br />
(fig. 17)<br />
Abbreviated site<br />
name 1<br />
1 Complete site name is listed in appendix 1.<br />
2 Maximum dissolved fipronil concentration <strong>of</strong> three <strong>water</strong>-<strong>quality</strong> samples collected between March <strong>and</strong> May 2001.<br />
* Estimated value.<br />
USGS station number Date Time<br />
Dissolved<br />
oxygen, field<br />
(mg/L)<br />
pH, field<br />
(st<strong>and</strong>ard<br />
units)<br />
Specific<br />
conductance,<br />
field<br />
(µS/cm)<br />
Temperature,<br />
field<br />
(ºC)<br />
Turbidity,<br />
laboratory<br />
(NTU)<br />
Maximum<br />
dissolved<br />
fipronil 2<br />
(µg/L)<br />
1 Des Cannes 08010000 4/16/2001 1300 3.7 7.8 424 27.7 49 3.960<br />
2 Wik<strong>of</strong>f 08010500 3/14/2001 1515 6.0 7.6 155 18.9 64 .030<br />
3 Plaquemine 08011020 3/13/2001 1030 6.0 7.5 161 19.1 254 1.890<br />
4 Boggy 08011500 3/20/2001 1000 7.3 6.4 36 13.1 8
61<br />
Appendix 5. Mean quantitative habitat variables from <strong>ecological</strong> data-collection sites in southwestern Louisiana, 2001<br />
[--, not available]<br />
Site<br />
number<br />
(fig. 17)<br />
Abbreviated<br />
site name 1 USGS station number Date Time<br />
Drainage<br />
area,<br />
square<br />
miles<br />
Bank angle, 2<br />
degrees<br />
Bank<br />
erosion<br />
score 3<br />
Bank<br />
height, 2<br />
meter<br />
Bank<br />
stability<br />
index 2<br />
Bank<br />
vegetative<br />
cover, 2<br />
percent<br />
Euphotic<br />
zone depth, 4<br />
meter<br />
1 Des Cannes 08010000 4/16/2001 1300 142 49.2 5 3.3 13 73.3 0.22<br />
2 Wik<strong>of</strong>f 08010500 3/14/2001 1515 63 47 2 1.3 11.35 45 .47<br />
3 Plaquemine 08011020 3/13/2001 1030 320 60 6 0.8 9.7 86.7 .20<br />
4 Boggy 08011500 3/20/2001 1000 65 65.2 2 2.3 13 35 1.35<br />
5 Castor 08011800 3/20/2001 1530 33 31.8 1 3.2 12.35 41.7 .61<br />
6 Nezpique 08011860 3/27/2001 0930 166 42.2 3 3.1 12.65 55 .14<br />
7 Mermentau 08012150 3/29/2001 0700 1,381 -- -- -- -- -- .13<br />
11 Lacassine 08012470 3/15/2001 1045 296 -- -- -- -- -- .26<br />
12 Tortue 300446092214200 3/13/2001 1730 97 73.3 6 1.2 10.7 66.7 .15<br />
13 Gr<strong>and</strong> Marais 300514092173500 3/23/2001 0830 26 38.2 2 2.3 11.35 66.7 .06<br />
14 Theriot 301154092145900 3/16/2001 1200 37 49 5 1.3 12.2 25 .14<br />
15 East Lacassine 301520092491800 3/14/2001 1000 15 52.7 2 0.6 9.7 85 .24<br />
19 Church Point 302403092152300 3/22/2001 1115 74 48.8 5 4.4 14.15 75 .14<br />
20 Mallet 302749092203500 4/18/2001 0700 91 54.5 4 1.6 12.15 35 .49<br />
21 Guidry 303206092360000 3/27/2001 1515 381 41.8 6 3.9 14 38.3 .09<br />
22 Blue 303209092401800 3/21/2001 1500 80 47.3 3 1.2 11.7 31.7 .13<br />
23 Upper Des Cannes 303755092190400 3/21/2001 0930 46 60.3 2 1.7 11.35 76.7 .11<br />
24 Caney 304130092344100 3/19/2001 1230 18 44.7 1 2.7 13.85 23.3 1.30<br />
25 Whisky 08014500 4/17/2001 1530 504 51.8 5 3.7 16.85 41.7 2.28
62<br />
Appendix 5. Mean quantitative habitat variables from <strong>ecological</strong> data-collection sites in southwestern Louisiana, 2001—Continued<br />
Site<br />
number<br />
(fig. 17)<br />
Abbreviated site<br />
name 1<br />
Habitat<br />
cover, 3<br />
percent<br />
Open<br />
canopy, 2<br />
percent<br />
Riparian<br />
canopy<br />
closure, 2<br />
percent<br />
Secchi disk<br />
depth, 5<br />
meter<br />
Stream<br />
bankfull<br />
channel<br />
width, 2<br />
meter<br />
1 Complete site name is listed in appendix 1.<br />
2 Habitat variables measured according to Fitzpatrick <strong>and</strong> others (1998).<br />
3 Percent availability was ranked <strong>and</strong> scored for habitat variables measured according to Fitzpatrick <strong>and</strong> others (1998).<br />
4 Euphotic zone depth measured according to Moulton <strong>and</strong> others (2002).<br />
5 Secchi disk depth measured according to Wetzel <strong>and</strong> Likens (1991).<br />
6 Width-to-depth ratio determined by dividing stream wetted width by the stream depth.<br />
Stream<br />
depth, 2<br />
meter<br />
Stream open<br />
angle, 2<br />
degrees<br />
Stream<br />
velocity, 2<br />
square foot<br />
per second<br />
Stream<br />
wetted<br />
channel<br />
width, 2<br />
meter<br />
Width-to-depth<br />
ratio 6<br />
1 Des Cannes 27.8 25 69.6 0.03 22.6 0.95 45 0 16.2 17.1<br />
2 Wik<strong>of</strong>f 33.3 8.7 90.2 .18 11.4 .75 15.7 .94 8.53 11.4<br />
3 Plaquemine 44.4 68.3 74.5 .1 58.8 -- 123 -- 57 --<br />
4 Boggy 38.9 7.6 84.3 .655 17.5 .88 13.7 .03 11.1 12.6<br />
5 Castor 30.6 27.6 57.8 .325 21.6 .54 49.7 .29 7 13<br />
6 Nezpique 30.6 19.4 85.3 .06 26.5 .97 35 .81 15.8 16.3<br />
7 Mermentau 47.2 78.9 89.2 .04 113 9.72 142 -- 113 11.6<br />
11 Lacassine 47.2 75.4 82.4 .09 112 4.74 136 -- 112 23.6<br />
12 Tortue 38.9 56.1 81.4 .07 28.6 -- 101 -- 26.5 --<br />
13 Gr<strong>and</strong> Marais 38.9 41.5 33.3 .025 14.3 .54 74.7 .16 6.6 12.2<br />
14 Theriot 30.6 25.2 58.8 .025 14.1 .8 45.3 1.17 5.59 6.99<br />
15 East Lacassine 22.2 61.7 5.9 .1 6.9 .63 111 1.19 5.88 9.3<br />
19 Church Point 30.6 50 5.9 .04 18.9 .45 90 .51 7.23 16.1<br />
20 Mallet 33.3 6.9 92.2 .14 15.8 .52 12.3 .1 10.8 20.8<br />
21 Guidry 30.6 27 81.4 .025 31.1 1.86 48.7 .21 20.4 11<br />
22 Blue 41.7 3 84.3 .03 17.1 1.16 5.3 .63 12 10.3<br />
23 Upper Des Cannes 41.7 27.6 79.4 .025 21.6 1.36 49.7 17.1 12.6<br />
24 Caney 36.1 5.6 88.2 .575 14.3 .46 10 .18 5.47 11.9<br />
25 Whisky 36.1 31.1 90.2 1.23 39.3 .88 56 .94 28.6 32.5
63<br />
Appendix 6. Classification ranking <strong>of</strong> U.S. Environmental Protection Agency’s Rapid Bioassessment Protocols habitat variables for <strong>ecological</strong> data-collection sites<br />
in southwestern Louisiana, 2001<br />
[>, greater than; 50 Mixed bottom, roots, SAV Mixed shallow <strong>and</strong> deep 90 >18 200-155 Optimal<br />
Suboptimal (11-15) 2-3 times Moderately stable 70-90 12-18 154-102 Suboptimal<br />
Marginal (6-10) 1-2 times Moderately unstable 50-70 6-12 101-49 Marginal<br />
Poor (0-5) Straight Unstable
64<br />
Appendix 7. Habitat assessment results using U.S. Environmental Protection Agency’s Rapid Bioassessment Protocols for <strong>ecological</strong> data-collection sites in<br />
southwestern Louisiana, 2001<br />
Site<br />
number<br />
(fig. 17)<br />
Abbreviated<br />
site name 2<br />
Instream<br />
cover<br />
(percent<br />
submerge<br />
d habitat)<br />
Pool<br />
substrate<br />
characterization<br />
(substrate<br />
<strong>quality</strong>)<br />
Pool<br />
variability<br />
(pool<br />
<strong>quality</strong>)<br />
Sediment<br />
deposition<br />
(percent<br />
recent<br />
deposition)<br />
Habitat variables 1<br />
Channel<br />
flow<br />
status<br />
(percent<br />
available<br />
channel<br />
exposed)<br />
Channel<br />
alteration<br />
(percent<br />
channelized<br />
stream<br />
reach)<br />
Channel<br />
sinuosity<br />
(stream<br />
bends<br />
increase<br />
length)<br />
Bank<br />
stability<br />
(erosion <strong>of</strong><br />
streambank)<br />
Bank<br />
vegetation<br />
protection<br />
(percent<br />
vegetative<br />
cover)<br />
1 Habitat variables descriptions are included in appendix 6.<br />
2<br />
Complete site name is listed in appendix 1.<br />
* RBP = Rapid Bioassessment Protocols include a visual-based habitat assessment for low gradient streams, modified for use in this study (Barbour <strong>and</strong> others, 1999).<br />
Riparian<br />
vegetative<br />
zone<br />
width<br />
(meter)<br />
RBP *<br />
site<br />
score<br />
range<br />
RBP *<br />
site habitat<br />
rating<br />
1 Des Cannes 15 14 18 3 18 8 6 10 20 20 132 Suboptimal<br />
2 Wik<strong>of</strong>f 14 9 16 12 18 17 8 14 16 20 144 Suboptimal<br />
3 Plaquemine 16 9 13 7 15 15 9 6 18 20 128 Suboptimal<br />
4 Boggy 18 15 17 20 18 20 18 12 20 20 178 Optimal<br />
5 Castor 14 18 19 18 16 15 14 14 16 18 162 Optimal<br />
6 Nezpique 16 15 18 11 17 20 18 14 14 20 163 Optimal<br />
7 Mermentau 20 15 18 13 20 8 15 20 20 20 169 Optimal<br />
11 Lacassine 18 15 15 8 18 20 20 20 20 20 174 Optimal<br />
12 Tortue 9 8 12 3 14 6 3 2 14 18 89 Marginal<br />
13 Gr<strong>and</strong> Marais 13 8 8 3 18 10 3 6 16 4 89 Marginal<br />
14 Theriot 7 7 8 1 14 10 6 10 10 15 88 Marginal<br />
15 East Lacassine 2 3 15 17 18 13 8 14 9 8 107 Suboptimal<br />
19 Church Point 11 13 8 14 14 18 13 16 12 8 127 Suboptimal<br />
20 Mallet 17 13 8 4 17 19 18 16 10 20 142 Suboptimal<br />
21 Guidry 16 10 13 8 17 15 19 8 10 20 136 Suboptimal<br />
22 Blue 16 10 18 15 20 20 20 18 18 20 175 Optimal<br />
23 Upper Des Cannes 14 8 13 6 18 18 17 20 20 20 154 Suboptimal<br />
24 Caney 18 15 16 15 18 20 10 18 20 20 170 Optimal<br />
25 Whisky 20 20 20 15 20 20 18 18 20 20 191 Optimal
Appendix 8. Taxa <strong>and</strong> densities <strong>of</strong> richest-targeted habitat aquatic invertebrates for <strong>ecological</strong> data-collection sites in<br />
southwestern Appendix 8. Louisiana, Taxa <strong>and</strong> densities March-April <strong>of</strong> richest-targeted 2001 habitat aquatic invertebrates for <strong>ecological</strong> data-collection sites in<br />
[Densities southwestern <strong>and</strong> total Louisiana, number <strong>of</strong> aquatic March-April invertebrates 2001 are rounded to the nearest whole number <strong>and</strong> reported as organisms per square meter; –, species<br />
not used as part <strong>of</strong> canonical correspondence analysis; --, species not collected; *, Subfamily; **, Tribe]<br />
Taxonomic heirarchy<br />
PHYLUM<br />
CLASS<br />
ORDER<br />
Family<br />
Genus species<br />
Species<br />
abbreviation<br />
(see<br />
fig. 16)<br />
Des<br />
Cannes Wik<strong>of</strong>f<br />
65<br />
Densities<br />
Abbreviated site names (see table 1, appendix 1)<br />
Plaquemine<br />
Boggy Castor<br />
Nezpique<br />
Mermentau<br />
Lacassine<br />
Tortue<br />
CNIDARIA (coelenterates) – -- -- -- -- -- -- -- -- --<br />
HYDROZOA (hydras) – -- -- -- -- -- -- -- -- --<br />
HYDROIDA – -- -- -- -- -- -- -- -- --<br />
Hydridae – -- -- -- -- -- -- -- -- --<br />
Hydra sp. Hydra -- -- 10 41 10 -- -- 140 --<br />
PLATYHELMINTHES (flatworms) – -- -- -- -- -- -- -- -- --<br />
TURBELLARIA (free-living flatworms) Turbell 18 -- 5 8 35 12 40 107 5<br />
NEMATODA (roundworms) Nematoda -- -- 5 25 10 33 10 -- --<br />
MOLLUSCA (clams, snails, <strong>and</strong> limpets) – -- -- -- -- -- -- -- -- --<br />
BIVALVIA (bivalue molluscs) – -- -- -- -- -- -- -- -- --<br />
VENEROIDA – -- -- -- -- -- -- -- -- --<br />
Sphaeriidae (fingernail clams) – -- -- -- -- -- -- -- -- --<br />
Eupera cubensis sp. – 25 -- -- -- -- 5 6 -- --<br />
Musculium sp. – -- -- -- -- -- -- 10 2 --<br />
GASTROPODA (snails, limpets) – -- -- -- -- -- -- -- -- --<br />
BASOMMATOPHORA – -- -- -- -- -- -- -- -- --<br />
Ancylidae (limpets) – -- -- -- -- -- -- -- -- --<br />
Laevapex sp. – -- -- -- -- -- -- -- -- --<br />
Lymnaeidae (pond snails) – -- -- -- -- -- -- -- -- --<br />
Pseudosuccinea columella – -- -- -- -- -- -- 40 54 5<br />
Physidae (pouch snails) – -- -- -- -- -- -- -- -- --<br />
Physella sp. Physella 4 9 25 8 37 61 110 177 22<br />
Planorbidae (orb snails) – -- -- -- -- -- -- -- -- --<br />
Micromenetus sp. Micromen -- 22 -- -- -- -- 60 32 17<br />
Planorbella sp. – -- -- -- -- -- -- -- -- --<br />
ANNELIDA (segmented worms) – -- -- -- -- -- -- -- -- --<br />
HIRUDINEA (leeches) – -- -- -- -- -- -- -- -- --<br />
ARHYNCHOBDELLAE – -- -- -- -- -- -- -- -- --<br />
Erpobdellidae Erpobidae -- 4 5 -- -- 23 10 -- --<br />
RHYNCHOBDELLAE – -- -- -- -- -- -- -- -- --<br />
Glossiphoniidae – 2 -- -- -- -- -- -- -- --<br />
OLIGOCHAETA (aquatic worms) – -- -- -- -- -- -- -- -- --<br />
ENCHYTRAEIDA – -- -- -- -- -- -- -- -- --<br />
Enchytraeidae Enchidae -- -- -- -- 40 5 -- --<br />
LUMBRICULIDA – -- -- -- -- -- -- -- -- --<br />
Lumbriculidae – -- -- -- 8 -- -- 17 -- --<br />
Megadrile sp. Megadrill -- -- 2 -- -- -- 6 -- --<br />
TUBIFICIDA – -- -- -- -- -- -- -- -- --<br />
Naididae Naididae -- -- -- -- -- -- -- 32 71<br />
Tubificidae Tubfidae 18 99 -- -- 10 5 23 -- --<br />
ARTHROPODA (arthropods) – -- -- -- -- -- -- -- -- --<br />
ARACHNIDA (eight-legged arthropods) – -- -- -- -- -- -- -- -- --<br />
ACARI (<strong>water</strong> mites) Acari -- 13 -- -- -- 5 -- -- --
Appendix 8. Taxa <strong>and</strong> densities <strong>of</strong> richest-targeted habitat aquatic invertebrates for <strong>ecological</strong> data-collection sites in<br />
southwestern Louisiana, March-April 2001—Continued<br />
Taxonomic heirarchy<br />
PHYLUM<br />
CLASS<br />
ORDER<br />
Family<br />
Genus species<br />
Species<br />
abbreviation<br />
(see<br />
fig. 16)<br />
Des<br />
Cannes Wik<strong>of</strong>f<br />
MALACOSTRACA (crustaceans) -- -- -- -- -- -- -- -- -- --<br />
AMPHIPODA (scuds, sideswimmers) – -- -- -- -- -- -- -- -- --<br />
Crangonyctidae – -- -- -- -- -- -- -- -- --<br />
Crangonyx sp. Crangony -- -- -- 58 10 -- 6 11 --<br />
Hyalellidae – -- -- -- -- -- -- -- -- --<br />
Hyalella azteca Hyazteca 20 1 205 -- -- -- 722 1,171 1,363<br />
DECAPODA (crayfishes, shrimps) – -- -- -- -- -- -- -- -- --<br />
Palaemonidae (prawns <strong>and</strong> river shrimps) – -- -- -- -- -- -- -- -- --<br />
Palaemonetes kadiakensis – -- -- -- -- -- -- -- -- --<br />
ISOPODA (aquatic sow bugs) – -- -- -- -- -- -- -- -- --<br />
Asellidae – -- -- -- -- -- -- -- -- --<br />
Caecidotea sp. – -- -- -- -- 10 -- -- -- --<br />
Lirceus sp. Lirceus -- -- -- 19 -- -- -- 11 --<br />
INSECTA (insects) – -- -- -- -- -- -- -- -- --<br />
COLEOPTERA (beetles) – -- -- -- -- -- -- -- -- --<br />
Carabidae (predaceous ground beetles) – 2 -- -- -- -- -- -- -- --<br />
Curculionidae (weevils) – 4 -- -- -- -- -- -- -- --<br />
Dytiscidae (predaceous diving beetles) – -- -- -- -- -- -- -- -- --<br />
Thermonectus sp. – -- -- -- -- -- -- -- -- --<br />
Hydroporinae* Hydrinae 11 -- -- -- -- -- 6 -- 17<br />
Laccophilinae* – -- -- -- -- -- -- -- -- --<br />
Laccophilus sp. – -- -- -- -- -- -- -- -- --<br />
Elmidae (riffle beetles) – -- -- -- -- -- -- -- -- --<br />
Macronychus glabratus – -- -- -- -- -- -- -- -- --<br />
Stenelmis sp. – -- 4 -- -- -- -- -- -- --<br />
Hydrophilidae (<strong>water</strong> scavenger beetles) – -- -- -- -- -- -- -- -- --<br />
Berosus sp. – 2 -- 2 -- -- -- -- -- --<br />
Enochrus sp. Enochrus -- -- -- -- -- -- 6 -- --<br />
Helochares sp. – -- -- -- -- -- -- -- -- --<br />
Tropisternus sp. Tropist -- 4 -- -- -- -- -- -- 11<br />
Noteridae (burrowing <strong>water</strong> beetles) – -- -- -- -- -- -- -- -- --<br />
Hydrocanthus sp. – -- -- -- -- -- -- -- -- --<br />
Suphisellus bicolor – -- -- -- -- -- -- -- -- 5<br />
Scirtidae (marsh beetles) Scirtdae -- -- 43 -- -- 5 -- -- 5<br />
COLLEMBOLA (springtails) Collemb 7 -- 5 -- 30 12 -- 11 5<br />
DIPTERA (true flies) – -- -- -- -- -- -- -- -- --<br />
Ceratopogonidae (biting midges, no-see-ums) – -- -- -- -- -- -- -- -- --<br />
Ceratopogoninae* – -- -- -- -- -- -- -- -- --<br />
Bezzia/Palpomyia sp. Bezzpalp -- -- -- -- 30 -- 6 -- --<br />
Forcipomyiinae* – -- -- -- -- -- -- -- -- --<br />
Atrichopogon sp. Atrichop -- -- -- 8 30 -- -- -- --<br />
Chironomidae (midges) – -- -- -- -- -- -- -- -- --<br />
Chironominae* – -- -- -- -- -- -- -- -- --<br />
66<br />
Densities<br />
Abbreviated site names (see table 1, appendix 1)<br />
Plaquemine<br />
Boggy Castor<br />
Nezpique<br />
Mermentau<br />
Lacassine<br />
Tortue
Appendix 8. Taxa <strong>and</strong> densities <strong>of</strong> richest-targeted habitat aquatic invertebrates for <strong>ecological</strong> data-collection sites in<br />
southwestern Louisiana, March-April 2001—Continued<br />
Taxonomic heirarchy<br />
PHYLUM<br />
CLASS<br />
ORDER<br />
Family<br />
Genus species<br />
Species<br />
abbreviation<br />
(see<br />
fig. 16)<br />
Des<br />
Cannes Wik<strong>of</strong>f<br />
Chironomini** – -- -- -- -- -- -- -- -- --<br />
Chironomus sp. Chironom -- 4 10 -- 20 -- -- -- --<br />
Dicrotendipes sp. Dicdipes 63 77 14 803 377 390 23 11 5<br />
Endochironomus sp. – -- -- -- -- -- -- 40 -- --<br />
Glyptotendipes sp. Glydipes -- -- 109 -- -- -- 216 623 11<br />
Goeldichironomus sp. – -- -- -- -- -- -- -- -- --<br />
Kiefferulus sp. – -- -- -- -- -- -- -- -- --<br />
Parachironomus sp. – -- -- -- -- -- -- -- -- --<br />
Phaenopsectra/Tribelos sp. – -- 4 -- -- -- -- -- 43 --<br />
Polypedilum sp. – -- -- -- -- -- -- 6 11 --<br />
Stenochironomus sp. – -- -- -- -- -- 5 -- -- --<br />
Tribelos sp. Tribelos -- 26 -- -- -- 5 6 32 5<br />
Zavreliella marmorata – -- -- -- -- -- -- -- -- --<br />
Pseudochironomini** – -- -- -- -- -- -- -- -- --<br />
Pseudochironomus sp. – 4 -- -- -- -- -- 17 -- --<br />
Tanytarsini** – -- -- -- -- -- -- -- -- --<br />
Cladotanytarsus sp. – -- -- 5 -- -- -- -- -- --<br />
Micropsectra/Tanytarsus sp. Mictanyt -- 4 10 124 50 12 -- -- --<br />
Rheotanytarsus sp. Rheotany 9 30 5 306 79 23 -- -- --<br />
Tanytarsus sp. Tanytars -- 77 33 340 367 80 6 -- --<br />
Diamesinae* – -- -- -- -- -- -- -- -- --<br />
Potthastia sp. – -- -- -- 17 -- -- -- -- --<br />
Orthocladiinae* – -- -- -- -- -- -- -- -- --<br />
Corynoneura sp. Corynon -- 125 10 207 10 -- -- 11 --<br />
Cricotopus sp. Cricotop 2 112 5 -- -- -- -- -- --<br />
Cricotopus/Orthocladius sp. Criortho -- 30 -- -- -- -- -- -- --<br />
Gymnometriocnemus sp. – -- -- -- -- -- -- -- -- --<br />
Nanocladius sp. Nanoclad 2 17 14 108 -- 5 -- 75 5<br />
Parakiefferiella sp. – -- -- -- 157 10 -- -- -- --<br />
Parametriocnemus sp. – -- -- -- -- 10 -- -- -- --<br />
Rheocricotopus sp. Rheocric -- -- -- 17 -- -- -- -- --<br />
Thienemanniella sp. Thienema -- 9 5 58 -- 5 -- -- 5<br />
Tvetenia sp. – -- -- -- -- -- -- -- -- --<br />
Tanypodinae* – -- -- -- -- -- -- -- -- --<br />
Natarsiini** – -- -- -- -- -- -- -- -- --<br />
Natarsia sp. – -- -- -- -- -- -- -- -- --<br />
Pentaneurini** – -- -- -- -- -- -- -- -- --<br />
Ablabesmyia sp. Ablabesm 2 -- 10 30 6 75 11<br />
Larsia sp. – -- -- -- -- -- -- -- -- --<br />
Thienemannimyia group sp. – -- -- -- -- -- -- -- -- --<br />
Procladiini** – -- -- -- -- -- -- -- -- --<br />
Procladius sp. – -- -- -- -- -- -- -- -- --<br />
Ephydridae (shore <strong>and</strong> brine flies) – -- -- -- -- -- -- -- -- --<br />
Psychodidae (moth flies) – -- -- -- -- -- -- -- -- --<br />
Psychoda sp. – -- -- -- -- 10 -- -- -- --<br />
67<br />
Densities<br />
Abbreviated site names (see table 1, appendix 1)<br />
Plaquemine<br />
Boggy Castor<br />
Nezpique<br />
Mermentau<br />
Lacassine<br />
Tortue
Appendix 8. Taxa <strong>and</strong> densities <strong>of</strong> richest-targeted habitat aquatic invertebrates for <strong>ecological</strong> data-collection sites in<br />
southwestern Louisiana, March-April 2001—Continued<br />
Taxonomic heirarchy<br />
PHYLUM<br />
CLASS<br />
ORDER<br />
Family<br />
Genus species<br />
Species<br />
abbreviation<br />
(see<br />
fig. 16)<br />
Des<br />
Cannes Wik<strong>of</strong>f<br />
Simuliidae (black flies) – -- -- -- -- -- -- -- -- --<br />
Simulium sp. – -- -- -- 10 -- -- -- -- --<br />
Stratiomyidae (soldier flies) – -- -- -- -- -- -- -- -- --<br />
Stratiomyinae* – -- -- -- -- -- -- -- -- --<br />
Hedriodiscus/Odontomyia sp. Hedrodon 47 -- 24 -- -- -- 6 -- --<br />
Tabanidae – -- -- -- -- -- -- -- -- --<br />
Tabanus sp. – -- -- -- -- -- -- -- -- --<br />
EPHEMEROPTERA (mayflies) – -- -- -- -- -- -- -- -- --<br />
Baetidae – -- -- -- -- -- -- -- -- --<br />
Baetis intercalaris – -- -- -- -- -- -- -- -- --<br />
Callibaetis sp. – -- -- -- -- -- -- -- -- --<br />
Caenidae – -- -- -- -- -- -- -- -- --<br />
Caenis sp. Caenis -- 116 33 -- -- 14 56 150 49<br />
Heptageniidae – -- -- -- -- -- -- -- -- --<br />
Stenacron sp. – -- -- -- -- -- -- -- -- --<br />
Stenonema sp. – -- -- -- -- -- -- -- -- --<br />
Isonychiidae – -- -- -- -- -- -- -- -- --<br />
Isonychia sp. – -- -- -- -- -- -- -- -- --<br />
MEGALOPTERA (dobsonflies/hellgrammites) – -- -- -- -- -- -- -- -- --<br />
Corydalidae – -- -- -- -- -- -- -- -- --<br />
Corydalus cornutus – -- -- -- -- -- -- -- -- --<br />
ODONATA (damsel/dragonflies) – -- -- -- -- -- -- -- -- --<br />
Coenagrionidae – -- -- -- -- -- -- -- -- --<br />
Argia, sp. – -- 4 -- -- -- -- -- -- --<br />
Corduliidae – -- -- -- -- -- -- -- -- --<br />
Epitheca princeps – -- -- -- -- -- -- -- 30 --<br />
PLECOPTERA (stoneflies) – -- -- -- -- -- -- -- -- --<br />
Perlidae – -- -- -- -- -- -- -- -- --<br />
Perlesta sp. – -- -- -- -- -- -- -- -- --<br />
TRICHOPTERA (caddisflies) – -- -- -- -- -- -- -- -- --<br />
Glossosomatidae – -- -- -- -- -- -- -- -- --<br />
Protoptila sp. – -- -- -- -- -- -- -- -- --<br />
Hydroptilidae (microcaddis) – -- -- -- -- -- -- -- -- --<br />
Hydroptila sp. – -- -- -- -- -- -- -- -- --<br />
Hydropsychidae – -- -- -- -- -- -- -- -- --<br />
Cheumatopsyche sp. Chpsyche -- 22 -- -- -- -- -- -- --<br />
Hydropsyche sp. – -- -- -- -- -- -- -- -- --<br />
Macrostemum carolina – -- -- -- -- -- -- -- -- --<br />
Leptoceridae – -- -- -- -- -- -- -- -- --<br />
Oecetis sp. – -- -- -- -- -- -- 6 32 --<br />
Polycentropodidae – -- -- -- -- -- -- -- -- --<br />
Paranyctiophylax sp. – -- -- -- -- -- -- -- -- --<br />
TOTAL ABUNDANCE 245 814 590 2,323 1,213 702 1,468 2,842 1,619<br />
68<br />
Densities<br />
Abbreviated site names (see table 1, appendix 1)<br />
Plaquemine<br />
Boggy Castor<br />
Nezpique<br />
Mermentau<br />
Lacassine<br />
Tortue
Appendix 8. Taxa <strong>and</strong> densities <strong>of</strong> richest-targeted habitat aquatic invertebrates for <strong>ecological</strong> data-collection sites in<br />
southwestern Louisiana, March-April 2001—Continued<br />
Taxonomic heirarchy<br />
PHYLUM<br />
CLASS<br />
ORDER<br />
Family<br />
Genus species<br />
Species<br />
abbreviation<br />
(see<br />
fig. 16)<br />
Gr<strong>and</strong><br />
Marais Theriot<br />
69<br />
Densities<br />
Abbreviated site names (see table 1, appendix 1)<br />
East<br />
Lacassine<br />
Church<br />
Point Mallet Guidry Blue<br />
Upper<br />
Des<br />
Cannes Caney Whisky<br />
CNIDARIA (coelenterates) – -- -- -- -- -- -- -- -- -- --<br />
HYDROZOA (hydras) – -- -- -- -- -- -- -- -- -- --<br />
HYDROIDA – -- -- -- -- -- -- -- -- -- --<br />
Hydridae – -- -- -- -- -- -- -- -- -- --<br />
Hydra sp. Hydra 58 -- -- 11 18 -- -- -- 12 --<br />
PLATYHELMINTHES (flatworms) – -- -- -- -- -- -- -- -- -- --<br />
TURBELLARIA (free-living flatworms) Turbell 20 3 14 26 9 6 3 48 12 --<br />
NEMATODA (roundworms) Nematoda 6 7 6 11 -- -- -- 19 -- 11<br />
MOLLUSCA (clams, snails, <strong>and</strong> limpets) – -- -- -- -- -- -- -- -- -- --<br />
BIVALVIA (bivalue molluscs) – -- -- -- -- -- -- -- -- -- --<br />
VENEROIDA – -- -- -- -- -- -- -- -- -- --<br />
Sphaeriidae (fingernail clams) – -- -- -- -- -- -- -- -- -- --<br />
Eupera cubensis sp. – 6 -- -- -- -- -- -- -- -- --<br />
Musculium sp. – -- -- -- -- -- -- -- -- -- --<br />
GASTROPODA (snails, limpets) – -- -- -- -- -- -- -- -- -- --<br />
BASOMMATOPHORA – -- -- -- -- -- -- -- -- -- --<br />
Ancylidae (limpets) – -- -- -- -- -- -- -- -- -- --<br />
Laevapex sp. – 12 -- -- -- -- -- -- -- -- --<br />
Lymnaeidae (pond snails) – -- -- -- -- -- -- -- -- -- --<br />
Pseudosuccinea columella – -- -- 8 -- -- -- -- -- -- --<br />
Physidae (pouch snails) – -- -- -- -- -- -- -- -- -- --<br />
Physella sp. Physella 6 19 39 52 9 -- 2 24 36 --<br />
Planorbidae (orb snails) – -- -- -- -- -- -- -- -- -- --<br />
Micromenetus sp. Micromen -- -- -- -- 317 6 -- -- -- --<br />
Planorbella sp. – -- -- 6 -- -- -- -- -- -- --<br />
ANNELIDA (segmented worms) – -- -- -- -- -- -- -- -- -- --<br />
HIRUDINEA (leeches) – -- -- -- -- -- -- -- -- -- --<br />
ARHYNCHOBDELLAE – -- -- -- -- -- -- -- -- -- --<br />
Erpobdellidae Erpobidae 6 -- 39 56 27 -- -- -- -- --<br />
RHYNCHOBDELLAE – -- -- -- -- -- -- -- -- -- --<br />
Glossiphoniidae – -- -- -- -- -- -- -- -- -- --<br />
OLIGOCHAETA (aquatic worms) – -- -- -- -- -- -- -- -- -- --<br />
ENCHYTRAEIDA – -- -- -- -- -- -- -- -- -- --<br />
Enchytraeidae Enchidae 6 9 -- 52 -- -- 11 76 -- --<br />
LUMBRICULIDA – -- -- -- -- -- -- -- -- -- --<br />
Lumbriculidae – -- -- -- -- -- -- -- -- -- --<br />
Megadrile sp. Megadrill -- 6 146 26 9 -- -- -- -- 14<br />
TUBIFICIDA – -- -- -- -- -- -- -- -- -- --<br />
Naididae Naididae 38 -- -- -- 9 -- -- -- 893 --<br />
Tubificidae Tubfidae 12 -- -- 258 9 -- -- 5 -- --<br />
ARTHROPODA (arthropods) – -- -- -- -- -- -- -- -- -- --<br />
ARACHNIDA (eight-legged arthropods) – -- -- -- -- -- -- -- -- -- --<br />
ACARI (<strong>water</strong> mites) Acari 17 12 -- -- 9 -- 24 19 -- 119
Appendix 8. Taxa <strong>and</strong> densities <strong>of</strong> richest-targeted habitat aquatic invertebrates for <strong>ecological</strong> data-collection sites in<br />
southwestern Louisiana, March-April 2001—Continued<br />
Taxonomic heirarchy<br />
PHYLUM<br />
CLASS<br />
ORDER<br />
Family<br />
Genus species<br />
Species<br />
abbreviation<br />
(see<br />
fig. 16)<br />
Gr<strong>and</strong><br />
Marais Theriot<br />
MALACOSTRACA (crustaceans) – -- -- -- -- -- -- -- -- -- --<br />
AMPHIPODA (scuds, sideswimmers) – -- -- -- -- -- -- -- -- -- --<br />
Crangonyctidae – -- -- -- -- -- -- -- -- -- --<br />
Crangonyx sp. Crangony 248 3 -- -- -- -- -- -- -- --<br />
Hyalellidae – -- -- -- -- -- -- -- -- -- --<br />
Hyalella azteca Hyazteca 44 -- 279 -- -- 2 -- -- -- --<br />
DECAPODA (crayfishes, shrimps) – -- -- -- -- -- -- -- -- -- --<br />
Palaemonidae (prawns <strong>and</strong> river<br />
shrimps) – -- -- -- -- -- -- -- -- -- --<br />
Palaemonetes kadiakensis – -- -- -- -- -- -- -- -- 3 --<br />
ISOPODA (aquatic sow bugs) – -- -- -- -- -- -- -- -- -- --<br />
Asellidae – -- -- -- -- -- -- -- -- -- --<br />
Caecidotea sp. – -- -- 41 -- -- -- -- -- 48 --<br />
Lirceus sp. Lirceus -- -- -- 11 18 -- -- -- 24 --<br />
INSECTA (insects) – -- -- -- -- -- -- -- -- -- --<br />
COLEOPTERA (beetles) – -- -- -- -- -- -- -- -- -- --<br />
Carabidae (predaceous ground beetles) – -- -- -- -- -- -- -- -- -- --<br />
Curculionidae (weevils) – -- 6 -- -- -- 25 3 -- -- --<br />
Dytiscidae (predaceous diving beetles) – -- -- -- -- -- -- -- -- -- --<br />
Thermonectus sp. – -- 1 -- -- -- -- -- -- -- --<br />
Hydroporinae* Hydrinae -- 10 6 -- -- -- -- 10 -- --<br />
Laccophilinae* – -- -- -- -- -- -- -- -- -- --<br />
Laccophilus sp. – -- -- -- -- 27 -- -- 10 -- --<br />
Elmidae (riffle beetles) – -- -- -- -- -- -- -- -- -- --<br />
Macronychus glabratus – -- -- -- -- -- -- -- -- -- 60<br />
Stenelmis sp. – -- 1 -- 191 -- -- -- -- -- 95<br />
Hydrophilidae (<strong>water</strong> scavenger beetles) – -- -- -- -- -- -- -- -- -- --<br />
Berosus sp. – 6 -- -- -- -- 6 -- -- -- --<br />
Enochrus sp. Enochrus 6 1 -- -- -- -- -- -- -- --<br />
Helochares sp. – -- 1 -- -- -- -- -- -- -- --<br />
Tropisternus sp. Tropist -- 1 -- -- -- -- -- -- -- --<br />
Noteridae (burrowing <strong>water</strong> beetles) – -- -- -- -- -- -- -- -- -- --<br />
Hydrocanthus sp. – -- 3 -- -- -- -- -- -- -- --<br />
Suphisellus bicolor – 17 9 -- -- -- -- -- -- -- --<br />
Scirtidae (marsh beetles) Scirtdae -- 10 -- -- -- 12 -- -- -- --<br />
COLLEMBOLA (springtails) Collemb 20 24 19 78 9 -- 8 210 -- --<br />
DIPTERA (true flies) – -- -- -- -- -- -- -- -- -- --<br />
Ceratopogonidae (biting midges,<br />
no-see-ums) – -- -- -- -- -- -- -- -- -- --<br />
Ceratopogoninae* – -- -- -- -- -- -- -- -- -- --<br />
Bezzia/Palpomyia sp. Bezzpalp -- -- -- -- -- 31 -- -- 24 60<br />
Forcipomyiinae* – -- -- -- -- -- -- -- -- -- --<br />
Atrichopogon sp. Atrichop -- -- -- -- 9 -- -- -- -- 11<br />
Chironomidae (midges) – -- -- -- -- -- -- -- -- -- --<br />
Chironominae* – -- -- -- -- -- -- -- -- -- --<br />
70<br />
Densities<br />
Abbreviated site names (see table 1, appendix 1)<br />
East<br />
Lacassine<br />
Church<br />
Point Mallet Guidry Blue<br />
Upper<br />
Des<br />
Cannes Caney Whisky
Appendix 8. Taxa <strong>and</strong> densities <strong>of</strong> richest-targeted habitat aquatic invertebrates for <strong>ecological</strong> data-collection sites in<br />
southwestern Louisiana, March-April 2001—Continued<br />
Taxonomic heirarchy<br />
PHYLUM<br />
CLASS<br />
ORDER<br />
Family<br />
Genus species<br />
Species<br />
abbreviation<br />
(see<br />
fig. 16)<br />
Gr<strong>and</strong><br />
Marais Theriot<br />
Chironomini** – -- -- -- -- -- -- -- -- -- --<br />
Chironomus sp. Chironom -- -- -- -- 9 -- -- -- 24 --<br />
Dicrotendipes sp. Dicdipes 12 1 -- 601 82 -- 11 67 119 --<br />
Endochironomus sp. – -- -- -- -- -- -- -- -- -- --<br />
Glyptotendipes sp. Glydipes -- 3 -- 11 -- -- -- -- 12 --<br />
Goeldichironomus sp. – -- 4 -- -- -- -- -- -- -- --<br />
Kiefferulus sp. – -- -- -- -- -- -- -- -- 131 --<br />
Parachironomus sp. – 12 -- -- -- -- -- -- -- -- --<br />
Phaenopsectra/Tribelos sp. – -- -- -- -- -- -- -- -- -- --<br />
Polypedilum sp. – -- -- -- -- -- -- -- -- -- --<br />
Stenochironomus sp. – -- -- -- -- -- -- -- -- -- --<br />
Tribelos sp. Tribelos -- -- -- -- -- -- -- 5 -- --<br />
Zavreliella marmorata – -- -- -- -- -- -- -- -- 12 --<br />
Pseudochironomini** – -- -- -- -- -- -- -- -- -- --<br />
Pseudochironomus sp. – -- -- -- -- -- -- -- -- -- 25<br />
Tanytarsini** – -- -- -- -- -- -- -- -- -- --<br />
Cladotanytarsus sp. – -- -- -- 11 9 -- -- -- -- --<br />
Micropsectra/Tanytarsus sp. Mictanyt -- 1 -- 64 -- -- 19 10 83 --<br />
Rheotanytarsus sp. Rheotany -- 1 -- 205 45 -- 2 -- 71 828<br />
Tanytarsus sp. Tanytars -- -- 6 64 9 6 25 10 143 35<br />
Diamesinae* – -- -- -- -- -- -- -- -- -- --<br />
Potthastia sp. – -- -- -- 11 -- -- -- -- -- 11<br />
Orthocladiinae* – -- -- -- -- -- -- -- -- -- --<br />
Corynoneura sp. Corynon -- -- -- 26 -- -- -- 5 36 11<br />
Cricotopus sp. Cricotop 50 4 66 258 9 -- -- 5 12 --<br />
Cricotopus/Orthocladius sp. Criortho 6 -- 8 64 -- -- -- -- 24 35<br />
Gymnometriocnemus sp. – -- 1 -- -- -- -- -- -- -- --<br />
Nanocladius sp. Nanoclad 38 -- -- -- 18 -- -- -- 24 --<br />
Parakiefferiella sp. – -- -- -- 26 -- -- -- -- 119 --<br />
Parametriocnemus sp. – -- -- -- -- -- -- -- -- --<br />
Rheocricotopus sp. Rheocric -- -- -- 11 -- -- -- -- 12 74<br />
Thienemanniella sp. Thienema 20 184 33 64 -- -- -- -- 12 35<br />
Tvetenia sp. – -- -- -- -- 9 -- -- -- -- 158<br />
Tanypodinae* – -- -- -- -- -- -- -- -- -- --<br />
Natarsiini** – -- -- -- -- -- -- -- -- -- --<br />
Natarsia sp. – -- -- -- 11 27 -- 13 -- -- --<br />
Pentaneurini** – -- -- -- -- -- -- -- -- --<br />
Ablabesmyia sp. Ablabesm -- -- -- -- -- -- -- -- --<br />
Larsia sp. – -- -- -- -- -- -- -- 60 --<br />
Thienemannimyia group sp. – -- -- -- 11 -- 6 -- -- -- 25<br />
Procladiini** – -- -- -- -- -- -- -- -- -- --<br />
Procladius sp. – -- -- -- -- -- -- -- -- 12 --<br />
Ephydridae (shore <strong>and</strong> brine flies) – -- -- -- -- -- -- -- -- 12 --<br />
Psychodidae (moth flies) – -- -- -- -- -- -- -- -- -- --<br />
Psychoda sp. – -- -- -- -- -- -- -- -- 12 --<br />
71<br />
Densities<br />
Abbreviated site names (see table 1, appendix 1)<br />
East<br />
Lacassine<br />
Church<br />
Point Mallet Guidry Blue<br />
Upper<br />
Des<br />
Cannes Caney Whisky
Appendix 8. Taxa <strong>and</strong> densities <strong>of</strong> richest-targeted habitat aquatic invertebrates for <strong>ecological</strong> data-collection sites in<br />
southwestern Louisiana, March-April 2001—Continued<br />
Taxonomic heirarchy<br />
PHYLUM<br />
CLASS<br />
ORDER<br />
Family<br />
Genus species<br />
Species<br />
abbreviation<br />
(see<br />
fig. 16)<br />
Gr<strong>and</strong><br />
Marais Theriot<br />
Simuliidae (black flies) – -- -- -- -- -- -- -- -- -- --<br />
Simulium sp. – -- -- -- -- -- -- -- -- -- --<br />
Stratiomyidae (soldier flies) – -- -- -- -- -- -- -- -- -- --<br />
Stratiomyinae* – -- -- -- -- -- -- -- -- -- --<br />
Hedriodiscus/Odontomyia sp. Hedrodon 6 6 6 -- -- -- -- -- -- --<br />
Tabanidae – -- -- -- -- -- -- -- -- -- --<br />
Tabanus sp. – -- -- -- -- -- -- -- 5 -- --<br />
EPHEMEROPTERA (mayflies) – -- -- -- -- -- -- -- -- -- --<br />
Baetidae – -- -- -- -- -- -- -- -- -- --<br />
Baetis intercalaris – -- -- -- -- -- -- -- -- -- 25<br />
Callibaetis sp. – -- -- 6 -- -- -- -- -- -- --<br />
Caenidae – -- -- -- -- -- -- -- -- -- --<br />
Caenis sp. Caenis 242 36 298 336 -- 6 -- -- -- --<br />
Heptageniidae – -- -- -- -- -- -- -- -- -- --<br />
Stenacron sp. – -- -- -- -- -- 2 -- -- -- --<br />
Stenonema sp. – -- -- -- -- -- -- -- -- -- 11<br />
Isonychiidae – -- -- -- -- -- -- -- -- -- --<br />
Isonychia sp. – -- -- -- -- -- -- -- -- -- 11<br />
MEGALOPTERA (dobsonflies/hellgrammites)<br />
– -- -- -- -- -- -- -- -- -- --<br />
Corydalidae – -- -- -- -- -- -- -- -- -- --<br />
Corydalus cornutus – -- -- -- -- -- -- -- -- -- 4<br />
ODONATA (damsel/dragonflies) – -- -- -- -- -- -- -- -- -- --<br />
Coenagrionidae – -- -- -- -- -- -- -- -- -- --<br />
Argia, sp. – -- -- -- 11 -- -- -- -- -- --<br />
Corduliidae – -- -- -- -- -- -- -- -- -- --<br />
Epitheca princeps – -- -- -- -- -- -- -- -- -- --<br />
PLECOPTERA (stoneflies) – -- -- -- -- -- -- -- -- -- --<br />
Perlidae – -- -- -- -- -- -- -- -- -- --<br />
Perlesta sp. – -- -- -- -- -- -- -- -- -- 144<br />
TRICHOPTERA (caddisflies) – -- -- -- -- -- -- -- -- -- --<br />
Glossosomatidae – -- -- -- -- -- -- -- -- -- --<br />
Protoptila sp. – -- -- -- -- -- -- -- -- 12 --<br />
Hydroptilidae (microcaddis) – -- -- -- -- -- -- -- -- -- --<br />
Hydroptila sp. – -- -- 28 -- -- -- -- -- -- --<br />
Hydropsychidae – -- -- -- -- -- -- -- -- -- --<br />
Cheumatopsyche sp. Chpsyche 17 -- -- 11 9 10 -- -- -- 158<br />
Hydropsyche sp. – -- -- -- -- -- -- -- -- -- 361<br />
Macrostemum carolina – -- -- -- -- -- -- -- -- -- 74<br />
Leptoceridae – -- -- -- -- -- -- -- -- -- --<br />
Oecetis sp. – -- -- -- -- -- -- -- -- -- 25<br />
Polycentropodidae – -- -- -- -- -- -- -- -- -- --<br />
Paranyctiophylax sp. – -- -- -- -- -- -- -- -- -- 60<br />
TOTAL ABUNDANCE 930 372 1,052 2,570 707 119 122 525 1,990 2,473<br />
72<br />
Densities<br />
Abbreviated site names (see table 1, appendix 1)<br />
East<br />
Lacassine<br />
Church<br />
Point Mallet Guidry Blue<br />
Upper<br />
Des<br />
Cannes Caney Whisky
73<br />
Appendix 9. Loadings <strong>of</strong> <strong>environmental</strong> variables on the first two principal components (PC) derived from principal components analysis (PCA) <strong>of</strong> <strong>ecological</strong><br />
data-collection sites in southwestern Louisiana, 2001<br />
[Environmental variables with boldface values were selected for use in canonical correspondence analysis based on multiple iterations <strong>of</strong> PCA <strong>and</strong>/or considered important for describing <strong>water</strong> <strong>quality</strong><br />
<strong>and</strong> aquatic invertebrate communities in an agricultural l<strong>and</strong>-use <strong>setting</strong> in southwestern Louisiana. mi 2 , square mile; mg/L, milligrams per liter; µS/cm, microsiemens per centimeter at 25 degrees Celsius;<br />
NTU, nephelometric turbidity units; ºC, degrees Celsius; µg/L, micrograms per liter; m, meter; ft/s, feet per second; RBP, Rapid Bioassessment Protocols (Barbour <strong>and</strong> others, 1999)]<br />
Number <strong>and</strong> description <strong>of</strong><br />
<strong>environmental</strong> variable<br />
PC1 PC2 Correlations*<br />
Number <strong>and</strong> description <strong>of</strong><br />
<strong>environmental</strong> variable<br />
* Environmental variables with variable number(s) are correlated with these variables based on a Spearmann-rank correlation test with an alpha value <strong>of</strong> 0.05.<br />
** Separate principal components analysis was performed on stream habitat measurements.<br />
PC1 PC2 Correlations*<br />
SITE CHARACTERISTICS WATER QUALITY (Cont.)<br />
General Herbicides <strong>and</strong> degradation products (Cont.)<br />
1 Drainage basin area (mi 2 ) 0.55 0.42 49, 53 31 Molinate -0.24 0.70 33<br />
2 Rice agriculture by basin (percent) -0.45 0.81 32 Tebuthiuron -0.36 0.49<br />
33 Herbicides, cumulative -0.63 0.68<br />
WATER QUALITY Insecticides <strong>and</strong> degradation products<br />
Physiochemical Data 34 Desulfinyl -0.81 -0.47 35<br />
Dissolved oxygen (mg/L) 35 Fipronil -0.90 -0.31 37, 38<br />
3 Time <strong>of</strong> biological sampling 0.19 0.09 36 Fipronil, maximum -0.76 0.06<br />
4 1-month low -0.32 0.37 37 Sulfide -0.74 -0.43 38<br />
pH 38 Sulfone -0.90 -0.37<br />
5 Time <strong>of</strong> biological sampling -0.53 0.20 6, 9, 10, 15, 27<br />
Specific conductance (µS/cm) STREAM HABITAT**<br />
6 Time <strong>of</strong> biological sampling -0.71 -0.03 9, 10, 13, 15, 27, 66 Quantitative measurements (mean values)<br />
Turbidity (NTU’s) 39 Bank angle (degrees) -0.57 -0.56<br />
7 Time <strong>of</strong> biological sampling -0.79 0.25 18, 24, 28, 44, 48 40 Bank erosion score -0.55 -0.42<br />
Water temperature (°C): 41 Bank height (m) -0.29 -0.83 42<br />
8 Time <strong>of</strong> biological sampling 0.03 0.12 42 Bank stability index -0.29 -0.85<br />
Water-Quality Data (mg/L) 43 Bank vegetative cover (percent availability) -0.66 -0.43<br />
9 Alkalinity (as calcium carbonate) -0.62 0.06 10, 15, 27 44 Euphotic zone depth (m) 0.44 -0.41 48<br />
10 Calcium, dissolved -0.60 -0.04 15, 27 45 Habitat cover (percent availability) 0.49 0.35<br />
Carbon, organic: 46 Open canopy (percent) -0.06 0.66<br />
11 Dissolved -0.01 -0.06 47 Riparian canopy closure (percent) 0.46 0.04<br />
12 Suspended -0.69 0.19 48 Secchi disk depth (m) 0.45 -0.44<br />
13 Chloride, dissolved -0.85 -0.17 19, 20, 21, 25, 27, 35, 38 49 Stream bankfull channel width (m) -0.60 0.73 53<br />
14 Chlorophyll-a (µg/L) -0.63 0.39 50 Stream depth (m) 0.16 0.64 53<br />
15 Magnesium, dissolved -0.60 -0.02 27 51 Stream open angle (degrees) -0.06 0.66<br />
Nitrogen (as N) 52 Stream velocity (ft/s) -0.09 -0.63<br />
16 Ammonia, dissolved -0.38 0.18 24 53 Stream wetted channel width (m) 0.51 0.68<br />
17 Ammonia + organic, dissolved -0.55 -0.16 54 Visual algae growth (percent availability) -0.19 0.13<br />
18 Ammonia + organic, total -0.85 0.09 24, 28, 44, 48 55 Width-to-depth ratio 0.53 -0.05<br />
19 Nitrite, dissolved 0.28 -0.40 20, 21, 25 56 Woody debris (snag, percent availability) 0.23 0.12<br />
20 Nitrate, dissolved -0.73 -0.28 21 Qualitative measurements<br />
21 Nitrite + nitrate, dissolved -0.74 -0.26 25 RBP parameters (each score, 0-20 )<br />
Phosphorus (as P) 57 Bank stability 0.63 0.13<br />
22 Dissolved -0.13 0.15 23 58 Bank vegetation protection 0.61 0.08<br />
23 Ortho, dissolved -0.19 0.21 59 Channel alteration 0.53 -0.40<br />
24 Total -0.80 0.27 44, 48 60 Channel flow status 0.55 0.07<br />
25 Potassium, dissolved -0.79 -0.06 61 Channel sinuosity 0.72 -0.02<br />
26 Silicon, dissolved 0.08 -0.05 62 Instream cover 0.83 -0.04<br />
27 Sodium, dissolved -0.74 0.03 63 Pool substrate characterization 0.80 -0.19<br />
28 Suspended sediments, total -0.85 0.13 44, 48 64 Pool variability 0.63 -0.06<br />
Herbicides <strong>and</strong> degradation products 65 Riparian vegetative zone width 0.52 0.08<br />
29 Atrazine -0.31 0.42 33 66 Sediment deposition 0.55 -0.40<br />
30 Metolachlor -0.30 -0.09 67 RBP total site score (0-200) 0.91 -0.13