Mitchell, T. J. (2010) An exploration of evolutionary computation ...
Mitchell, T. J. (2010) An exploration of evolutionary computation ...
Mitchell, T. J. (2010) An exploration of evolutionary computation ...
You also want an ePaper? Increase the reach of your titles
YUMPU automatically turns print PDFs into web optimized ePapers that Google loves.
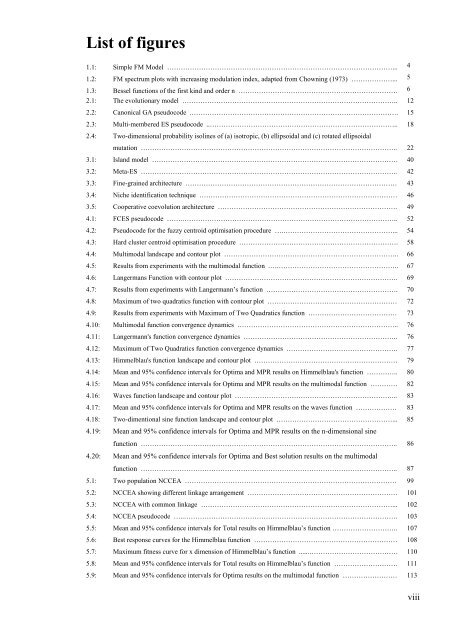
List <strong>of</strong> figures<br />
1.1: Simple FM Model ………………………………………………………………………………………... 4<br />
1.2: FM spectrum plots with increasing modulation index, adapted from Chowning (1973) ………………... 5<br />
1.3: Bessel functions <strong>of</strong> the first kind and order n ……………………………………………………………. 6<br />
2.1: The <strong>evolutionary</strong> model ………………………………………………………………………………….. 12<br />
2.2: Canonical GA pseudocode .………………………………………………………………………………. 15<br />
2.3: Multi-membered ES pseudocode ..……………………………………………………………………….. 18<br />
2.4: Two-dimensional probability isolines <strong>of</strong> (a) isotropic, (b) ellipsoidal and (c) rotated ellipsoidal<br />
mutation …………………………………………………………………………………………………..<br />
3.1: Island model ……………………………………………………………………………………………… 40<br />
3.2: Meta-ES ………………………………………………………………………………………………….. 42<br />
3.3: Fine-grained architecture ………………………………………………………………………………… 43<br />
3.4: Niche identification technique …………………………………………………………………………… 46<br />
3.5: Cooperative coevolution architecture ……………………………………………………………………. 49<br />
4.1: FCES pseudocode …….………………………………………………………………………………….. 52<br />
4.2: Pseudocode for the fuzzy centroid optimisation procedure ….…………………………………………... 54<br />
4.3: Hard cluster centroid optimisation procedure ……………………………………………………………. 58<br />
4.4: Multimodal landscape and contour plot ………………………………………………………………….. 66<br />
4.5: Results from experiments with the multimodal function .….…………………………………………….. 67<br />
4.6: Langermans Function with contour plot …………………………………………………………………. 69<br />
4.7: Results from experiments with Langermann‘s function …………………………………………………. 70<br />
4.8: Maximum <strong>of</strong> two quadratics function with contour plot ………………………………………………… 72<br />
4.9: Results from experiments with Maximum <strong>of</strong> Two Quadratics function ………………………………… 73<br />
4.10: Multimodal function convergence dynamics …………………………………………………………….. 76<br />
4.11: Langermann's function convergence dynamics ………………………………………………………….. 76<br />
4.12: Maximum <strong>of</strong> Two Quadratics function convergence dynamics …………………………………………. 77<br />
4.13: Himmelblau's function landscape and contour plot ……………………………………………………… 79<br />
4.14: Mean and 95% confidence intervals for Optima and MPR results on Himmelblau's function ………….. 80<br />
4.15: Mean and 95% confidence intervals for Optima and MPR results on the multimodal function ………… 82<br />
4.16: Waves function landscape and contour plot ……………………………………………………………... 83<br />
4.17: Mean and 95% confidence intervals for Optima and MPR results on the waves function ……………… 83<br />
4.18: Two-dimentional sine function landscape and contour plot ……………………………………………... 85<br />
4.19: Mean and 95% confidence intervals for Optima and MPR results on the n-dimensional sine<br />
function …………………………………………………………………………………………………..<br />
4.20: Mean and 95% confidence intervals for Optima and Best solution results on the multimodal<br />
function …………………………………………………………………………………………………..<br />
5.1: Two population NCCEA ………………………………………………………………………………… 99<br />
5.2: NCCEA showing different linkage arrangement ………………………………………………………… 101<br />
5.3: NCCEA with common linkage …………………………………………………………………………... 102<br />
5.4: NCCEA pseudocode …..…………………………………………………………………………………. 103<br />
5.5: Mean and 95% confidence intervals for Total results on Himmelblau‘s function ……………………….. 107<br />
5.6: Best response curves for the Himmelblau function ……………………………………………………… 108<br />
5.7: Maximum fitness curve for x dimension <strong>of</strong> Himmelblau‘s function ......………………………………… 110<br />
5.8: Mean and 95% confidence intervals for Total results on Himmelblau‘s function ………………………. 111<br />
5.9: Mean and 95% confidence intervals for Optima results on the multimodal function …………………… 113<br />
22<br />
86<br />
87<br />
viii


