

Environmental Variability and Climate Change
Environmental Variability and Climate Change
Environmental Variability and Climate Change

You also want an ePaper? Increase the reach of your titles
YUMPU automatically turns print PDFs into web optimized ePapers that Google loves.
8, page 14). Attempts to extend such experiments<br />
to the last 1000 years <strong>and</strong> compare with multiproxy<br />
global climate reconstructions are currently<br />
underway. Intermediate complexity models have<br />
reconstructed the mean annual, northern hemisphere<br />
average temperature of the last millennium with<br />
reasonable accuracy. In these experiments, the<br />
warming of the last century is achieved only when<br />
enhanced greenhouse gas levels due to human<br />
activities are included.<br />
Temperature Variations (°C)<br />
0.6<br />
0.4<br />
0.2<br />
0<br />
–0.2<br />
–0.4<br />
Figure 11<br />
1000 year record of global average temperature<br />
Data<br />
Model<br />
–0.6 1000 1200 1400 1600 1800 2000<br />
Year AD<br />
Comparison of decadally-smoothed Northern Hemisphere<br />
mean annual temperature records for the past<br />
millennium <strong>and</strong> an energy balance model calculation<br />
employing both natural forcing <strong>and</strong> recent greenhouse<br />
gas level increases. The dashed yellow lines defi ne the<br />
upper <strong>and</strong> lower boundaries of the 95% confi dence<br />
interval.<br />
sources: Crowley (2000)Science 289:270-277.<br />
How has El Niño activity changed over time?<br />
Annual growth b<strong>and</strong>s laid down by corals provide<br />
rich archives of paleoclimatic information. Changing<br />
proportions of the stable isotopes of oxygen in the<br />
calcium carbonate layers, along with variations in the<br />
relative abundances of such elements as strontium<br />
<strong>and</strong> calcium are used to assess past temperature<br />
<strong>and</strong> salinity of the near-surface waters in which<br />
the corals grew. These show that the frequency of<br />
El Niños in the tropics has changed through time.<br />
This has global implications because El Niños affect<br />
worldwide weather patterns.<br />
El Niños are marked by widespread warming of<br />
the surface waters in the eastern equatorial Pacifi c,<br />
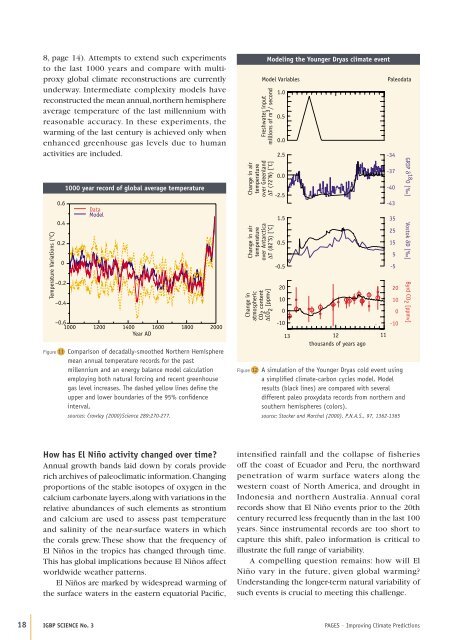
Figure 12<br />
Modeling the Younger Dryas climate event<br />
A simulation of the Younger Dryas cold event using<br />
a simplifi ed climate-carbon cycles model. Model<br />
results (black lines) are compared with several<br />
different paleo proxydata records from northern <strong>and</strong><br />
southern hemispheres (colors).<br />
source: Stocker <strong>and</strong> Marchal (2000). P.N.A.S., 97, 1362-1365<br />
intensified rainfall <strong>and</strong> the collapse of fisheries<br />
off the coast of Ecuador <strong>and</strong> Peru, the northward<br />
penetration of warm surface waters along the<br />
western coast of North America, <strong>and</strong> drought in<br />
Indonesia <strong>and</strong> northern Australia. Annual coral<br />
records show that El Niño events prior to the 20th<br />
century recurred less frequently than in the last 100<br />
years. Since instrumental records are too short to<br />
capture this shift, paleo information is critical to<br />
illustrate the full range of variability.<br />
A compelling question remains: how will El<br />
Niño vary in the future, given global warming?<br />
Underst<strong>and</strong>ing the longer-term natural variability of<br />
such events is crucial to meeting this challenge.<br />
18 IGBP SCIENCE No. 3 PAGES – Improving <strong>Climate</strong> Predictions<br />
Freshwater input<br />
millions of m 3 / second<br />
<strong>Change</strong> in air<br />
temperature<br />
over Greenl<strong>and</strong><br />
∆T (72˚N) [˚C]<br />
<strong>Change</strong> in air<br />
temperature<br />
over Antarctica<br />
∆T (82˚S) [˚C]<br />
<strong>Change</strong> in<br />
atmospheric<br />
CO2 content<br />
∆CO<br />
2<br />
[ppmv]<br />
Model Variables Paleodata<br />
1.0<br />
0.5<br />
0.0<br />
2.5<br />
0.0<br />
-2.5<br />
1.5<br />
0.5<br />
-0.5<br />
20<br />
10<br />
0<br />
-10<br />
13 12<br />
thous<strong>and</strong>s of years ago<br />
11<br />
-34<br />
-37<br />
-40<br />
-43<br />
35<br />
25<br />
15<br />
5<br />
-5<br />
20<br />
10<br />
0<br />
-10<br />
GRIP δ 18 O [‰] Vostok δD [‰] Byrd CO 2 [ppmv]


