

Environmental Variability and Climate Change
Environmental Variability and Climate Change
Environmental Variability and Climate Change

Create successful ePaper yourself
Turn your PDF publications into a flip-book with our unique Google optimized e-Paper software.
period, establishment of forest ecosystems lagged<br />
behind temperature changes by up to two thous<strong>and</strong><br />
years, depending on altitude. Although past climate<br />
changes are marked by disruptions of ecosystem<br />
composition, the responses vary greatly from species<br />
to species <strong>and</strong> between different types of ecosystem.<br />
In more recent times, the impact of human activities<br />
on many ecosystems has been both to fragment <strong>and</strong><br />
to impoverish. These changes are likely to exacerbate<br />
the disruption of ecosystem function <strong>and</strong> complicate<br />
underst<strong>and</strong>ing of ecosystem response to future<br />
climate change.<br />
Can biota adjust to ongoing <strong>and</strong><br />
projected rates of climate change?<br />
The rate <strong>and</strong> magnitude of projected climate change will<br />
cause major disruptions of present-day ecosystems <strong>and</strong><br />
species distribution. Individual species, for example, will<br />
need to shift their ranges at rates that are 10-40 times<br />
faster than has been observed since at least the last ice age<br />
if they are to maintain equilibrium with projected climate<br />
changes. It seems unlikely that such adjustments will be<br />
possible given the presently fragmented nature of most<br />
l<strong>and</strong>scapes. In light of these potential lags in the biotic<br />
response to climate change, ecological instability <strong>and</strong><br />
the occurrence of natural disturbances, like wildfi res, will<br />
probably increase.<br />
To what extent have past ecosystem changes<br />
affected climate?<br />
Most of the evidence for climate feedbacks from the<br />
terrestrial biosphere comes from model simulations<br />
<strong>and</strong> data-model comparisons. Model simulations<br />
often best match paleodata when feedbacks from<br />
vegetation <strong>and</strong> soils are included. The rapid pace of<br />
warming at high latitudes in Eurasia at the end of<br />
the last glaciation, for example, involved changes<br />
in the amount of solar energy refl ected into space<br />
associated with the transformation of l<strong>and</strong> cover<br />
from permanent snow to soils <strong>and</strong> forests. The<br />
maintenance of vegetation in the Sahara several<br />
thous<strong>and</strong> years ago also probably involved climatic<br />
feedbacks. The vegetation seems to have been a<br />
crucial element in driving the climate to a state<br />
which then supported more vegetation. In more<br />
recent times, some feedbacks may have resulted from<br />
deforestation as dem<strong>and</strong> for pasture <strong>and</strong> farml<strong>and</strong><br />
has increased.<br />
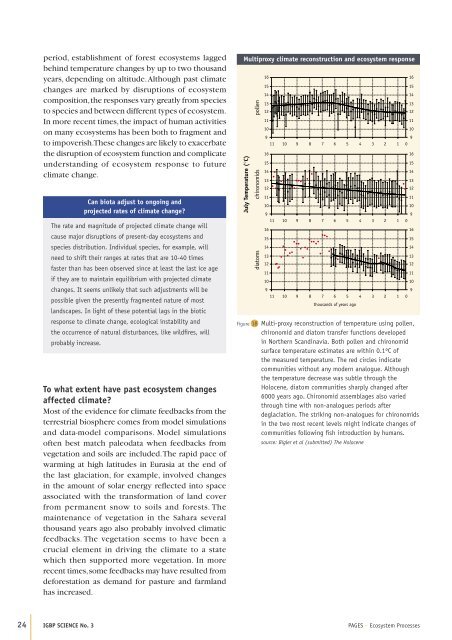
Multiproxy climate reconstruction <strong>and</strong> ecosystem response<br />
Figure 18<br />
16<br />
15<br />
14<br />
13<br />
12<br />
11<br />
10<br />
9<br />
11 10 9 8 7 6 5 4 3 2 1<br />
Multi-proxy reconstruction of temperature using pollen,<br />
chironomid <strong>and</strong> diatom transfer functions developed<br />
in Northern Sc<strong>and</strong>inavia. Both pollen <strong>and</strong> chironomid<br />
surface temperature estimates are within 0.1ºC of<br />
the measured temperature. The red circles indicate<br />
communities without any modern analogue. Although<br />
the temperature decrease was subtle through the<br />
Holocene, diatom communities sharply changed after<br />
6000 years ago. Chironomid assemblages also varied<br />
through time with non-analogues periods after<br />
deglaciation. The striking non-analogues for chironomids<br />
in the two most recent levels might indicate changes of<br />
communities following fi sh introduction by humans.<br />
source: Bigler et al (submitted) The Holocene<br />
24 IGBP SCIENCE No. 3 PAGES – Ecosystem Processes<br />
July Temperature (°C)<br />
pollen<br />
chironomids<br />
diatoms<br />
16<br />
15<br />
14<br />
13<br />
12<br />
11<br />
10<br />
9<br />
11 10 9 8 7 6 5 4 3 2 1<br />
16<br />
15<br />
14<br />
13<br />
12<br />
11<br />
10<br />
9<br />
11 10 9 8 7 6 5 4 3 2 1<br />
thous<strong>and</strong>s of years ago<br />
16<br />
15<br />
14<br />
13<br />
12<br />
11<br />
10<br />
9<br />
0<br />
16<br />
15<br />
14<br />
13<br />
12<br />
11<br />
10<br />
9<br />
0<br />
16<br />
15<br />
14<br />
13<br />
12<br />
11<br />
10<br />
9<br />
0


