Manifestation of multiband optical properties of MgB2
Manifestation of multiband optical properties of MgB2
Manifestation of multiband optical properties of MgB2

Create successful ePaper yourself
Turn your PDF publications into a flip-book with our unique Google optimized e-Paper software.
480<br />
Intensity<br />
and low-energy interband excitations. We also report theoretical<br />
calculation <strong>of</strong> the same quantity, including the<br />
electron±phonon interaction (EPI) and the polycrystalline<br />
nature <strong>of</strong> the sample. We suggest that the intraband conductivity<br />
consists <strong>of</strong> two qualitatively different components: a<br />
narrow Drude peak (DP) due to the s-bands, and an overdamped<br />
DP due to the p-band electrons. The latter scatter so<br />
strongly in our sample that one may expect deviations from<br />
the Drude shape due to localization effects, and indeed we<br />
®nd that the feature in question deviates from the Drude<br />
formula. This model explains naturally a yet unresolved<br />
paradox <strong>of</strong> the two-band scenario [5,12]: the absence <strong>of</strong> a<br />
pair-breaking by paramagnetic impurities, predicted for<br />
two-gap superconductors [13]. In this communication we<br />
concentrate on the broad-range <strong>optical</strong> <strong>properties</strong> keeping<br />
the FIR study <strong>of</strong> the superconducting gap for a separate<br />
publication.<br />
The sample was synthesized from high-purity powdered<br />
A.B. Kuz'menko et al. / Solid State Communications 121 (2002) 479±484<br />
60<br />
40<br />
(a)<br />
20<br />
20<br />
0<br />
0<br />
0<br />
38<br />
100 200<br />
T(K)<br />
40<br />
300<br />
100<br />
101<br />
χ (emu/g)<br />
0.00<br />
-0.02<br />
(b)<br />
FC<br />
ZFC<br />
-0.04<br />
0 20 40<br />
T(K)<br />
(c) MgO<br />
002<br />
110<br />
102<br />
111<br />
*<br />
*<br />
30 40 50 60 70 80 90 100<br />
2θ (deg.)<br />
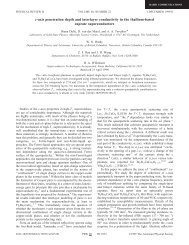
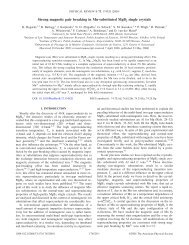
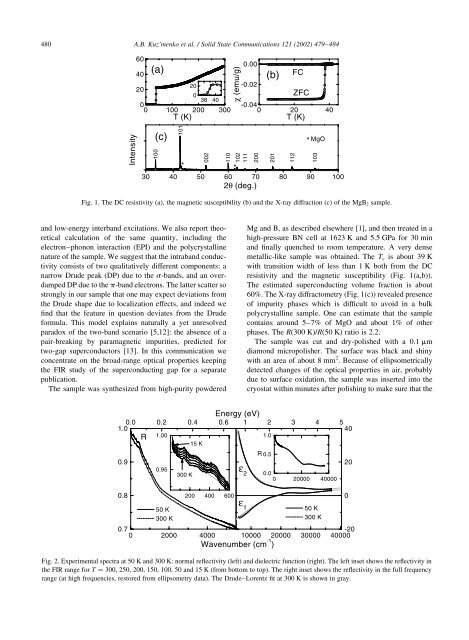
Fig. 1. The DC resistivity (a), the magnetic susceptibility (b) and the X-ray diffraction (c) <strong>of</strong> the MgB 2 sample.<br />
0.9<br />
0.8<br />
0.7<br />
0 2000 4000<br />
200<br />
201<br />
112<br />
*<br />
103<br />
Mg and B, as described elsewhere [1], and then treated in a<br />
high-pressure BN cell at 1623 K and 5.5 GPa for 30 min<br />
and ®nally quenched to room temperature. A very dense<br />
metallic-like sample was obtained. The T c is about 39 K<br />
with transition width <strong>of</strong> less than 1 K both from the DC<br />
resistivity and the magnetic susceptibility (Fig. 1(a,b)).<br />
The estimated superconducting volume fraction is about<br />
60%. The X-ray diffractometry (Fig. 1(c)) revealed presence<br />
<strong>of</strong> impurity phases which is dif®cult to avoid in a bulk<br />
polycrystalline sample. One can estimate that the sample<br />
contains around 5±7% <strong>of</strong> MgO and about 1% <strong>of</strong> other<br />
phases. The R(300 K)/R(50 K) ratio is 2.2.<br />
The sample was cut and dry-polished with a 0.1 mm<br />
diamond micropolisher. The surface was black and shiny<br />
with an area <strong>of</strong> about 8 mm 2 . Because <strong>of</strong> ellipsometrically<br />
detected changes <strong>of</strong> the <strong>optical</strong> <strong>properties</strong> in air, probably<br />
due to surface oxidation, the sample was inserted into the<br />
cryostat within minutes after polishing to make sure that the<br />
Energy (eV)<br />
0.0<br />
1.0<br />
0.2 0.4 0.6 1 2 3 4 5<br />
40<br />
R 1.00<br />
1.0<br />
15 K<br />
0.95<br />
50 K<br />
300 K<br />
300 K<br />
200 400 600<br />
ε 2<br />
ε 1<br />
R 0.5<br />
Wavenumber (cm -1 )<br />
0.0<br />
0 20000 40000<br />
50 K<br />
300 K<br />
20<br />
10000 20000 30000 40000<br />
-20<br />
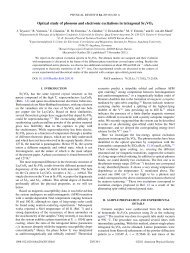
Fig. 2. Experimental spectra at 50 K and 300 K: normal re¯ectivity (left) and dielectric function (right). The left inset shows the re¯ectivity in<br />
the FIR range for T ˆ 300; 250, 200, 150, 100, 50 and 15 K (from bottom to top). The right inset shows the re¯ectivity in the full frequency<br />
range (at high frequencies, restored from ellipsometry data). The Drude±Lorentz ®t at 300 K is shown in gray.<br />
0