software to fit optical spectra - Quantum Materials Group
software to fit optical spectra - Quantum Materials Group
software to fit optical spectra - Quantum Materials Group

You also want an ePaper? Increase the reach of your titles
YUMPU automatically turns print PDFs into web optimized ePapers that Google loves.
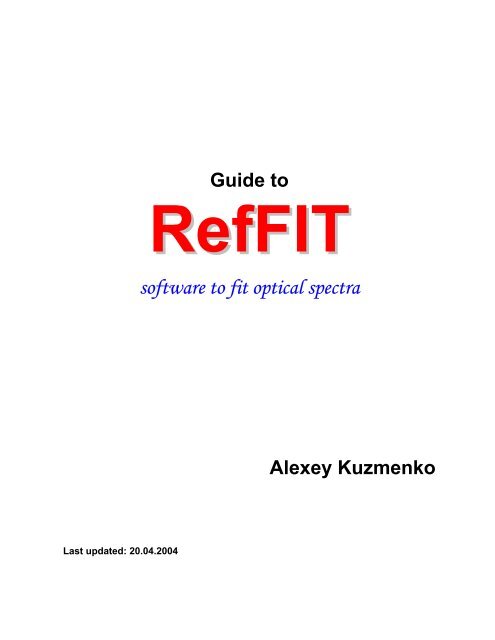
Last updated: 20.04.2004<br />
Guide <strong>to</strong><br />
RefFIT<br />
<strong>software</strong> <strong>to</strong> <strong>fit</strong> <strong>optical</strong> <strong>spectra</strong><br />
Alexey Kuzmenko
Contents<br />
1. Introduction ....................................................................................................... 4<br />
1.1. Foreword ...................................................................................................................... 4<br />
1.2. What is RefFIT for? ..................................................................................................... 5<br />
1.3. About this manual ........................................................................................................ 6<br />
1.4. Let’s keep in <strong>to</strong>uch ....................................................................................................... 7<br />
2. Basics of <strong>optical</strong> data <strong>fit</strong>ting.............................................................................. 8<br />
2.1. Non-linear modeling..................................................................................................... 8<br />
2.1.1. Levenberg-Marquardt algorithm ......................................................................9<br />
2.1.2. Simultaneous <strong>fit</strong>ting of several datasets of different types.............................12<br />
2.1.3. Confidence limits............................................................................................13<br />
2.2. Modeling of the dielectric functions .......................................................................... 14<br />
2.2.1. Physical properties of the dielectric functions................................................14<br />
2.2.2. Why modeling? ..............................................................................................15<br />
2.2.3. Formula-defined dielectric functions .............................................................16<br />
2.2.4. Variational (free-shape) dielectric functions (KK-constrained).....................17<br />
2.2.5. ‘Not-KK-constrained’ variational dielectric functions...................................22<br />
2.3. Differential modeling ................................................................................................. 23<br />
3. Tu<strong>to</strong>rial ............................................................................................................ 25<br />
3.1. Drude-Lorentz <strong>fit</strong>ting of a reflectivity spectrum ........................................................ 25<br />
3.2. Simultaneous <strong>fit</strong>ting of several data types.................................................................. 36<br />
3.3. Using macros.............................................................................................................. 42<br />
3.3.1. Writing a simple macro ..................................................................................42<br />
3.3.2. Using cycles in a macro: the temperature dependence of phonon <strong>spectra</strong> .....44<br />
4. Reference......................................................................................................... 51<br />
4.1. System requirements .................................................................................................. 51<br />
4.2. Installation and starting RefFIT ................................................................................. 51<br />
4.3. Parameters .................................................................................................................. 52<br />
4.4. Experimental Parameters............................................................................................ 53<br />
4.5. Models........................................................................................................................ 54<br />
4.5.1. Saving and loading models.............................................................................54<br />
4.5.2. Editing models................................................................................................55<br />
4.5.3. Model types ....................................................................................................55<br />
4.6. “Dielectric function” model ....................................................................................... 56<br />
4.6.1. Drude-Lorentz dielectric function ..................................................................59<br />
4.6.2. Special dielectric functions.............................................................................59<br />
4.6.3. Variational (free-shape) dielectric function....................................................62<br />
4.7. Special models............................................................................................................ 63<br />
4.7.1. Differential dielectric function .......................................................................64<br />
4.7.2. Reflection and transmission of a multi-layer sample .....................................64<br />
4.7.3. Ellipsometry of an orthorhombic sample .......................................................66<br />
4.7.4. Differential ellipsometry of an orthorhombic sample ....................................68<br />
4.7.5. Ellipsometry of an orthorhombic film on an orthorhombic substrate ............68<br />
4.7.6. Extended Drude ..............................................................................................70<br />
Guide <strong>to</strong> RefFIT Page 2
4.8. Dataset manager ......................................................................................................... 71<br />
4.8.1. Loading and unloading datasets .....................................................................72<br />
4.9. Graphs ........................................................................................................................ 73<br />
4.9.1. Graph properties .............................................................................................74<br />
4.9.2. Graph contents................................................................................................75<br />
4.10. Fit window.................................................................................................................. 76<br />
4.10.1. Setting up the <strong>fit</strong>ting task................................................................................76<br />
4.10.2. Fitting options.................................................................................................78<br />
4.10.3. Starting/s<strong>to</strong>pping <strong>fit</strong>ting process.....................................................................79<br />
4.11. Macro language .......................................................................................................... 79<br />
4.11.1. Writing and executing macros........................................................................79<br />
4.11.2. Macro syntax ..................................................................................................80<br />
4.11.3. General macro commands ..............................................................................81<br />
4.11.4. Dataset macro commands...............................................................................82<br />
4.11.5. Model macro commands ................................................................................84<br />
4.11.6. Graph macro commands.................................................................................87<br />
4.11.7. Experimental parameters macro commands...................................................91<br />
4.11.8. Fitting macro commands ................................................................................91<br />
4.11.9. Loop macro commands ..................................................................................92<br />
5. Bibliography.................................................................................................... 94<br />
Guide <strong>to</strong> RefFIT Page 3
1. Introduction<br />
1.1. Foreword<br />
As a scientist, I am supposed <strong>to</strong> do experiments and publish articles, not <strong>to</strong> mention the<br />
teaching, so you can imagine that little time is left for programming and, especially, writing<br />
manuals. However, I had <strong>to</strong> make RefFIT because no other <strong>software</strong> was flexible and fast<br />
enough <strong>to</strong> model <strong>spectra</strong>l data in the way I wanted. It represents, if you want, my idea of data<br />
<strong>fit</strong>ting. Initially it was a little DOS program for a Drude-Lorentz <strong>fit</strong>ting of the reflection<br />
coefficient (this is where its name comes from). Somewhat later it has grown in<strong>to</strong> a sizeable<br />
Windows application intended <strong>to</strong> facilitate modeling and the extraction of the complex<br />
dielectric function from various kinds of <strong>optical</strong> experiments, such as reflectivity, transmission,<br />
ellipsometry etc. measured on different kinds of samples (anisotropic, layered etc.). The<br />
following principles have formed the basis of RefFIT: (i) it should be possible combine<br />
different types of <strong>spectra</strong> and <strong>fit</strong> them simultaneously, (ii) a user should be able <strong>to</strong> see in real<br />
time how does the <strong>fit</strong>ting come about (and not <strong>to</strong> wait until the program finishes and gives birth<br />
<strong>to</strong> an output file, which yet has <strong>to</strong> be painted by a graphical package), (iii) the program should<br />
run as fast as possible (iv) there should be a macro language for routine operations.<br />
Initially I did not bother with any written manuals. When some of my colleagues found it<br />
useful, it was possible <strong>to</strong> explain privately, how RefFIT works. However, as more people<br />
become interested in it, I realized that a manual would help a lot. It has become even more<br />
evident after I had <strong>to</strong> look in<strong>to</strong> this guide a couple of times myself (the human memory is not<br />
that long!).<br />
I have <strong>to</strong> emphasize, that RefFIT is not professional <strong>software</strong>, designed in accordance<br />
with established interface and compatibility standards, but rather a home-made <strong>to</strong>ol, sharpened<br />
<strong>to</strong> solve particular class of problems by someone, who deals with these problems every day.<br />
Unfortunately, it is not ‘fool-proof’ so, please, be prepared that it may crash unexpectedly. All<br />
formulas RefFIT uses were carefully checked and tested. However I would not take ‘any legal<br />
responsibility’ for possibly overlooked mistakes and the ‘consequences, caused by those’<br />
(please, let me know, if you find any). Some commands and conventions look rather strange<br />
because they were put as temporary solutions, but are still in there. Many improvements <strong>to</strong><br />
RefFIT are planned for a long time but not have been done yet. Nevertheless, I dare <strong>to</strong> offer<br />
you this program already now because in spite of its ‘child diseases’ RefFIT works and nicely<br />
solves most of <strong>fit</strong>ting problems that we encounter in our lab. I would be happy if you can find it<br />
useful <strong>to</strong>o.<br />
Before I start let me acknowledge those who contributed directly or indirectly <strong>to</strong> the<br />
creation of this program. The very idea of RefFIT has appeared during my graduate study<br />
(1995-1999) in P.L.Kapitza Institute for Physical Problems (Moscow) as a result of<br />
enlightening discussions with my PhD adviser, professor E.A.Tishchenko, who was also my<br />
first teacher of <strong>optical</strong> spectroscopy. When first visited in 1998 and came in 2000 as a postdoc<br />
<strong>to</strong> the Optical Solid State group headed by professor Dirk van der Marel (University of<br />
Groningen and, currently, University of Geneva) I was deeply impressed by his versatile<br />
OPTPAL program [1], also designed <strong>to</strong> <strong>fit</strong> <strong>optical</strong> data, but much more powerful than RefFIT at<br />
Guide <strong>to</strong> RefFIT Page 4
that time. The later development of RefFIT was <strong>to</strong> a great extent governed by a desire <strong>to</strong><br />
combine the best OPTPAL features with a user-friendly interface. The creative science<br />
atmosphere of Dirk’s group is very stimulating for me. I must specially acknowledge Patricio<br />
Mena, who helped me a lot <strong>to</strong> improve RefFIT by using it extensively in his PhD study and<br />
even writing several subroutines. And, of course, I want <strong>to</strong> thank all my colleagues who elected<br />
<strong>to</strong> use RefFIT as their computational <strong>to</strong>ol and thus furthered its evolution.<br />
1.2. What is RefFIT for?<br />
One can generally say that RefFIT is designed <strong>to</strong> analyze the <strong>optical</strong> <strong>spectra</strong> of solids.<br />
Clearly, this statement has <strong>to</strong> be a bit specified, because there are myriads of thinkable <strong>optical</strong><br />
experiments and, correspondingly, very different ways <strong>to</strong> analyze them. So which sort of data<br />
are we going <strong>to</strong> deal with and what for ‘analysis’ we are going <strong>to</strong> apply?<br />
First of all, by <strong>optical</strong> <strong>spectra</strong>, we mean frequency-dependent <strong>optical</strong> quantities. An<br />
example of an <strong>optical</strong> spectrum is the frequency-dependent reflectivity R (ω)<br />
, which can be<br />
directly measured. Another example is given by the <strong>optical</strong> conductivity σ (ω)<br />
, which is<br />
usually not measured directly but derived from experimental data after some analysis (or,<br />
alternatively, it can be taken from articles of other groups, which is also a sort of measurement<br />
☺). Of course, in addition <strong>to</strong> the light frequency there might be other experimental parameters,<br />
such as the angle of incidence, a sample thickness etc. Secondly, we put a common dogma, that<br />
the <strong>optical</strong> properties we deal with are determined solely by the complex dielectric function<br />
ε ( ω)<br />
= ε1<br />
( ω)<br />
+ iε<br />
2 ( ω)<br />
of the studied material. Thus, we assume that the measurable <strong>optical</strong><br />
quantities, such as reflection, transmission, ellipsometry outputs etc., are described by the<br />
textbook Fresnel equations [2].<br />
The primary goal of <strong>spectra</strong> analysis, that RefFIT does, is <strong>to</strong> get information about the<br />
material dielectric function on the base of <strong>optical</strong> <strong>spectra</strong>. It is done by the <strong>fit</strong>ting of these<br />
<strong>spectra</strong> using a model of the dielectric function with a set of adjustable parameters. These<br />
parameters are varied in order <strong>to</strong> obtain the best match between the experimental and calculated<br />
data points.<br />
There are two ways <strong>to</strong> model the dielectric function. It might be either a mathematical (or<br />
physical, if you like) formula with a limited number of parameters, or a variational (also called<br />
a ‘free-shape’) dielectric function, which is ‘allowed’ <strong>to</strong> vary independently at every frequency<br />
point [4] (see sections 2.2.4 and 2.2.5). The first possibility is very familiar <strong>to</strong> many (e.g., the<br />
Drude-Lorentz modeling of reflectivity). Although the second one might look uncommon, it is<br />
often implicitly present in the data analysis. For example, in spectroscopic ellipsometry ε 1 and<br />
ε 2 are extracted independently at every frequency from the two measured ellipsometric angles<br />
- ψ and ∆ . The same thing can be done in RefFIT by the <strong>fit</strong>ting of ε (ω)<br />
with a not-Kramers-<br />
Kronig-constrained variational dielectric function (section 2.2.5). Another example is the<br />
conventional Kramers-Kronig transformation of reflectivity [6] (used, by the way, in about<br />
90% of papers on infrared spectroscopy of solids), which can be substituted in RefFIT by the<br />
<strong>fit</strong>ting of R (ω)<br />
by a Kramers-Kronig-constrained variational dielectric function (section 2.2.4).<br />
To make a long s<strong>to</strong>ry short: every analysis that RefFIT does is a <strong>fit</strong>ting!<br />
Guide <strong>to</strong> RefFIT Page 5
For a reliable extraction of ε (ω)<br />
it is often crucial <strong>to</strong> <strong>fit</strong> <strong>spectra</strong> of different types<br />
simultaneously. An example, when the analysis of a single quantity might be rather shaky, is<br />
the already mentioned Kramers-Kronig transformation of reflectivity. It is well known, that the<br />
experimental reflectivity uncertainties and the ambiguity of extrapolations <strong>to</strong> high and low<br />
frequencies in this case can boost the error bars of the resulting dielectric function (or,<br />
equivalently, of the <strong>optical</strong> conductivity). As a rule, it helps a lot <strong>to</strong> supplement the reflectivity<br />
measurement with the ellipsometry or transmission <strong>spectra</strong>. In RefFIT the user can freely<br />
choose the collection of datasets, which should be <strong>fit</strong>ted simultaneously.<br />
An indicative list of the built-in models includes the Drude-Lorentz model, the dielectric<br />
function of a BSC superconduc<strong>to</strong>r, the extended Drude model, ellipsometry, reflection and<br />
transmission of multi-layer and anisotropic samples. Of course, it is hopeless <strong>to</strong> predict all the<br />
experiments that a solid-state <strong>optical</strong> spectroscopist might wish <strong>to</strong> do. Therefore, new models<br />
are added <strong>to</strong> RefFIT from time <strong>to</strong> time in order <strong>to</strong> meet the emerging needs.<br />
The <strong>fit</strong>ting is always a try-and-error activity, which requires a lot of human efforts and<br />
intuition. Sometimes one can spend hours and even days before a proper model is found. In<br />
order <strong>to</strong> ease this procedure, RefFIT was designed in such a way that a user can see the results<br />
of his manipulations with parameters on the graphs in real time.<br />
Once a good model is found, it might be necessary <strong>to</strong> apply it many times in the same<br />
way <strong>to</strong> different datasets, e.g. <strong>to</strong> study temperature dependence of <strong>spectra</strong>. It is obviously not<br />
practical <strong>to</strong> continue doing it ‘by hand’. Do not worry: the built-in macro language greatly<br />
facilitates the execution of lengthy routine calculations in RefFIT.<br />
1.3. About this manual<br />
This manual consists of three major parts.<br />
In Chapter 2 some theoretical aspects of the <strong>optical</strong> data <strong>fit</strong>ting are considered. It starts<br />
with the description of the celebrated Levenberg-Marquardt algorithm for a non-linear<br />
modeling, which is the ‘computational engine’ of RefFIT. Then the physical constraints on the<br />
dielectric functions are discussed, which have <strong>to</strong> be met by a realistic model. We also describe<br />
in details a novel method of the so-called variational dielectric functions (RefFIT is likely the<br />
first program <strong>to</strong> use this technique). Finally, the analysis of differential (modulation) <strong>spectra</strong> is<br />
discussed.<br />
Chapter 3 is a tu<strong>to</strong>rial that shows, step-by-step, how <strong>to</strong> tackle typical <strong>fit</strong>ting problems<br />
with RefFIT. The examples are selected in order <strong>to</strong> cover the most essential features of RefFIT.<br />
Finally, in Chapter 4 you can find the full reference information about RefFIT, including<br />
the description of all its elements (datasets, models, graphs etc.), the exact formulas used <strong>to</strong><br />
calculate <strong>optical</strong> quantities, the macro language and so on.<br />
This manual is not meant <strong>to</strong> be an optics course, so I assume that the reader is familiar<br />
with <strong>optical</strong> spectroscopy. A basic acquaintance with Windows is also assumed.<br />
The screenshots, which I used in the text, are made on my lap<strong>to</strong>p, running under<br />
Windows XP. If you have another Windows version, then the appearance of some graphics on<br />
your screen might look slightly different.<br />
Guide <strong>to</strong> RefFIT Page 6
1.4. Let’s keep in <strong>to</strong>uch<br />
Please, do not hesitate <strong>to</strong> contact me if you have any problems or suggestions regarding<br />
RefFIT or this manual. Depending on the problem, I might be able <strong>to</strong> solve it quickly and send<br />
you an improved program version. It is even feasible <strong>to</strong> include extra features according <strong>to</strong> your<br />
particular needs, provided that these extras are reasonable enough <strong>to</strong> be potentially useful <strong>to</strong><br />
other users. For instance, one can easily put new formulas for the dielectric function, new<br />
model types or new macro commands. It is clear that only the user’s feedback is really able <strong>to</strong><br />
improve the program.<br />
If you wish <strong>to</strong> periodically receive information about the recent developments in RefFIT,<br />
such as new models included, new possibilities added and bugs fixed, you can send me an email.<br />
I would appreciate it if you provide some information about your field of research and the<br />
type of <strong>optical</strong> measurements you do.<br />
My current contact information is:<br />
Phone: +41-22-3793105, Fax: +41-22-3796869<br />
E-mail: Alexey.Kuzmenko@physics.unige.ch<br />
University of Geneva, DPMC, Quai Ernest-Ansermet, 24, 1211 Geneva, Switzerland<br />
You can also address your questions <strong>to</strong> Patricio Mena:<br />
Phone: +31-50-3634921, Fax: +31-50-3634825<br />
E-mail: F.P.Mena@phys.rug.nl<br />
University of Groningen, MSC, Nijenborgh 4, 9747 Groningen, The Netherlands<br />
Guide <strong>to</strong> RefFIT Page 7
2. Basics of <strong>optical</strong> data <strong>fit</strong>ting<br />
2.1. Non-linear modeling<br />
The <strong>fit</strong>ting or modeling of the experimental (in particular, <strong>optical</strong>) data is a process, when<br />
someone looks for a meaningful model with a set of adjustable parameters and varies them in<br />
order <strong>to</strong> get the best match of the model <strong>to</strong> experimental curves.<br />
To find a proper model is usually a central problem, which a computer can hardly do on<br />
its own (we humans are still proud <strong>to</strong> be smarter than the machines we make!). Once a model is<br />
thought up and reasonable initial values of parameters are found, the second stage is <strong>to</strong> vary<br />
them in order <strong>to</strong> get the best <strong>fit</strong>. To continue doing it by hand is usually not practical and even<br />
doable, when there are more than 2 or 3 tangled parameters. It could be even dangerous,<br />
because a ‘reasonably looking’ match might be rather far from the numerically-the-best one.<br />
Fortunately, at this stage the <strong>fit</strong>ting procedure can be very efficiently au<strong>to</strong>mated as described<br />
below.<br />
Suppose, we have a set of N experimental data points { x i , y i , σ i } (i = 1 ,…, N ), that<br />
we want <strong>to</strong> <strong>fit</strong>. Here x i is the data coordinate 1 , y i is the data value and σ i is the data error bar.<br />
Next, we take a model, which calculates the data value y as a function of x , and a set of<br />
internal parameters { p 1 , 2 p … p M }: y = f ( x,<br />
p1<br />
K pM<br />
) .<br />
Let us construct a so-called ‘chi-square’ functional:<br />
N<br />
2 ⎛ yi<br />
− f ( xi<br />
, p1<br />
K pM<br />
) ⎞ 2<br />
χ ≡ ∑ ⎜<br />
⎟<br />
⎜<br />
= χ ( p1,<br />
K p<br />
i 1 σ ⎟<br />
= ⎝<br />
i ⎠<br />
Equation 2-1<br />
2<br />
If we assume that all measured values y i are normally distributed with standard<br />
deviations given by σ i , then ‘statistically-the-best’ match would correspond <strong>to</strong> the minimal<br />
2<br />
value of χ . Thus, the modeling is essentially the minimization of the chi-square with respect<br />
<strong>to</strong> parameters. Therefore, the method itself is called the ‘least-square’ technique.<br />
Of course, the error bars are determined not only by a statistical noise, but also by<br />
systematic inaccuracies, which are very hard <strong>to</strong> estimate and are clearly not normally<br />
distributed 2 . However, <strong>to</strong> move on, we suppose that they are somehow accounted for by the<br />
values σ i .<br />
When f ( x,<br />
p1<br />
K pM<br />
) is a non-linear function of parameters (which is virtually always<br />
the case in <strong>optical</strong> modeling), the so-called Levenberg-Marquardt algorithm of the chi-square<br />
minimization is indispensable. We shall discuss it in the next section.<br />
1 In the case of <strong>optical</strong> data i<br />
x is usually the light frequency.<br />
2 Honestly, I do not believe there is a ‘scientific way’ <strong>to</strong> deal with systematic error bars (tell me if I am wrong!)<br />
Guide <strong>to</strong> RefFIT Page 8<br />
M<br />
)
2.1.1. Levenberg-Marquardt algorithm<br />
The Levenberg-Marquardt (LM) algorithm is based on the self-adjustable balance<br />
between the two minimizing strategies: the ‘gradient descent’ and the ‘inverse Hessian’<br />
methods.<br />
The ‘gradient descent’ method is simply an instinctive moving in the ‘steepest descent’<br />
direction, which is apparently determined by the minus-gradient:<br />
β<br />
Equation 2-2<br />
2<br />
1 ∂χ<br />
−<br />
2 ∂p<br />
N<br />
i i 1<br />
k ≡ = ∑ 2<br />
k i= 1 σ i<br />
y<br />
− f ( x , p , K,<br />
p<br />
M<br />
) ∂f<br />
∂p<br />
( x , p , K,<br />
p<br />
(the one-half coefficient is put <strong>to</strong> simplify the formulas). Suppose, the current parameter values<br />
are p k ( k =1,…, M ). To improve the <strong>fit</strong>, we can ‘shift’ the parameters pk → pk<br />
+ δpk<br />
, where<br />
δ p = ×<br />
k<br />
Equation 2-3<br />
constant β k<br />
The absolute value of the constant we will discuss later. The ‘steepest descent’ strategy is<br />
justified, when one is far from the minimum, but it becomes extremely inefficient in the<br />
‘plateau’ close <strong>to</strong> the minimum, especially in the multi-parameter space.<br />
In the latter case it is much better <strong>to</strong> assume that the function <strong>to</strong> be minimized has almost<br />
parabolic shape, determined by the Hessian:<br />
2 2<br />
1 ∂ χ<br />
α kl ≡<br />
2 ∂pk<br />
∂pl<br />
=<br />
N 1 ⎧ ∂f<br />
∑ 2 ⎨<br />
i= 1 σ i ⎩∂p<br />
k<br />
Equation 2-4<br />
( xi<br />
, p1,<br />
K,<br />
p<br />
M<br />
∂f<br />
)<br />
∂p<br />
l<br />
( x , p , K,<br />
p<br />
i<br />
1<br />
M<br />
) −<br />
Guide <strong>to</strong> RefFIT Page 9<br />
k<br />
i<br />
1<br />
M<br />
[ y − f ( x , p , K,<br />
p ) ]<br />
i<br />
i<br />
1<br />
)<br />
M<br />
2<br />
∂ f<br />
∂p<br />
∂p<br />
k<br />
l<br />
( x , p , K,<br />
p<br />
(the one-half here is also for the sake of simplicity). After the computing, numerically or<br />
analytically, the gradient and the Hessian for the current set of parameters, one can immediately<br />
‘jump’ <strong>to</strong> the minimum by shifting the parameters pk → pk<br />
+ δpk<br />
, where the displacement<br />
vec<strong>to</strong>r δ pk<br />
is determined from the linear system:<br />
M<br />
∑<br />
i=<br />
1<br />
Equation 2-5<br />
α δ = β .<br />
kl pl<br />
k<br />
It was argued (see Ref. [3]), that the term in Equation 2-4, which contains the second<br />
∂ f<br />
derivative<br />
∂pk<br />
∂pl<br />
2<br />
, is not important near the minimum and, moreover, may even destabilize the<br />
<strong>fit</strong>ting process. So, instead of Equation 2-4 we shall define the α-matrix simply as:<br />
i<br />
1<br />
M<br />
⎫<br />
) ⎬<br />
⎭
Equation 2-6<br />
N 1 ∂f<br />
∂f<br />
α kl<br />
( x , 1,<br />
, ) ( , 1,<br />
, )<br />
2<br />
i p K pM<br />
xi<br />
p K pM<br />
.<br />
∂p<br />
∂p<br />
≡ ∑<br />
i= 1 σ i<br />
k<br />
l<br />
Coming back <strong>to</strong> the ‘steepest descent’ technique, one can see that the Equation 2-3 has a<br />
problem with the unit dimensions. Let us suppose that the parameter p k is measured in cm -1 .<br />
Then β k has the units of cm (as the<br />
2<br />
χ is dimensionless) and the constant ought <strong>to</strong> have a<br />
dimension (cm -2 in this case). Therefore it cannot be the same for all parameters, which are<br />
generally measured in different units (seconds, Teslas etc.). The solution is <strong>to</strong> use the<br />
dimensionless constant. The only way <strong>to</strong> get rid of the dimension, is <strong>to</strong> normalize it by α kk :<br />
Equation 2-7<br />
constant<br />
δ p k = × β k .<br />
α<br />
kk<br />
There is an elegant way, due <strong>to</strong> Marquardt, <strong>to</strong> continuously ‘switch’ from one strategy <strong>to</strong><br />
another. Let us consider a ‘diagonally-enhanced’ α-matrix:<br />
′ = α ( 1+<br />
δ λ)<br />
,<br />
Equation 2-8<br />
α kl kl kl<br />
where λ is a dimensionless constant, and replace α kl with α ′ kl in Equation 2-5:<br />
M<br />
∑<br />
i=<br />
1<br />
Equation 2-9<br />
α ′ δ = β .<br />
kl pl<br />
k<br />
If we take λ > 1,<br />
then we can almost neglect the off-diagonal elements and the solution of Equation 2-9 becomes<br />
simply<br />
β k β k<br />
δp<br />
k = = .<br />
α ′ α ( 1+<br />
λ)<br />
Equation 2-10<br />
kk<br />
kk<br />
One can see that Equation 2-10 has the same form, as Equation 2-7. It means that, by increasing<br />
the parameter λ , we approach the ‘steepest descent’ limit.<br />
Now we are ready <strong>to</strong> formulate the LM algorithm, which block diagram is shown in<br />
Figure 2-1.<br />
Guide <strong>to</strong> RefFIT Page 10
Guess initial<br />
parameters<br />
p , , p<br />
1 K<br />
START<br />
M<br />
FINISH<br />
YES<br />
Take a small<br />
value of λ<br />
(e.g. λ = 0.<br />
001)<br />
Figure 2-1. The block diagram of the Levenberg-Marquardt technique, used by RefFIT.<br />
NO<br />
S<strong>to</strong>p<br />
criteria<br />
satisfied<br />
?<br />
λ → 0.<br />
1λ<br />
Compute gradient<br />
β k , Hessian α kl<br />
2 2<br />
and χ = χ<br />
YES 2<br />
χ new<br />
2<br />
< χ cur<br />
?<br />
NO<br />
The minimization process is iterative. One starts with a reasonably small value of λ . At<br />
2 2<br />
every successful iteration ( χ new < χ cur ) it is reduced by a fac<strong>to</strong>r of 10, moving <strong>to</strong>wards the<br />
‘inverse Hessian’ regime. Otherwise it retreats <strong>to</strong> the ‘steepest descent’ regime by being<br />
increased by a fac<strong>to</strong>r of 10. When the so-called s<strong>to</strong>p criteria are satisfied, the <strong>fit</strong>ting process<br />
s<strong>to</strong>ps.<br />
An important issue is the computation of α kl and β k . According <strong>to</strong> Equation 2-2 and<br />
Equation 2-6, we have <strong>to</strong> calculate the first derivatives of the model function f ( x,<br />
p1<br />
K pM<br />
)<br />
with respect <strong>to</strong> parameters. In general, one can do it numerically, which is the only possibility,<br />
if the model function (but not the derivatives) is provided by an external routine. In this case<br />
much care has <strong>to</strong> be taken, as the computational errors could be rather large, especially near the<br />
minimum point. Fortunately, since we are going <strong>to</strong> use the model functions given by explicit<br />
analytical expressions, we can always calculate the derivatives analytically.<br />
The s<strong>to</strong>p criteria are necessary <strong>to</strong> avoid an endless iteration cycle. The most natural<br />
reason <strong>to</strong> s<strong>to</strong>p is when the <strong>fit</strong>ting process converges, or, formally, when the absolute reduction<br />
2<br />
2<br />
of the χ during the last few (e.g., three) iterations does not exceed a certain threshold δχ . It<br />
also makes sense <strong>to</strong> ensure that the <strong>fit</strong>ting process does not take <strong>to</strong>o long by putting certain<br />
limits on the <strong>to</strong>tal number of iterations or (and) the <strong>to</strong>tal <strong>fit</strong>ting time. There could be many more<br />
criteria. For instance, the process must terminate, when an impatient user hits the “STOP”<br />
but<strong>to</strong>n.<br />
It is remarkable, that the LM algorithm, in spite of its simplicity, may easily handle<br />
models that contain a huge number of parameters (of the order of thousands!). The convergence<br />
speed, i.e., the number of iterations, needed <strong>to</strong> reach the minimum, is not significantly<br />
Guide <strong>to</strong> RefFIT Page 11<br />
cur<br />
Solve Equation 2-9<br />
Modify parameters<br />
p → p + δp<br />
k<br />
k<br />
Compute<br />
2 2<br />
χ = χ<br />
new<br />
k<br />
Recall parameters<br />
p → p − δp<br />
k<br />
k<br />
λ → 10λ<br />
k
influenced by the number of parameters. It rather depends on the adequacy of the model <strong>to</strong> the<br />
experimental data and the success of the initial approximation.<br />
2.1.2. Simultaneous <strong>fit</strong>ting of several datasets of different types<br />
So far we considered the <strong>fit</strong>ting of only one dataset by a single model. It is rather<br />
straightforward <strong>to</strong> extend the discussion <strong>to</strong> a case, when several datasets of different<br />
experimental types have <strong>to</strong> be <strong>fit</strong>ted simultaneously with several models.<br />
Let us consider Q datasets, while an ν -th dataset ( ν = 1KQ<br />
) contains N ν datapoints:<br />
ν ν ν<br />
{ x i , yi<br />
σ i } ( i = 1K<br />
Nν<br />
). Suppose that an ν -th dataset should be <strong>fit</strong>ted by its own model<br />
fν ( x,<br />
p1,<br />
K,<br />
pM<br />
) . Although in this notation all models depend formally on the same set of<br />
parameters, it does not imply that every model really depends on all parameters. In other<br />
words, some derivatives ∂ fν / ∂pk<br />
may be equal <strong>to</strong> zero by definition. It is important, however,<br />
that different models may depend on the same parameters.<br />
Our goal is <strong>to</strong> <strong>fit</strong> several datasets simultaneously. For each dataset a separate chi-square<br />
term can be written:<br />
χ<br />
Equation 2-11<br />
⎛ y − f<br />
⎝<br />
( x , p K p<br />
≡ ∑ ⎜<br />
=<br />
ν N ν<br />
ν<br />
2<br />
i ν i 1<br />
ν<br />
ν<br />
i 1 σ i<br />
M<br />
) ⎞<br />
⎟<br />
⎠<br />
We can compose the <strong>to</strong>tal chi-square <strong>to</strong> be minimized:<br />
2<br />
χ<br />
=<br />
Equation 2-12<br />
Q<br />
∑<br />
ν = 1<br />
w<br />
2<br />
ν χν<br />
2<br />
Here w ν are the ‘weights’ of individual chi-square terms that have <strong>to</strong> be adjusted, as discussed<br />
below. The definitions of β k (Equation 2-2) and α kl (Equation 2-6) should be modified<br />
accordingly:<br />
Q Nν<br />
ν<br />
ν<br />
yi<br />
− fν<br />
( xi<br />
, p1,<br />
K, pM<br />
) ∂fν<br />
ν<br />
β k = wν ∑<br />
( x , 1,<br />
,<br />
2<br />
i p K p<br />
ν<br />
( σ ) ∂p<br />
∑<br />
ν = 1 i= 1<br />
i<br />
k<br />
Q Nν<br />
1 ∂fν<br />
ν<br />
∂fν<br />
ν<br />
α kl = ∑ wν ∑ ( x , 1,<br />
, ) ( , 1,<br />
, )<br />
2<br />
i p K pM<br />
xi<br />
p K pM<br />
.<br />
ν<br />
ν = 1 i= 1 ( σ i ) ∂pk<br />
∂pl<br />
The remaining part of the LM algorithm goes exactly as in 2.1.1.<br />
The weight coefficients w ν deserve special remarks. Rigorously speaking, they should be<br />
equal <strong>to</strong> 1, provided that the spreads of all data points are statistically independent. However,<br />
due <strong>to</strong> the systematic error bars, this assumption is obviously not correct. For instance, the shift<br />
of the reflectivity coefficient, caused by the reference mirror imperfection, is not very different<br />
for two <strong>spectra</strong>lly close data points. The second problem is that the error bars ν<br />
σ i are not<br />
always well known. Therefore, it is often necessary <strong>to</strong> ‘tune’ the weight coefficients in order <strong>to</strong><br />
Guide <strong>to</strong> RefFIT Page 12<br />
M<br />
) ,
achieve a proper ‘balance’ between the contributions of different data sets <strong>to</strong> the <strong>to</strong>tal chisquare<br />
(Equation 2-12). But how this can be done? Frankly speaking, I see no other recipe but<br />
<strong>to</strong> try different values of w v , see the result, and listen <strong>to</strong> your own intuition when choosing the<br />
best one! Do you have a better suggestion?!!!<br />
2.1.3. Confidence limits<br />
When the <strong>fit</strong>ting is done, it is often necessary <strong>to</strong> estimate the ‘error bars’ of the obtained<br />
( 0)<br />
parameter values p k . From the statistical point of view, it is more correct <strong>to</strong> talk about the socalled<br />
‘confidence limits’. One can intuitively define the confidence limit of a parameter p k as<br />
the largest possible value δ pk<br />
, such as the shift pk → pk<br />
+ δpk<br />
) 0 (<br />
does not cause an<br />
‘unrealistically’ large increase of the chi-square. An essential addition <strong>to</strong> this definition is that,<br />
after the shifting of the value of p k , one should again minimize 2<br />
χ with respect <strong>to</strong> all<br />
remaining parameters.<br />
The importance of an extra minimization is clear from the following (a bit exaggerated)<br />
example. Let us consider the following model function f , which depends on the two<br />
parameters ( 1 p and 2 p ) and does not even depend on x : f ( p1<br />
, p2<br />
) = p1<br />
+ p2<br />
. Suppose, our<br />
dataset contains only one data point { y = 1,<br />
σ = 1}<br />
( x is not important here). The chi-square in<br />
2<br />
2<br />
( 0)<br />
the case is χ = ( 1−<br />
p1 − p2<br />
) . The <strong>fit</strong>ting procedure may converge, for instance, <strong>to</strong> p 1 = 0.<br />
6<br />
( 0)<br />
2<br />
and p 1 = 0.<br />
4 (in this case the <strong>fit</strong> is exact and χ = 0 ). What are the confidence limits of both<br />
parameters? Obviously, there are no limits at all, because for any given number a , the<br />
combination p1 = a,<br />
p2<br />
= 1−<br />
a also provides an exact <strong>fit</strong>! However, at any fixed value of p 2 ,<br />
2<br />
the shift of p 1 will cause an increase of the χ . If we now set that the largest ‘realistic’ value<br />
2<br />
of χ is 0.01 then formally the ‘confidence limit’ of p 1 should be 0.1. The same is valid for<br />
p are correlated.<br />
p 2 . One can say that parameters 1 p and 2<br />
The calculation of the confidence limits δpk is relatively simple. We can ignore the<br />
2<br />
2 ( 0)<br />
( 0)<br />
deviations of χ ( p1, K,<br />
pM<br />
) near the minimum point χ ( 0)<br />
( p1 , K,<br />
pM<br />
) from the quadratic<br />
shape, given by the Hessian matrix α kl .<br />
2 2<br />
( 0)<br />
( 0)<br />
χ − χ ( 0)<br />
= ∑α kl ( pk<br />
− pk<br />
)( pl<br />
− pl<br />
) .<br />
Equation 2-13<br />
k , l<br />
Let<br />
Then, after simple algebra, we can get:<br />
k<br />
2<br />
δχ be the ‘maximal acceptable’ difference<br />
2 −1<br />
δ p = ( δχ )( α ) ,<br />
Equation 2-14<br />
kk<br />
2 2<br />
χ − χ ( 0)<br />
that we will discuss later.<br />
Guide <strong>to</strong> RefFIT Page 13
−1<br />
where ( α ) kl is the inverse Hessian matrix also called the ‘covariance matrix’. Note, that all<br />
−1<br />
2 2 ( 0)<br />
( 0)<br />
the diagonal elements ( α ) kk are positive because χ ( 0)<br />
= χ ( p1 , K,<br />
pM<br />
) is a local minimum<br />
point and Equation 2-14 can always be applied.<br />
The reasonable choice of<br />
defined by the condition:<br />
2 ⎛ M δχ ⎞<br />
P ⎜ , ⎟ = p ,<br />
⎝ 2 2 ⎠<br />
2<br />
2<br />
δχ absolute value is quite an issue. Ideally, δχ should be<br />
Equation 2-15<br />
where M is the number of parameters, p is the desired confidence probability limit (typically,<br />
x<br />
∞<br />
p = 0.<br />
95 ) and ⎜<br />
⎛ −t<br />
a−1<br />
≡ ⎟<br />
⎞<br />
⎜<br />
⎛ −t<br />
a−1<br />
P(<br />
a,<br />
x)<br />
⎟<br />
⎞<br />
⎝∫<br />
e t dt /<br />
0 ⎠ ⎝∫<br />
e t dt is the incomplete gamma-function (the<br />
0 ⎠<br />
derivation can be found in Ref. [3]).<br />
However, the Equation 2-15 can be applied, if (i) the data points are statistically<br />
independent, (ii) all weight coefficients w ν are unities, and (iii) the model is absolutely<br />
adequate <strong>to</strong> the data. However, as was mentioned in the section 2.1.2, the existence of the<br />
systematic error bars invalidates the first two assumptions. One also needs much optimism <strong>to</strong><br />
2<br />
heavily rely on the assumption (iii). In this situation the choice of δχ becomes rather<br />
ambiguous and, therefore, human-dependent.<br />
Fortunately, from Equation 2-14 it follows that<br />
2<br />
δχ scales the confidence limits of all<br />
parameters proportionally. One can therefore reliably compare the error bars of different<br />
parameters, even though their absolute values might be ill-defined.<br />
2.2. Modeling of the dielectric functions<br />
The central assumption in the calculations RefFIT does is that all measurable <strong>optical</strong><br />
quantities (such as reflectivity, penetration depth etc.) can be expressed in terms of the complex<br />
frequency-dependent dielectric function ε ( ω)<br />
= ε1<br />
( ω)<br />
+ iε<br />
2 ( ω)<br />
of the material under study.<br />
Therefore, the most important issue is the modeling of the dielectric function itself.<br />
2.2.1. Physical properties of the dielectric functions<br />
It is well-known from the textbooks (e.g., [2]) that any realistic dielectric function ought<br />
<strong>to</strong> satisfy certain physical conditions.<br />
First of all, ε1 ( ω)<br />
= ε1<br />
( −ω)<br />
and ε 2 ( ω)<br />
= −ε<br />
2 ( −ω)<br />
, therefore it is sufficient <strong>to</strong> model the<br />
ε (ω)<br />
for ω ≥ 0 only.<br />
Secondly, ε 2 ( ω > 0)<br />
≥ 0 , which means that the intensity of light cannot increase in the<br />
direction of propagation.<br />
Guide <strong>to</strong> RefFIT Page 14
The third requirement is that at very high frequencies the <strong>optical</strong> properties of matter are<br />
the same as those of vacuum: ε ( ω → ∞)<br />
= 1 and ε ( ω → ∞)<br />
= 0 .<br />
1<br />
Finally, due <strong>to</strong> the causality principle, the real and imaginary parts are not independent,<br />
but coupled via the so-called Kramers-Kronig (KK) relation 3 :<br />
2<br />
ε1<br />
( ω)<br />
−1<br />
=<br />
π<br />
Equation 2-16<br />
∞<br />
∫<br />
0<br />
xε<br />
2 ( x)<br />
dx<br />
.<br />
2 2<br />
x − ω<br />
Since the integrated function has a pole at x = ω , the principal value of the integral should be<br />
taken.<br />
The Equation 2-16 is a particularly strong constraint. It implies that, the knowledge of the<br />
ε 2 ( ω)<br />
in the whole <strong>spectra</strong>l range is enough <strong>to</strong> res<strong>to</strong>re the ε 1( ω)<br />
without any extra<br />
assumptions. Thus only one of the two functions ε ( ) and ε ( ) is independent.<br />
The dielectric function ε (ω)<br />
of a physical system is often presented a sum of different<br />
terms (contributions) due <strong>to</strong> the <strong>optical</strong> response of independent subsystems:<br />
A<br />
B<br />
ε ( ω)<br />
= 1+<br />
ε ( ω)<br />
+ ε ( ω)<br />
+ ... .<br />
Obviously, in this case the KK relations must hold for individual contributions separately:<br />
A 2<br />
ε1<br />
( ω)<br />
=<br />
π<br />
Equation 2-17<br />
∞<br />
xε 2<br />
∫ 2<br />
0 x<br />
A<br />
∞<br />
( x)<br />
dx B 2<br />
, ε =<br />
2 1 ( ω)<br />
− ω<br />
π ∫<br />
0<br />
x B<br />
Guide <strong>to</strong> RefFIT Page 15<br />
2<br />
1 ω<br />
ε 2 ( x)<br />
dx<br />
…<br />
2 2<br />
x − ω<br />
Note that 1 is no longer present in this formula, like in Equation 2-16.<br />
What is the practical value of the KK relation? It is not obvious, how <strong>to</strong> use it, as<br />
experimental <strong>spectra</strong> are never measured in the whole <strong>spectra</strong>l range. In many cases, if the<br />
range is very limited, it makes no sense <strong>to</strong> impose the KK relation on the dielectric function <strong>to</strong><br />
be found. If the <strong>spectra</strong>l range is relatively large, then the KK condition becomes essential, but<br />
one should be rather careful while making assumptions about the behavior of the dielectric<br />
function outside the considered <strong>spectra</strong>l region. We shall discuss this issue later on.<br />
2.2.2. Why modeling?<br />
Why and when do we need <strong>to</strong> model the dielectric functions? One can speculate much on<br />
that, but I would distinguish the two main possibilities.<br />
Firstly, one can get some physically meaningful characteristics of the material under<br />
study (for example, the plasma frequency, the fundamental gap or the phonon line asymmetry)<br />
directly from the experimental <strong>spectra</strong>, assuming a specific physical model (metallic Drude<br />
conductivity, semiconduc<strong>to</strong>r gap, Fano lineshape etc.). In this case the obvious recipe is <strong>to</strong> <strong>fit</strong><br />
the data with a formula-defined function, which is derived from this model (section 2.2.3). The<br />
quality of the best match will suggest how good the model is.<br />
3 There exists another KK relation that we will not use, as it does not impose essentially new constraints<br />
2 ω
The second possibility is <strong>to</strong> extract the dielectric function ε (ω)<br />
itself from the measured<br />
<strong>spectra</strong> as careful as possible without any model assumptions (the model-dependent analysis of<br />
ε (ω)<br />
can be done afterwards). For example, we might want <strong>to</strong> obtain ε 1( ω)<br />
and ε 2 ( ω)<br />
from<br />
the measured ellipsometric quantities ψ (ω)<br />
and ∆ (ω)<br />
, which is rather trivial (in the isotropic<br />
case), or from reflectivity R (ω)<br />
alone, which is not trivial, as it heavily relies on the Kramers-<br />
Kronig relations. It is remarkable, that in this case the problem can be again formulated in<br />
terms of <strong>fit</strong>ting! Then, one has <strong>to</strong> find the best dielectric function that matches the available<br />
<strong>optical</strong> data. In other words, we have <strong>to</strong> minimize the chi-square (Equation 2-1 or Equation<br />
2-12) in the whole Hilbert space of physically sensible dielectric functions, which formally<br />
means that we have an infinite number of the <strong>fit</strong>ting parameters. As it is technically impossible<br />
<strong>to</strong> deal with an infinite number of parameters, one has <strong>to</strong> restrict somehow the set of considered<br />
dielectric functions <strong>to</strong> a finite-dimensional subspace 4 . One way <strong>to</strong> do it is <strong>to</strong> represent ε (ω)<br />
again by a formula (section 2.2.3). The particular meaning of the formula is not important,<br />
provided that it gives a physically allowed result (see section 2.2.1) and is ‘flexible’ enough <strong>to</strong><br />
<strong>fit</strong> all important features of the experimental <strong>spectra</strong>. However, the formula-given dielectric<br />
functions are usually <strong>to</strong>o ‘stiff’ for this purpose. In this case a better solution might be <strong>to</strong> use<br />
the so-called variational dielectric functions (section 2.2.4).<br />
2.2.3. Formula-defined dielectric functions<br />
There is a variety of formulas corresponding <strong>to</strong> different models of the dielectric<br />
functions. Perhaps, the most famous example is the Drude-Lorentz (DL) model, which we will<br />
refer <strong>to</strong> many times later on:<br />
2<br />
ω pi<br />
+ ∑ 2<br />
i ωoi<br />
− ω − iγ iω<br />
,<br />
ε ( ω)<br />
= ε ∞<br />
2<br />
Equation 2-18<br />
It describes the <strong>optical</strong> response of a set of harmonic (damped) oscilla<strong>to</strong>rs. Here ε ∞ is the socalled<br />
‘high-frequency dielectric constant’, which represents the contribution of all oscilla<strong>to</strong>rs<br />
at very high frequencies (compared <strong>to</strong> the frequency range under consideration). The<br />
parameters ω pi , ω 0i<br />
and γ i are the ‘plasma’ frequency, the transverse frequency<br />
(eigenfrequency) and the linewidth (scattering rate) respectively of the i -th Lorentz oscilla<strong>to</strong>r.<br />
For the Drude term, which describes <strong>to</strong> response of the unbound (free) charge carriers, the ω 0i<br />
is zero.<br />
We shall distinguish between the formulas that satisfy the KK relation and the ones that<br />
do not. Of course, the safest way is <strong>to</strong> always <strong>fit</strong> the data with the KK-compliant functions.<br />
However, non-KK functions are also often used. For instance, the formula for an asymmetric<br />
oscilla<strong>to</strong>r:<br />
ε ( ω)<br />
2 iπφ<br />
ω pe<br />
2<br />
ω − ω − iγω<br />
= 2<br />
o<br />
4 Moreover, it makes no sense <strong>to</strong> have more parameters than the <strong>to</strong>tal number of experimental points.<br />
Guide <strong>to</strong> RefFIT Page 16
Equation 2-19<br />
is useful <strong>to</strong> estimate the asymmetry of the lineshape, when the data are analyzed in the range<br />
close <strong>to</strong> ω 0 . However, this ‘asymmetric’ term may cause serious problems with the asymp<strong>to</strong>tic<br />
behavior at high frequencies and <strong>optical</strong> sum rules if applied <strong>to</strong> a broad range of frequencies.<br />
Notably, even the DL function (Equation 2-18) is, strictly speaking, not Kramers-Kronigcompatible,<br />
if ε ∞ ≠ 1.<br />
This ‘problem’ is commonly ignored, because ε ∞ ≠ 1 can be imitated by<br />
an oscilla<strong>to</strong>r sitting infinitely far away above the highest considered frequency.<br />
Every formula-given function can be differentiated analytically, which is crucial <strong>to</strong><br />
implement the Levenberg-Marquardt minimization (section 2.1.1).<br />
2.2.4. Variational (free-shape) dielectric functions (KK-constrained)<br />
The method of variational dielectric functions is relatively new [4], although some related<br />
analyses were known before. This section contains the detailed description of this technique.<br />
Let me outline a situation, where this type of functions naturally comes about. Imagine<br />
that we are given a normal-incidence reflectivity spectrum R (ω)<br />
, measured in the (wide<br />
enough) <strong>spectra</strong>l range [ ω min , ωmax<br />
] , and we have <strong>to</strong> extract the corresponding dielectric<br />
function ε (ω)<br />
.<br />
One solution that is known since fifties [6] is <strong>to</strong> apply a special Kramers-Kronig<br />
transformation for the logarithm of the complex reflectivity. This method is very popular since<br />
it does not require much numerical work. However, its applicability is limited <strong>to</strong> the case of the<br />
normal-incidence reflectivity from a bulk isotropic sample. It fails for instance, if the angle of<br />
incidence is large enough [7].<br />
A more universal way is <strong>to</strong> <strong>fit</strong> the reflectivity using some model function, which<br />
au<strong>to</strong>matically satisfies the KK relation. We also have <strong>to</strong> use a Fresnel relation between ε (ω)<br />
and R (ω)<br />
, which properly takes in<strong>to</strong> account particular experimental conditions (the angle of<br />
incidence, a possible substrate etc.). If we manage <strong>to</strong> match all essential features of the<br />
measured reflection coefficient (apart from the noise) then we expect the model dielectric<br />
function <strong>to</strong> closely resemble the true dielectric function of the system. As we cannot assume apriori<br />
any specific model, the only way is <strong>to</strong> take some trial function with a lot of parameters<br />
that is ‘flexible enough’ <strong>to</strong> effectively approximate the true dielectric function.<br />
One can take, for instance, the DL oscilla<strong>to</strong>r function (Equation 2-18) and put as many<br />
terms as it is necessary <strong>to</strong> obtain a nice <strong>fit</strong> <strong>to</strong> the data. All oscilla<strong>to</strong>r parameters ω pi , ω 0i<br />
and<br />
γ i in this case are usually adjustable. In fact, this approach is doable, even though in some<br />
‘unlucky’ cases the number of oscilla<strong>to</strong>rs has <strong>to</strong> be very large. The reason for the success is the<br />
completeness of Drude-Lorentz functions in a sense that any physical dielectric function can be<br />
approximated with an arbitrarily good accuracy by some set of Lorentzians (although this<br />
statement is intuitively clear, the rigorous proof might be complicated).<br />
However, this way of <strong>fit</strong>ting has serious disadvantages. First of all, there are no obvious<br />
criteria on how many oscilla<strong>to</strong>rs are really necessary. Secondly, as we add more and more<br />
oscilla<strong>to</strong>rs <strong>to</strong> the model function, it becomes less and less clear how <strong>to</strong> guess the initial values<br />
Guide <strong>to</strong> RefFIT Page 17
of parameters of every newcomer. Finally, if all parameters are allowed <strong>to</strong> change, it often<br />
happens that the <strong>fit</strong>ting process causes an uncontrollable divergence of some of them 5 . To avoid<br />
it, one has <strong>to</strong> deliberately fix some parameters. It makes the <strong>fit</strong>ting procedure rather tricky and<br />
ambiguous, preventing the routinely execution.<br />
Now we take the first step <strong>to</strong>wards the variational dielectric functions. In order <strong>to</strong><br />
improve the multi-oscilla<strong>to</strong>r <strong>fit</strong>ting strategy, we can put oscilla<strong>to</strong>rs at fixed frequencies<br />
ω 0 i = ωi<br />
, (i = 1,.., N ) and set their linewidths γ i <strong>to</strong> an also fixed value, which is of the order of<br />
the distance between adjacent frequency points (for instance γ ω ω ) / 2 ). The idea, is<br />
i = ( i+<br />
1 − i−1<br />
that the i -th oscilla<strong>to</strong>r is ‘locally responsible’ for the <strong>spectra</strong>l weight 6 near i<br />
ω (see Figure 2-2).<br />
In this way we ensure, that our model function is able <strong>to</strong> provide enough <strong>spectra</strong>l weight <strong>to</strong> any<br />
frequency region. We are left with only plasma frequencies ω pi (which determine the <strong>spectra</strong>l<br />
weights) allowed <strong>to</strong> change.<br />
Dielectric function ε<br />
1<br />
0<br />
ω i-1<br />
ω i<br />
ω i+1<br />
Frequency<br />
Re ε<br />
Im ε<br />
Figure 2-2 The real and imaginary parts of the Lorentz dielectric function ε (ω)<br />
Lor<br />
, with the transverse frequency<br />
ω =<br />
0 ωi<br />
and the linewidth = ( ωi+<br />
1 − ωi−1<br />
) / 2<br />
γ .<br />
7<br />
The frequency mesh should cover the <strong>spectra</strong>l range [ ωmin<br />
, ωmax<br />
] and should be dense<br />
enough <strong>to</strong> allow a very accurate <strong>fit</strong>ting of the reflectivity spectrum. Ultimately, we can put even<br />
one oscilla<strong>to</strong>r <strong>to</strong> every experimental point of the spectrum! In this case the number of<br />
adjustable parameters is the same as the number of experimental points, so that the <strong>fit</strong>ting can<br />
be in principle exact (of course, the data noise will be also <strong>fit</strong>ted). Although we can still use the<br />
standard minimization procedure, described in section 2.1, such a <strong>fit</strong>ting can be hardly referred<br />
<strong>to</strong> as ‘modeling’. I would rather call it ‘variational <strong>fit</strong>ting’ or ‘free-shape <strong>fit</strong>ting’ or something<br />
of the kind.<br />
To make this variational approach really workable, we have <strong>to</strong> overcome the two major<br />
obstacles.<br />
5<br />
Typically, it happens, when the transversal frequency goes beyond the experimental <strong>spectra</strong>l range.<br />
σ x ) dx ~ xε<br />
( x)<br />
dx<br />
6<br />
By ‘<strong>spectra</strong>l weight’ we mean, as usual, the integrated <strong>optical</strong> conductivity ∫ 1(<br />
∫ 2<br />
7<br />
then ω 1 = ωmin<br />
and ω N<br />
= ωmax<br />
Guide <strong>to</strong> RefFIT Page 18<br />
i
The first problem is that the Lorentzian lineshape<br />
ε<br />
i,<br />
Lor<br />
2<br />
2<br />
ω piγω<br />
( ω)<br />
=<br />
2 2 2 2<br />
( ω − ω ) + γ ω<br />
2<br />
i<br />
is not very suitable <strong>to</strong> represent solely the ‘local’ <strong>spectra</strong>l weight close <strong>to</strong> ω i because of the<br />
slowly decaying low- and high-frequency ‘tails’ (Figure 2-2). We need a more ‘localized’<br />
function. Ideally, it should have no tails at all, i.e. <strong>to</strong> be non-zero only inside, let say, the small<br />
region ω i−<br />
, ωi<br />
] , adjacent <strong>to</strong> ω i .<br />
[ 1 + 1<br />
A good candidate is a ‘triangular’ shape of ε ( ) (Figure 2-3):<br />
Guide <strong>to</strong> RefFIT Page 19<br />
2 ω<br />
⎧(<br />
ω − ωi−1<br />
) /( ωi<br />
− ωi−1<br />
) , ωi−1<br />
< ω < ωi<br />
i,<br />
∧ ⎪<br />
ε 2 ( ω)<br />
= ⎨(<br />
ωi+<br />
1 − ω)<br />
/( ωi+<br />
1 − ωi<br />
) , ωi<br />
< ω < ωi+<br />
1 .<br />
⎪<br />
⎩ 0 , otherwise<br />
Equation 2-20<br />
The corresponding ε 1( ω)<br />
can be analytically obtained by applying the KK transformation<br />
(Equation 2-17):<br />
ε<br />
i,<br />
∧<br />
1<br />
Equation 2-21<br />
1 ⎡ g(<br />
ω,<br />
ωi−1<br />
) ( ωi+<br />
1 − ωi−1<br />
) g(<br />
ω,<br />
ωi<br />
) g(<br />
ω,<br />
ωi+<br />
1)<br />
⎤<br />
( ω)<br />
= ⎢ −<br />
+ ⎥ ,<br />
π ⎣ ωi<br />
− ωi−1<br />
( ωi<br />
− ωi−1<br />
)( ωi+<br />
1 − ωi<br />
) ωi+<br />
1 − ωi<br />
⎦<br />
where g( x,<br />
y)<br />
≡ ( x + y)<br />
ln x + y + ( x − y)<br />
ln x − y .<br />
Dielectric function ε<br />
1<br />
0<br />
ω i-1<br />
ω i<br />
Frequency<br />
ω i+1<br />
Re ε<br />
Im ε<br />
i,<br />
∧<br />
Figure 2-3. The real and imaginary parts of the ‘triangular’ dielectric function ε ( ω)<br />
, described in the text.<br />
Now we can construct the desired variational function as a linear superposition of<br />
triangular functions localized at all frequencies ω<br />
i
ε<br />
Equation 2-22<br />
N<br />
i,<br />
∧<br />
var ( ω)<br />
= ∑ Aiε<br />
( ω)<br />
i=<br />
1<br />
and consider coefficients A i as free parameters. To ensure that ε 2 ( ω)<br />
≥ 0 , we require that all<br />
A ≥ 0 . It is convenient <strong>to</strong> set them <strong>to</strong> zero at the boundaries: A A = 0 , ensuring that<br />
i<br />
ε 2 ( ω)<br />
vanishes at 1<br />
ω and N<br />
ω 8 .<br />
1 = N<br />
As is schematically shown on Figure 2-4, the imaginary part of ε var ( ω)<br />
is a piecewise<br />
curve going through N points { ω i , Ai<br />
}(i = 1,..,N). One can see that Imε var ( ω)<br />
in between the<br />
reference frequency points ω i is simply given by a linear interpolation. The Reε var ( ω)<br />
is its<br />
exact KK transform.<br />
The free parameters of ε var ( ω)<br />
are the values of ε 2 at every frequency point ω i . There<br />
are al<strong>to</strong>gether N − 2 parameters. Obviously, this construction is extremely flexible and <strong>to</strong>tally<br />
model-independent, just what we aimed <strong>to</strong> obtain!<br />
Dielectric function ε<br />
0<br />
ω 1<br />
ω i-1<br />
ω i<br />
ω i+1<br />
Frequency<br />
ω N<br />
Im ε var<br />
Re ε var<br />
ε i-1,Λ<br />
Figure 2-4. A KK-constrained variational dielectric function. The Imε var ( ω)<br />
is composed of many triangular<br />
functions Im ( )<br />
, ε ω<br />
∧ i<br />
and the Reε var ( ω)<br />
is the exact KK-transform of Imε var ( ω)<br />
.<br />
The second problem is that the so-constructed variational dielectric function (Equation<br />
2-22) <strong>to</strong>tally ignores all <strong>spectra</strong>l weight beyond the frequency range [ ω min , ωmax<br />
] . However,<br />
according <strong>to</strong> the KK relation (Equation 2-17), the non-zero ε 2 ( ω)<br />
outside this region<br />
influences ε 1( ω)<br />
inside it, and is, therefore, essential <strong>to</strong> calculate reflectivity R (ω)<br />
, which<br />
depends on both ε ( ) and ε ( ) .<br />
1 ω<br />
2 ω<br />
8<br />
a non-zero value of ε 2 at the boundary would result in a discontinuity of ε 2 and therefore in an unwanted<br />
divergence of ε<br />
1<br />
ε i,Λ<br />
ε i+1,Λ<br />
Guide <strong>to</strong> RefFIT Page 20
The problem can be circumvented by doing the <strong>fit</strong>ting in two steps. Initially, the <strong>spectra</strong><br />
( 0)<br />
are <strong>fit</strong>ted in a conventional way by some formula-defined dielectric function ε ( ω)<br />
= ε mod ( ω)<br />
.<br />
If the match is reasonably good, then we can assume that ε mod ( ω)<br />
has correct frequency<br />
dependence outside the considered <strong>spectra</strong>l range, even though some fine details of the<br />
experimental curve are not <strong>fit</strong>ted very well. Then we can fix all parameters of ε mod ( ω)<br />
and add<br />
a variational function <strong>to</strong> it:<br />
( 1)<br />
ε ω)<br />
= ε ( ω)<br />
+ ε ( ω)<br />
.<br />
( mod<br />
var<br />
Now the ε var ( ω)<br />
acts as a small correction <strong>to</strong> the initial model ε mod ( ω)<br />
. When we do a<br />
( 1)<br />
variational <strong>fit</strong>ting of the reflectivity spectrum with ε ( ω)<br />
, the ‘KK influence’ of the low- and<br />
high-frequency <strong>spectra</strong>l weights on ε 1( ω)<br />
inside [ ω min , ωmax<br />
] is already accounted for by<br />
ε ( ) .<br />
mod ω<br />
Because ε var ( ω)<br />
is now added <strong>to</strong> ε mod ( ω)<br />
, which is the dominant contribution <strong>to</strong> the <strong>to</strong>tal<br />
dielectric function, the parameters A i are not necessarily positive (which was initially required<br />
by the condition ε ( ω)<br />
≥ 0 ), but can be negative as well.<br />
2<br />
From the Equation 2-22 we can get a simple analytical formula for the first derivatives of<br />
the dielectric function ε var ( ω)<br />
with respect <strong>to</strong> the parameters A i , which are required by the<br />
Levenberg-Marquardt procedure (section 2.1.1):<br />
∂ε i ∧<br />
var<br />
( ω)<br />
,<br />
= ε<br />
∂A<br />
i<br />
( ω)<br />
.<br />
At the end we minimize the chi-square with respect <strong>to</strong> all N − 2 parameters, thus<br />
obtaining ‘the best’ KK-related dielectric function, which <strong>fit</strong>s the reflectivity spectrum.<br />
In the above example we discussed the <strong>fit</strong>ting of a single reflectivity spectrum. As was<br />
mentioned before, in the particular case of a normal-incidence reflectivity spectrum of an<br />
isotropic sample, (almost) the same result could be obtained by the ‘conventional’ KK<br />
technique. However, an important advantage of the new method is that it can be applied <strong>to</strong><br />
virtually any type of <strong>optical</strong> <strong>spectra</strong>, or a combination of them!<br />
The typical number of parameters that are adjusted in the <strong>fit</strong>ting by variational functions<br />
is very large – up <strong>to</strong> the number of experimental points, which might amount <strong>to</strong> few thousands.<br />
Although such an enormous number of parameters seem <strong>to</strong> make the <strong>fit</strong>ting procedure<br />
prohibitively slow, we found that it nevertheless converges within acceptable time limits. This<br />
is yet another reason <strong>to</strong> admire, how good the LM method is!<br />
In conclusion, it is worth mentioned that the described method is being successfully<br />
utilized in our group. However, there is a set of not yet well-addressed issues, for instance, a<br />
sensitivity of the output dielectric function <strong>to</strong> the noise and systematic error bars in the input<br />
data, or the optimal number and distribution of the frequencies ω i forming the mesh. Until we<br />
know more about the possible caveats, one should be especially careful when doing this kind of<br />
analysis and interpreting the output data.<br />
Guide <strong>to</strong> RefFIT Page 21
2.2.5. ‘Not-KK-constrained’ variational dielectric functions<br />
Although the title of this section looks ‘frightening’, the model function developed here is<br />
in fact much easier <strong>to</strong> understand and deal with then the one of the previous section.<br />
The variational functions that we <strong>to</strong>ld so far about were always ‘forced’ <strong>to</strong> satisfy the<br />
Kramers-Kronig relation. However, one can also consider a not KK-constrained variational<br />
function, where both ε 1( ω)<br />
and ε 2 ( ω)<br />
are ‘flexible’ and independent (Figure 2-5). Now it is<br />
not necessary <strong>to</strong> set ε 1( ω)<br />
and ε 2 ( ω)<br />
<strong>to</strong> zero at the boundaries ω 1 and ω 2 . If we consider a<br />
mesh of frequencies ω i (i = 1, .. N ), as in the previous section, then the dielectric function of<br />
this kind is parameterized by the 2 N values ε ( ω ) and ε ( ω ) .<br />
Dielectric function ε<br />
0<br />
ω 1<br />
ω i-1<br />
ω i<br />
ω i+1<br />
Frequency<br />
ω N<br />
1 i<br />
Im ε var<br />
Re ε var<br />
Figure 2-5 A non-KK-constrained variational dielectric function, which is composed of many triangular functions.<br />
The real and imaginary parts are completely independent.<br />
Of course, now there is no guarantee, that the resulting ε 1( ω)<br />
and ε 2 ( ω)<br />
will be KKrelated.<br />
As a result, one can get sometimes a <strong>to</strong>tally unphysical result (for instance, when there<br />
is not enough data or the systematic error bars are large). On the other hand, such ‘KK-relaxed’<br />
function is much easier <strong>to</strong> deal with, than a KK-constrained one, because ε 1( ω)<br />
does not<br />
depend non-locally on the values of ε ( ) in the entire range anymore.<br />
2 ω<br />
Although it is generally important <strong>to</strong> verify that the resulting function satisfies the KK<br />
relations, it is not always necessary and even plausible. For instance, in some <strong>optical</strong> techniques<br />
two or more values are measured independently at every frequency. The well known example<br />
is the ellipsometry, where two parameters (ψ and ∆ ) are obtained. Another example is the<br />
method, where the reflectivity R and transmission T are measured on the same sample. In<br />
both techniques the ε 1,<br />
ε 2 are derived from the measured quantities at every frequency<br />
independently, without the usage of the KK relations. If the <strong>spectra</strong>l range, where the<br />
measurements are done, is <strong>to</strong>o small, it is even impossible <strong>to</strong> check for the KK relations 9 .<br />
9 When the ellipsometry data are taken in a broad range, it does make sense <strong>to</strong> <strong>fit</strong> it with a KK-constrained<br />
function, because it may reveal serious systematic measurement errors, if any.<br />
Guide <strong>to</strong> RefFIT Page 22<br />
2 i
In these cases the <strong>fit</strong>ting of the data with a KK-relaxed variational dielectric function<br />
obviously does the right job. Even though the <strong>fit</strong>ting now formally involves 2 N parameters, it<br />
is in fact equivalent <strong>to</strong> the ‘point-by-point’ series of N independent <strong>fit</strong>ting problems which<br />
involve 2 parameters ( ε ( ω ) and ε ( ω ) ) each.<br />
1 i<br />
2 i<br />
2.3. Differential modeling<br />
Suppose, we measure some <strong>optical</strong> <strong>spectra</strong> S (ω)<br />
(for example, reflection, transmission,<br />
ellipsometry etc. or their combinations), from which we can obtain the dielectric function<br />
ε ( ω)<br />
= ε1<br />
( ω)<br />
+ iε<br />
2 ( ω)<br />
by a modeling, described in section 2.2. If the dielectric function<br />
depends on some externally controlled parameter P (most typically, temperature, but might be<br />
also pressure, magnetic field etc.), then it is often necessary <strong>to</strong> measure the change of ε due <strong>to</strong><br />
P :<br />
the change of P , let say, from 1 P <strong>to</strong> 2<br />
∆ ε ω)<br />
≡ ε ( ω,<br />
P ) − ε ( ω,<br />
P ) ,<br />
( 1<br />
2<br />
or, equivalently (if the changes are small), <strong>to</strong> obtain the derivative ∂ ε / ∂P<br />
. Sometimes this<br />
technique is called ‘modulation spectroscopy’ because the <strong>optical</strong> properties are ‘modulated’ by<br />
an external parameter.<br />
In principle, we can obtain the model dielectric functions ε mod ( ω,<br />
P1<br />
) and ε mod ( ω,<br />
P2<br />
) by<br />
the <strong>fit</strong>ting of , ) P S ω and ) , P S ω separately and assume that<br />
( 1<br />
( 2<br />
∆ ε ω)<br />
≈ ∆ε<br />
( ω)<br />
≡ ε ( ω,<br />
P ) − ε ( ω,<br />
P ) .<br />
( mod<br />
mod 1 mod 2<br />
However, this approach completely ignores, that the error bars of the differential <strong>spectra</strong><br />
∆ S ω) = S(<br />
ω,<br />
P ) − S(<br />
ω,<br />
P )<br />
( 1<br />
2<br />
have very little <strong>to</strong> do with the ones of the genuine <strong>spectra</strong> S (ω)<br />
. In fact, they are usually much<br />
smaller, because most systematical errors are cancelled out!. As a result, the ∆ modε<br />
( ω)<br />
may<br />
look rather different from ∆ ε (ω)<br />
.<br />
If the ∆ S and ∆ ε are small, then it might be better <strong>to</strong> <strong>fit</strong> the ∆ S(ω<br />
) directly by using a<br />
so-called differential model for ∆ ε (ω)<br />
. The procedure can be done in two steps. Initially, the<br />
base model ε base (ω)<br />
can be deduced by the usual <strong>fit</strong>ting of ( , 1)<br />
P S ω . It can be either formuladefined<br />
model (section 2.2.3), or a variational model (sections 2.2.4, 2.2.5). Apart from the<br />
values of ε 1( ω)<br />
and ε 2 ( ω)<br />
, the base model also provides the derivatives (sensitivities) of the<br />
measured spectrum with respect <strong>to</strong> the ε 1 and ε 2 :<br />
∂ ( ω)<br />
α1(<br />
ω)<br />
≡<br />
∂ε<br />
( ω)<br />
S<br />
∂ ( ω)<br />
, α 2 ( ω)<br />
≡<br />
∂ε<br />
( ω)<br />
S<br />
1<br />
2<br />
Using these derivatives, the differential <strong>spectra</strong> can be calculated in the first order of a<br />
Taylor expansion:<br />
Guide <strong>to</strong> RefFIT Page 23
∆S ω) ≈ α ( ω)<br />
∆ε<br />
( ω)<br />
+ α ( ω)<br />
∆ε<br />
( ω)<br />
.<br />
Equation 2-23<br />
( 1 1<br />
2 2<br />
Then one can associate an extra (differential) model ε diff (ω)<br />
with ∆ ε and adjust its parameters<br />
in order <strong>to</strong> <strong>fit</strong> ∆ S(ω<br />
) , using Equation 2-23. The error bars of ∆ S(ω<br />
) have <strong>to</strong> be estimated<br />
separately. In the <strong>fit</strong>ting with the differential model, the role of the base model is <strong>to</strong> provide<br />
only the (fixed) derivatives α ( ) and α ( ) .<br />
1 ω<br />
2 ω<br />
Formally, ε diff (ω)<br />
has <strong>to</strong> be treated as a usual dielectric function, because the physical<br />
requirements <strong>to</strong> it are almost the same as the usual requirements <strong>to</strong> the dielectric functions (see<br />
2.2.1). For instance, it is important that ε diff (ω)<br />
satisfies the Kramers-Kronig relation. The<br />
only obvious difference is that ∆ ε 2 can be negative (unlike ε 2 ), and both ∆ ε1<br />
and ∆ ε 2 must<br />
vanish at very high frequencies.<br />
Guide <strong>to</strong> RefFIT Page 24
3. Tu<strong>to</strong>rial<br />
This chapter shows how <strong>to</strong> solve typical problems using RefFIT. Each section is devoted<br />
<strong>to</strong> a particular task. I suggest you <strong>to</strong> go through the sections sequentially, since the last parts do<br />
not repeat the detailed explanations, given in the beginning. It is especially important <strong>to</strong> read<br />
the first section (3.1), which deals with the most basic RefFIT objects.<br />
Of course, before the going through this tu<strong>to</strong>rial, you should install RefFIT on your<br />
computer. This simple procedure is explained in section 4.2.<br />
3.1. Drude-Lorentz <strong>fit</strong>ting of a reflectivity spectrum<br />
As I already mentioned, RefFIT was created as a reflectivity <strong>fit</strong>ting routine with the<br />
Drude-Lorentz dielectric function (Equation 2-18). The normal-incidence reflectivity R (ω)<br />
is<br />
expressed via the dielectric function ε (ω)<br />
according <strong>to</strong> Fresnel formula:<br />
2<br />
1−<br />
ε<br />
R = .<br />
1+<br />
ε<br />
It is one the most common data analysis that solid-state infrared spectroscopists do. So why<br />
don’t we try it first?<br />
In order <strong>to</strong> do it in RefFIT, one should first open a model window by choosing “Model”<br />
from the “Window” menu (Figure 3-1). It contains a particular DL model that can be used later<br />
on for plotting graphs, <strong>fit</strong>ting data and so on. In this window we can add or delete the Lorenzian<br />
terms and manually edit parameters. The “Einf” field stands for ε ∞ ; “Wo”, “Wp” and “G”<br />
designate the transverse frequency ω 0i<br />
, the plasma frequency ω pi and the scattering rate γ i<br />
respectively, measured in inverse centimeters 10 (cm -1 ). By the way, 1 eV is about 8000 cm -1 .<br />
Let us keep for a while the initial values (Figure 3-1).<br />
10<br />
Inverse centimeters are apparently invented by the infrared spectroscopists <strong>to</strong> make the life of normal people<br />
more difficult ☺.<br />
Guide <strong>to</strong> RefFIT Page 25
Figure 3-1 A newly created model window with default parameters.<br />
Next we create a new graph, by choosing “Graph” from the “Window” menu (Figure<br />
3-2). In a graph you can plot curves, generated by the models and datasets.<br />
Figure 3-2 An empty graph window.<br />
If you want <strong>to</strong> set up the graph contents, just double-click on the white area. You will get<br />
a window, as shown at Figure 3-3. Choose the first item “(Model [R] “Model1”)” from the list<br />
“Available curves” and transfer it <strong>to</strong> the list “Graph curves” by clicking the but<strong>to</strong>n. The<br />
curve will appear on the graph.<br />
Guide <strong>to</strong> RefFIT Page 26
Figure 3-3 Graph contents window is used <strong>to</strong> set up the graph curves.<br />
Now we would like <strong>to</strong> edit the model parameters. If you do not like, that the plasma<br />
frequency of the Lorenzian in the model is so small (100 cm -1 ), you can change it <strong>to</strong>, let say,<br />
1000. For that you can either double-click on the corresponding field in the “Model1” window,<br />
or set the marker <strong>to</strong> this field and start typing a new value. The graph will be immediately<br />
redrawn after you finish editing by pressing “Enter” or in any other way. You can do the same<br />
with other parameters, or add extra Lorenzian terms. Any time you change something the<br />
graphs will react accordingly.<br />
You might have already noticed an additional window, called “Parameter control”<br />
(Figure 3-6) that appeared simultaneously with the “Model1” window. It is intended <strong>to</strong> change<br />
the characteristics of the currently selected parameter, such as its value as well as the minimal<br />
and maximal limits etc. On the left side you can see a trackbar, which works like a microphone<br />
volume control. Just drag it up and down in order <strong>to</strong> change the parameter value. The graph<br />
starts <strong>to</strong> show a movie, which you direct yourself!<br />
Figure 3-4 Parameter control window allows one <strong>to</strong> change the properties of a currently select parameter.<br />
After finishing with one parameter click <strong>to</strong> another one and continue the procedure. You<br />
might even not need a keyboard <strong>to</strong> get the desired spectrum shape.<br />
If you need <strong>to</strong> change the graph properties, such as axes scales, titles etc, you can doubleclick<br />
on the gray area in the “Graph1” window and enter the corresponding properties.<br />
Guide <strong>to</strong> RefFIT Page 27
Figure 3-5 In the “Graph properties” window one can modify the axis scales and titles.<br />
The playing around with parameters in an abstract model may start <strong>to</strong> get boring after a<br />
minute or so. To be more close <strong>to</strong> the real life let us load an experimental reflectivity curve. No<br />
doubt, you have your own beautiful <strong>spectra</strong>, but I would propose <strong>to</strong> take my own data file as a<br />
start. OK, we should open the dataset manager by clicking at “Dataset manager’ item of the<br />
“Window” menu. After that we get a window, shown at Figure 3-6. It has 10 slots for datasets.<br />
Figure 3-6 Dataset manager: no datasets are loaded yet.<br />
The rest is straightforward. Click the but<strong>to</strong>n in the first slot that will invoke the<br />
“Load Dataset” window (Figure 3-7).<br />
Guide <strong>to</strong> RefFIT Page 28
Figure 3-7<br />
Click the but<strong>to</strong>n and in the “Browse” window pick up the master file ‘R1.DAT’<br />
from the direc<strong>to</strong>ry “TUTORIAL\PART1”. Click the but<strong>to</strong>n. The dataset will be loaded<br />
now <strong>to</strong> the first slot (Figure 3-8). Note that the program assumed that this file contained<br />
reflectivity by checking the first filename character – “R”. Sometimes the data type is<br />
determined incorrectly. If this happens, then you must choose the right quantity in the<br />
“Quantity” field.<br />
Figure 3-8 The dataset manager with a reflectivity dataset loaded in<strong>to</strong> the first slot.<br />
You may close the ‘Dataset manager’ window in order <strong>to</strong> save some space on the screen.<br />
Don’t worry; it will not cause the unloading of our dataset.<br />
Guide <strong>to</strong> RefFIT Page 29
Now we would like <strong>to</strong> show this curve on the same graph. Let’s go back <strong>to</strong> the “Graph1”<br />
window and double-click anywhere in the white space. You can notice, that an extra item<br />
“DATA [R] “R1.DAT”” has appeared in the “Available curves” list of the “Graph contents”<br />
window (Figure 3-9). Very nice, this is our dataset. Move it <strong>to</strong> the “Graph curves” list and click<br />
the but<strong>to</strong>n. You may not like the appearance of the experimental curve. If so, you have<br />
<strong>to</strong> pop up “Graph contents” again, select “DATA [R] “R1.DAT”” in the “Graph curves” list<br />
and set the curve parameters according <strong>to</strong> your taste. Let us set the parameters as shown in<br />
Figure 3-9.<br />
Figure 3-9 The “graph contents” window with the data and model curves selected for plotting.<br />
Next I would suggest you <strong>to</strong> play with the model parameters manually in order <strong>to</strong> make<br />
the model curve as close as possible <strong>to</strong> the experimental one. To be specific, keep only two<br />
Lorenzians in the model. I’ll see you in five minutes…<br />
…OK, I am back. I hope, your “Graph1” looks similar <strong>to</strong> Figure 3-10.<br />
Figure 3-10 The match between the experimental and model reflectivity curves (after a manual parameter<br />
adjustment).<br />
Guide <strong>to</strong> RefFIT Page 30
If you are still far from this <strong>fit</strong>ting match, you can type the parameters that I obtained<br />
(Figure 3-11). You must have already figured out that these two Lorenzian terms correspond <strong>to</strong><br />
the two strongest <strong>optical</strong> phonon modes.<br />
Figure 3-11 The model with the two manually adjusted Lorentzians.<br />
So, we did a first step, and it is time <strong>to</strong> save the model. The way <strong>to</strong> do it is <strong>to</strong> activate our<br />
model window and press the F2 on the keyboard (do not ask me, why!). You will have the<br />
possibility <strong>to</strong> choose the path and the filename. I would suggest calling it “MODEL1.RFM” 11 ,<br />
but it is up <strong>to</strong> you. If you now do something wrong or the program crashes, you can load this<br />
saved model by pressing the F3 but<strong>to</strong>n in the active model window.<br />
Of course, we would expect from RefFIT <strong>to</strong> do an au<strong>to</strong>mated <strong>fit</strong>ting. This is our ultimate<br />
goal, after all. Let us show the ‘Fit’ window by clicking on ‘Fit’ in the ‘Window’ menu (Figure<br />
3-12).<br />
Figure 3-12 The “Fit” window. The <strong>fit</strong>ting task is not specified yet.<br />
11 “RFM” is a standard extension for the RefFIT model files.<br />
Guide <strong>to</strong> RefFIT Page 31
It is tempting <strong>to</strong> press immediately the but<strong>to</strong>n, but this wouldn’t work until we tell<br />
the program that we want <strong>to</strong> <strong>fit</strong> the “R1.DAT” dataset <strong>to</strong> the model “Model1”. The way <strong>to</strong> do it<br />
is <strong>to</strong> add the corresponding term <strong>to</strong> the chi-square (Equation 2-12). Click the but<strong>to</strong>n.The<br />
window “Add ChiSq term” will show up (Figure 3-13). In the list “Available ChiSq terms”<br />
there is only one possibility: “[R] “R1.DAT”-“Model1”” (there would be much more if more<br />
models and datasets were available). Select this item and click .<br />
Figure 3-13 Adding chi-square terms.<br />
Now the <strong>fit</strong>ting problem is well specified (Figure 3-14). The number of points in the<br />
spectrum is 4792 and the number of <strong>fit</strong>ted parameters is 7. You can also see how big the chisquare<br />
is.<br />
Figure 3-14 The “Fit” window after the adding of a chi-square term.<br />
Now we can press the but<strong>to</strong>n. You might notice that the match considerably<br />
improved (Figure 3-15) and the chi-square has decreased more than 10 times. It is a good idea<br />
save the model again, perhaps with a different name, e.g., “MODEL2.RFM”.<br />
Guide <strong>to</strong> RefFIT Page 32
Figure 3-15 The model and experimental reflectivity curves after the au<strong>to</strong>mated <strong>fit</strong>ting. The model contains only<br />
two oscilla<strong>to</strong>rs.<br />
Honestly, I am still not quite happy with the <strong>fit</strong>ting quality. It looks like that our sample<br />
has a small metallic conductivity, because reflectivity is bending upwards at very low<br />
frequencies. Let us put an extra Drude peak, corresponding <strong>to</strong> the response of charge carriers. It<br />
is a special case of Lorenzian with zero transverse frequency ω 0 . What we should do is <strong>to</strong><br />
simply add an extra Lorenzian <strong>to</strong> the model (by clicking the but<strong>to</strong>n) and set ω 0<br />
explicitly <strong>to</strong> zero. You may try <strong>to</strong> adjust ω p and γ in order <strong>to</strong> get a better match. If you find it<br />
difficult, I suggest setting both of them <strong>to</strong> 500 cm -1 .<br />
Now it makes sense <strong>to</strong> start the au<strong>to</strong>mated <strong>fit</strong>ting again. But wait! We want ω 0 of the<br />
Drude term <strong>to</strong> be always zero, while at the moment it is an adjustable parameter. There are<br />
several ways <strong>to</strong> tell RefFIT that we do not want a parameter <strong>to</strong> be varied. Perhaps, the fastest is<br />
<strong>to</strong> click on it with the right mouse but<strong>to</strong>n. Another way is <strong>to</strong> move the marker (light-green) <strong>to</strong> a<br />
specific parameter and press the SPACEBAR. The third option is <strong>to</strong> uncheck “Active in <strong>fit</strong>” in<br />
the Parameter window (Figure 3-4). The fixed parameter always looks red.<br />
OK, we can start <strong>fit</strong>ting. Wow, we’ve got an improvement (Figure 3-16)! The model now<br />
is shown at Figure 3-17. If you prefer <strong>to</strong> have oscilla<strong>to</strong>rs <strong>to</strong> be sorted by their transverse<br />
frequency ( ω 0 ), then click on the column header “Wo”. It is time <strong>to</strong> save the model again.<br />
Guide <strong>to</strong> RefFIT Page 33
Figure 3-16 The best model and data match for the model with one Lorentz terms and one Drude term.<br />
Figure 3-17 The model with one Lorentz terms and one Drude term, giving the best match <strong>to</strong> the data.<br />
Having obtained such a <strong>fit</strong>, you might want <strong>to</strong> see the corresponding dielectric function.<br />
Let us open a new graph window (by choosing ‘Graph’ from the ‘Window’ menu). Open the<br />
“Graph properties” window by double-clicking on the gray area. Change the Y-axis range <strong>to</strong> [-<br />
20;+20] and Y-axis title <strong>to</strong> “E1,E2” (Figure 3-18).<br />
Guide <strong>to</strong> RefFIT Page 34
Figure 3-18 The “Graph properties” window.<br />
Then open the “Graph contents” window by double-clicking on the white area (Figure<br />
3-3) and move items “MODEL [E1] “Model1”” and “MODEL [E2] “Model1”” <strong>to</strong> the list<br />
“Graph curves”. Now we can see the real and imaginary parts of the dielectric function (ε1 and<br />
ε2) on the same graph (Figure 3-19). Of course, in this way you can plot also other curves, like<br />
conductivity, penetration depth, loss function etc.<br />
Figure 3-19 The real and imaginary part of the dielectric function, plotted on the same graph.<br />
In order <strong>to</strong> have some outcome you may want export some curves, calculated by a model.<br />
To do this you should activate a graph window and press the SPACEBAR. You can then<br />
specify the file name in the “Export Graph <strong>to</strong> ASCII” window. All the model curves on the<br />
graph will be s<strong>to</strong>red as separate columns in this file. At this moment it is not yet possible <strong>to</strong><br />
specify, which set of frequencies will be used <strong>to</strong> generate the model curves. The computer will<br />
take the frequency range exactly the same as on the horizontal scale of the graph. The<br />
resolution will correspond <strong>to</strong> the resolution of your screen. Please, do not complain. It used <strong>to</strong><br />
be a temporary solution, but I did not make a better one. However, you can export data with an<br />
adjustable set of frequencies using a macro (see section 4.11.6).<br />
Guide <strong>to</strong> RefFIT Page 35
Congratulations! You have <strong>fit</strong>ted a real experimental curve! You may try <strong>to</strong> improve the<br />
match by <strong>fit</strong>ting, for example, the sharp phonon dip at around 350 cm -1 or other structures.<br />
By the way, this was the reflectivity spectrum of a high-temperature superconduc<strong>to</strong>r<br />
La1.85Sr0.15CuO4 at 100 K for electric field polarization perpendicular <strong>to</strong> the CuO2-planes (Ref.<br />
[8]). At this temperature it was not yet superconducting. If you want <strong>to</strong> <strong>fit</strong> the reflectivity of the<br />
sample in the superconducting state, I prepared another file for you (“R2.DAT”). Hint: you will<br />
need <strong>to</strong> introduce an extra Drude term with γ = 0 , which corresponds <strong>to</strong> the contribution of<br />
superconducting electrons.<br />
3.2. Simultaneous <strong>fit</strong>ting of several data types<br />
This time we consider an example, where several <strong>spectra</strong> of different types are <strong>fit</strong>ted<br />
simultaneously in order <strong>to</strong> improve the accuracy of the resulting dielectric function 12 . The<br />
measurements were done on a single-crystalline sample of compound CeIrIn5 at low<br />
temperature T = 35 K (see Ref. [9]). This material is a rather good metal, which results in a<br />
very high reflectivity at low frequencies.<br />
The reflectivity R at nearly-normal incidence was measured in the far- and mid-infrared<br />
<strong>spectra</strong>l range 25 – 5500 cm -1 (data file “R.DAT”). The ellipsometric measurements provided<br />
the <strong>spectra</strong> of ε 1 and ε 2 from 6000 <strong>to</strong> 36000 cm -1 , which includes the near-infrared, the visible<br />
and the soft ultraviolet ranges (files “E1.DAT” and “E2.DAT”). In addition, the static (i.e. zerofrequency)<br />
conductivity σ DC , equal <strong>to</strong> about 4.8 10 4 Ω -1 cm -1 , was obtained from conventional<br />
electrical measurements (file “S1DC.DAT”, which contains only one point).<br />
It is important <strong>to</strong> <strong>fit</strong> <strong>spectra</strong> simultaneously, since it helps <strong>to</strong> remove the uncertainty,<br />
given by the fact that in the far-infrared only one quantity (reflectivity) is measured, which is in<br />
general not enough <strong>to</strong> get both ε 1 and ε 2<br />
13 . Therefore, our goal is <strong>to</strong> <strong>fit</strong> all available data with<br />
the same model dielectric function. For simplicity, we shall use only the Drude-Lorentz<br />
formula (Equation 2-18).<br />
To begin with, let us load all <strong>spectra</strong> that we are going <strong>to</strong> use, one by one. First we load<br />
the reflectivity spectrum.<br />
Please, open the “Dataset Manager” window (Figure 3-6) and click the but<strong>to</strong>n in<br />
the first slot. In the window “Load Dataset #1” (shown in Figure 3-7) click the but<strong>to</strong>n<br />
on the <strong>to</strong>p. Select the master file “R.DAT” from the direc<strong>to</strong>ry “TUTORIAL\PART2”. As this<br />
file turns out <strong>to</strong> be rather big, we will generate a smaller dataset with different set of<br />
frequencies. In the “X” group box check the but<strong>to</strong>n “generate” and type 25 in the field “Xmin”,<br />
5000 in the field “Xmax” and 1000 in the field “# pts”. Check the “linear” grid. It means that<br />
the dataset will contain 1000 evenly (linearly) distributed frequency points in the range 25-<br />
5000 cm-1. As a result, the “Load Dataset #1” should look like in Figure 3-20. Click the<br />
but<strong>to</strong>n.<br />
12 This example was provided by F.P.Mena<br />
13 One can say, that the knowledge of the static conductivity and as well as high-frequency dielectric function<br />
helps <strong>to</strong> effectively ‘anchor’ the complex phase of the reflectance coefficient, which is difficult <strong>to</strong> measure in the<br />
far-infrared<br />
Guide <strong>to</strong> RefFIT Page 36
Figure 3-20 Loading the reflectivity dataset.<br />
Load dataset “E1.DAT” <strong>to</strong> slot #2. It contains not so many frequency points, so we would<br />
like <strong>to</strong> load it as it is. Just do not check “generate” but<strong>to</strong>n in the “X” group box. Load files<br />
“E2.DAT” and “S1DC.DAT” in the same way. If all downloads are OK, the “Dataset<br />
Manager” window should look as in Figure 3-21.<br />
Figure 3-21 The dataset manager after all four datasets are loaded.<br />
We will need one “Model” window <strong>to</strong> model the dielectric function of the sample. Could<br />
you create a new “Model” window? If you do not remember how, look at the first Tu<strong>to</strong>rial<br />
section (3.1) or at the Reference (section 4.5). Let us postpone the editing of the model<br />
parameters until we create the graphs.<br />
Guide <strong>to</strong> RefFIT Page 37
I suggest <strong>to</strong> create three graphs: one for the reflectivity, one for the dielectric function<br />
(both ε 1 and ε 2 ) and one for the <strong>optical</strong> conductivity. The X and Y ranges must be set<br />
according <strong>to</strong> the dataset ranges. The procedure <strong>to</strong> set the graph properties and curves was also<br />
described in section (3.1) and in the Reference (section 4.9).<br />
Let me ask you <strong>to</strong> set the X-range of the first graph <strong>to</strong> [0; 5500] and the Y-range <strong>to</strong> [0.65;<br />
1.0]. The default axis titles of “Wavenumber (1/cm)” and “Reflectivity” are OK here. Create<br />
experimental model reflectivity curves (“DATA [R] “R.DAT”” and “MODEL [R] “Model1””<br />
respectively).<br />
For the second graph set the X-range and the Y-range <strong>to</strong> [5000; 36000] and [-30; +30]<br />
correspondingly; change the Y-axis title <strong>to</strong> “Eps1, Eps2”. Create two dataset curves (“DATA<br />
[E1] “E1.DAT”” and “DATA [E2] “E2.DAT””) and two model curves (“MODEL [E1]<br />
“Model1”” and “MODEL [E2] “Model1””).<br />
For the third graph set the X-range <strong>to</strong> [0; 1000] and set the Y-range <strong>to</strong> [0; 60000]. Change<br />
the Y-title <strong>to</strong> “Sigma1 (S/cm)”. Plot the curves “DATA [S1] “S1DC.DAT”” and “MODEL<br />
[S1] “Model1””.<br />
Arrange the graphs on the screen in order <strong>to</strong> see them all at the same time.<br />
Now you can try <strong>to</strong> <strong>fit</strong> the data ‘by hand’ in order <strong>to</strong> get a good starting point for the<br />
au<strong>to</strong>mated <strong>fit</strong>ting routine. You will need more than one oscilla<strong>to</strong>r. I advise <strong>to</strong> use the slider in<br />
the “Parameter control” window (Figure 3-4) <strong>to</strong> change the values of the model parameter.<br />
Adjust the parameter minimum and maximum limits, if necessary (the maximum limit is only<br />
10000 by default, which is not enough in some cases).<br />
It may take a while before you find a reasonable <strong>fit</strong>, depending on your experience. For<br />
instance, it <strong>to</strong>ok me about 10 minutes <strong>to</strong> get a <strong>fit</strong> with one Drude and one Lorentz oscilla<strong>to</strong>r,<br />
shown in Figure 3-22. The match is not great, but it looks like an acceptable initial<br />
approximation. If you are not so happy with what you obtained, just copy my parameter values<br />
(you can load the model s<strong>to</strong>red in the file “MODEL1.RFM”).<br />
Guide <strong>to</strong> RefFIT Page 38
Figure 3-22 The general RefFIT view after the data <strong>fit</strong>ting ‘by hand’.<br />
OK, it is time for computer <strong>to</strong> work a little bit and refine the model parameters. We only<br />
have <strong>to</strong> set up the <strong>fit</strong>ting task <strong>to</strong> tell him what exactly we want <strong>to</strong> <strong>fit</strong>.<br />
Open the “Fit” window (Figure 3-12). We have <strong>to</strong> specify the chi-square terms<br />
2<br />
χ ν and<br />
their weights ν<br />
w from Equation 2-12. Click the but<strong>to</strong>n. In the window “Add Chi-square<br />
term(s)” (Figure 3-23) select all available terms: “[S1] “S1DC.DAT” – “Model1””, “[E2]<br />
“E2.DAT” – “Model1””, “[E1] “E1.DAT” – “Model1”” and “[R] “R.DAT” – “Model1”” and<br />
click .<br />
Guide <strong>to</strong> RefFIT Page 39
Figure 3-23 Adding the four available chi-square terms.<br />
The weights of all chi-square terms w ν are equal <strong>to</strong> one by default. However, here we<br />
have a case, when this is not the optimal choice. The reason is (see sections 2.1.2 and 2.1.3)<br />
that we did not set the proper data error bars. RefFIT always sets <strong>to</strong> them 0.01 unless other<br />
values are explicitly specified. I would suggest you <strong>to</strong> set w ν equal <strong>to</strong> 1000 for the term “R”, 1<br />
for the terms “E1” and “E2” and 1.0E-6 for the term “S1” (I found these values after several<br />
tries and errors). The window “Fit” should look like at Figure 3-24.<br />
Figure 3-24 The “Fit” window. Four chi-square terms are selected.<br />
Now you can click (which is my ‘favorite’ but<strong>to</strong>n, by the way). It takes seconds (or<br />
even fractions of a second) <strong>to</strong> reach a better <strong>fit</strong> that you can see at Figure 3-25. Not bad for a<br />
model with only two oscilla<strong>to</strong>rs! By the way, do not forget <strong>to</strong> save the model.<br />
Guide <strong>to</strong> RefFIT Page 40
Figure 3-25 The general RefFIT view after the au<strong>to</strong>mated data <strong>fit</strong>ting with a two-oscilla<strong>to</strong>r (Drude+Lorentz)<br />
model.<br />
You may want <strong>to</strong> improve the <strong>fit</strong> by putting more oscilla<strong>to</strong>rs. Having done it, you can<br />
compare your result with the one shown at Figure 3-26. Here 7 oscilla<strong>to</strong>rs in the model make<br />
the match almost perfect everywhere, except for the reflectivity at about 5000 cm-1. I guess the<br />
problem lies in some experimental mismatch between the measured low-frequency reflectivity<br />
and the reflectivity, that corresponds <strong>to</strong> the dielectric function at high frequencies. The model,<br />
shown in Figure 3-26, can be loaded from the file “MODEL2.RFM”.<br />
Guide <strong>to</strong> RefFIT Page 41
Figure 3-26 The general RefFIT view after the data <strong>fit</strong>ting with a model, which contains 7 oscilla<strong>to</strong>rs.<br />
3.3. Using macros<br />
3.3.1. Writing a simple macro<br />
All actions that we went through in section 3.2 can be programmed in a macro (see<br />
section 4.11). An obvious advantage of a macro is that it can be edited and run many times. A<br />
s<strong>to</strong>red macro also helps <strong>to</strong> recollect what exactly analysis has been performed the last time.<br />
An example of such a macro is given by the file “DEMO.RFS” in the direc<strong>to</strong>ry<br />
“TUTORIAL\PART3” (I advise <strong>to</strong> put the extension “.RFS” <strong>to</strong> all macro filenames). Below I<br />
put the listing of this file. Each command corresponds <strong>to</strong> some user action. They are separated<br />
by semicolons “;”. Note, that all lines starting from “#” are ignored by the macro interpreter.<br />
You can check the syntax of particular commands in the Reference (section 4.11).<br />
##################################################################<br />
#<br />
# This macro instructs RefFIT <strong>to</strong> perform the actions described<br />
# in the RefFIT Manual (Tu<strong>to</strong>rial section 3.2)<br />
# All input data are taken from the direc<strong>to</strong>ry "..\PART2"<br />
#<br />
# Written by A.Kuzmenko (2004)<br />
#<br />
##################################################################<br />
#------------------------------------------------------------------------------------<br />
# sets the dimensions and the title of the main (application) window<br />
Guide <strong>to</strong> RefFIT Page 42
MainWindow(XPos = 0, YPos = 0, Width = 1024, Height = 740, Title = "macro example");<br />
#------------------------------------------------------------------------------------<br />
# loads four datasets<br />
# here the frequency set is generated by RefFIT (XMethod = 3)<br />
LoadDataset(DatasetNo = 1, Quantity = "R", MasterFile = "..\PART2\R.DAT", XMethod =<br />
3,<br />
Xmin = 25.0, Xmax = 5000.0, XPts = 1000, XGrid = 2);<br />
# here the frequency sets are taken from the master file (XMethod = 1)<br />
LoadDataset(DatasetNo = 2, Quantity = "E1", MasterFile = "..\PART2\E1.DAT", XMethod =<br />
1);<br />
LoadDataset(DatasetNo = 3, Quantity = "E2", MasterFile = "..\PART2\E2.DAT", XMethod =<br />
1);<br />
LoadDataset(DatasetNo = 4, Quantity = "S1", MasterFile = "..\PART2\S1DC.DAT", XMethod<br />
= 1);<br />
#------------------------------------------------------------------------------------<br />
# creates a model (which is AUTOMATICALLY ascribed ModelNo = 1)<br />
NewModel(XPos = 0, YPos = 50, Width = 300, Height = 400);<br />
# loads a saved model file in<strong>to</strong> the model window<br />
LoadModel(ModelNo = 1, File = "..\PART2\MODEL2.RFM");<br />
#------------------------------------------------------------------------------------<br />
# makes and sets up three graph windows<br />
# creates a graph (which is AUTOMATICALLY ascribed GraphNo = 1)<br />
NewGraph(XPos = 300, YPos = 50, Width = 420, Height = 350);<br />
# sets the graph properties<br />
GraphProperties(GraphNo = 1, Xmin = 10, Xmax = 5500.0, Xlog = 0,<br />
Ymin = 0.65, Ymax = 1.0, Ylog = 0, YTitle = "Reflectivity");<br />
# plots the dataset #1<br />
AddDataCurve(GraphNo = 1, DatasetNo = 1, nColor = 0, ShowLine = 1, ShowSymbol = 1,<br />
ShowError = 0, nSymbolSize = 1, nSymbolShape = 0, SymbolOpen = 1, Scale = 1.0,<br />
Shift = 0.0);<br />
# plots a reflectivity curve, generated by the model #1<br />
AddModelCurve(GraphNo = 1, ModelNo = 1, Quantity = "R", nColor = 0, Scale = 1.0,<br />
Shift = 0.0);<br />
# creates a graph (which is ascribed GraphNo = 2)<br />
NewGraph(XPos = 300, YPos = 400, Width = 420, Height = 330);<br />
# and so forth...<br />
GraphProperties(GraphNo = 2, Xmin = 5000.0, Xmax = 36000.0, Xlog = 0,<br />
Ymin = -30.0, Ymax = 30.0, Ylog = 0, YTitle = "Eps1, Eps2");<br />
AddDataCurve(GraphNo = 2, DatasetNo = 2, nColor = 0, ShowLine = 1, ShowSymbol = 1,<br />
ShowError = 0, nSymbolSize = 1, nSymbolShape = 0, SymbolOpen = 1, Scale = 1.0,<br />
Shift = 0.0);<br />
AddDataCurve(GraphNo = 2, DatasetNo = 3, nColor = 0, ShowLine = 1, ShowSymbol = 1,<br />
ShowError = 0, nSymbolSize = 1, nSymbolShape = 0, SymbolOpen = 1, Scale = 1.0,<br />
Shift = 0.0);<br />
Guide <strong>to</strong> RefFIT Page 43
AddModelCurve(GraphNo = 2, ModelNo = 1, Quantity = "E1", nColor = 0, Scale = 1.0,<br />
Shift = 0.0);<br />
AddModelCurve(GraphNo = 2, ModelNo = 1, Quantity = "E2", nColor = 0, Scale = 1.0,<br />
Shift = 0.0);<br />
NewGraph(XPos = 650, YPos = 200, Width = 352, Height = 330);<br />
GraphProperties(GraphNo = 3, Xmin = 0, Xmax = 1000.0, Xlog = 0,<br />
Ymin = 0.0, Ymax = 60000, Ylog = 0, YTitle = "Sigma1 (S/cm)");<br />
AddDataCurve(GraphNo = 3, DatasetNo = 4, nColor = 0, ShowLine = 0, ShowSymbol = 1,<br />
ShowError = 0, nSymbolSize = 4, nSymbolShape = 0, SymbolOpen = 0, Scale = 1.0,<br />
Shift = 0.0);<br />
AddModelCurve(GraphNo = 3, ModelNo = 1, Quantity = "S1", nColor = 0, Scale = 1.0,<br />
Shift = 0.0);<br />
#------------------------------------------------------------------------------------<br />
# opens the "Fit" window<br />
WindowFit(Xpos = 0, YPos = 450);<br />
# adds four chi-square terms <strong>to</strong> the <strong>fit</strong>ting task, which means that all datasets are<br />
#requested <strong>to</strong> be <strong>fit</strong>ted, but does not perform <strong>fit</strong>ting yet<br />
AddChiSqTerm(DatasetNo = 1, ModelNo = 1, Weight = 1e3);<br />
AddChiSqTerm(DatasetNo = 2, ModelNo = 1, Weight = 1.0);<br />
AddChiSqTerm(DatasetNo = 3, ModelNo = 1, Weight = 1.0);<br />
AddChiSqTerm(DatasetNo = 4, ModelNo = 1, Weight = 1e-6);<br />
#------------------------------------------------------------------------------------<br />
# starts the <strong>fit</strong>ting, which is limited by 10 iterations<br />
Fit(NumIters = 10);<br />
#------------------------------------------------------------------------------------<br />
Listing 1 The commands of the macro “DEMO.RFS” simply imitate the user actions.<br />
How <strong>to</strong> run this macro? Technically speaking, you should provide the macro filename as<br />
a command-line parameter when you start RefFIT. As is written in section 4.11.1, there are<br />
several ways <strong>to</strong> do that. I would advise <strong>to</strong> associate the extension “.RFS” with the executable<br />
file “REFFIT.EXE”, which you can do, for instance, in the Windows Explorer program. After<br />
you have successfully done it, all macro files (including this file “DEMO.RFS”) should appear<br />
with an icon . Now double-click on the file “DEMO.RFS” and the macro will be executed.<br />
You may want <strong>to</strong> play a bit with some commands in order <strong>to</strong> better arrange the windows<br />
on the screen, or <strong>to</strong> change the graph parameters (scales, curve appearances etc.). Attention: if<br />
RefFIT will find an error in the macro, it will refuse <strong>to</strong> execute it. If this happens, you can<br />
‘locate’ the error by ‘commenting out’ the recently modified commands one-by-one (using the<br />
symbol “#”).<br />
3.3.2. Using cycles in a macro: the temperature dependence of phonon<br />
<strong>spectra</strong><br />
Now we consider an example of a more advanced macro, which routinely <strong>fit</strong>s reflectivity<br />
<strong>spectra</strong>, measured at several temperatures, with a Drude-Lorentz model.<br />
Here we take the reflectivity <strong>spectra</strong> of the cupric oxide CuO in the far-infrared (phonon)<br />
range for the electric field paraller <strong>to</strong> the b-axis (Ref. [10]). This example is very interesting,<br />
because the temperature dependence of the lineshape of one phonon mode demonstrates a<br />
Guide <strong>to</strong> RefFIT Page 44
emarkable ‘anomaly’, related <strong>to</strong> the antiferromagnetic ordering at about 210-230 Kelvin. The<br />
<strong>spectra</strong> were measured at temperatures 4, 100, 150, 180, 200, 210, 220, 230, 240, 250 and 300<br />
Kelvin. They are s<strong>to</strong>red as separate data files “RB003.DAT”, “RB100.DAT”, etc. in the<br />
direc<strong>to</strong>ry “TUTORIAL\PART4”. What we would like <strong>to</strong> do, is <strong>to</strong> <strong>fit</strong> all <strong>spectra</strong> one-by-one<br />
with a similar model (i.e. with the same set of oscilla<strong>to</strong>rs) allowing only parameter values <strong>to</strong> be<br />
varied. After that we shall plot the temperature dependence of the phonon parameters<br />
Before the writing of a macro we have <strong>to</strong> manually find a proper model for the dielectric<br />
function. Let us first have a look at three files “RB004.DAT”, “RB150.DAT” and<br />
“RB300.DAT”. You can load these files using the Dataset Manager and plot them on the same<br />
graph (see figure Figure 3-27).<br />
Figure 3-27 Three reflectivity <strong>spectra</strong> of CuO at 4, 150 and 300 K are plotted on the same graph.<br />
One can see that, although the <strong>spectra</strong> look rather different, they have at least three<br />
common phonon modes (two modes at around 160, 330 and a very intense and a strongly<br />
temperature-dependent one at about 400 cm -1 ). Few extra minor modes are present at low<br />
temperatures that we can ignore in our analysis.<br />
I would ask you <strong>to</strong> <strong>fit</strong> the reflectivity spectrum at 4 K with a Drude-Lorentz model. You<br />
will need <strong>to</strong> put three Lorentz oscilla<strong>to</strong>rs with all parameters free. Follow section 3.1 if you<br />
need more details on how <strong>to</strong> do that. Having obtained the <strong>fit</strong>, you can save your model (let say,<br />
as a file “MYMODEL.DAT”) and compare it with my version s<strong>to</strong>red in the file<br />
“MODEL.DAT” (see Figure 3-28).<br />
Guide <strong>to</strong> RefFIT Page 45
Figure 3-28 The <strong>fit</strong>ting of the reflectivity spectrum at 4 K with a three-oscilla<strong>to</strong>r model.<br />
Now we can proceed with a programming. A macro should first <strong>fit</strong> the spectrum at the<br />
lowest temperature (4 K); then it should <strong>fit</strong> the next spectrum (100 K), using the 4K parameter<br />
values as an initial approximation; then <strong>fit</strong> the 150 K spectrum, and so forth. On each step it<br />
must save the model parameters and export some model curves (for instance, the reflectivity or<br />
the <strong>optical</strong> conductivity) that can be plotted afterwards using any scientific graphics package<br />
(e.g., Origin).<br />
To run a cycle we will need the text file “LOOP.DAT”, each line of which corresponds <strong>to</strong><br />
one particular temperature (see Listing 2). More exactly, each line contains a particular version<br />
of the changeable (temperature-dependent) part of the data file name. I have already made this<br />
file for you, but you can also create it with any standard text edi<strong>to</strong>r.<br />
004<br />
100<br />
150<br />
180<br />
200<br />
210<br />
220<br />
230<br />
240<br />
250<br />
300<br />
Listing 2 File “LOOP.DAT” specifies the macro cycle.<br />
The macro itself, which is called “FITALL.RFS” is shown in the Listing 3.<br />
Guide <strong>to</strong> RefFIT Page 46
##################################################################<br />
#<br />
# This macro <strong>fit</strong>s the reflectivity <strong>spectra</strong><br />
# "RB004.DAT", "RB100.DAT", ... , "RB300.DAT",<br />
# which are measured for different temperatures, in a cycle.<br />
# All input data are taken from the same direc<strong>to</strong>ry<br />
#<br />
# Written by A.Kuzmenko (2004)<br />
#<br />
##################################################################<br />
#------------------------------------------------------------------------------------<br />
# opens the main window<br />
MainWindow(XPos = 0, YPos = 0, Width = 1024, Height = 740);<br />
#------------------------------------------------------------------------------------<br />
# creates a new model<br />
NewModel(XPos = 0, YPos = 50, Width = 300, Height = 240);<br />
#------------------------------------------------------------------------------------<br />
# creates and sets up a couple of new graphs (for reflectivity and conductivity<br />
NewGraph(XPos = 300, YPos = 50, Width = 720, Height = 350);<br />
GraphProperties(GraphNo = 1, Xmin = 75.0, Xmax = 4000.0, Xlog = 1, Ymin = 0.0,<br />
Ymax = 1.0, Ylog = 0, YTitle = "Reflectivity");<br />
AddModelCurve(GraphNo = 1, ModelNo = 1, Quantity = "R");<br />
NewGraph(XPos = 300, YPos = 400, Width = 720, Height = 330);<br />
GraphProperties(GraphNo = 2, Xmin = 75.0, Xmax = 4000.0, Xlog = 1, Ymin = 0.0,<br />
Ymax = 100.0, Ylog = 0, YTitle = "Conductivity");<br />
AddModelCurve(GraphNo = 2, ModelNo = 1, Quantity = "S1");<br />
#------------------------------------------------------------------------------------<br />
# opens the "Fit" window<br />
WindowFit(Xpos = 0, YPos = 450);<br />
#------------------------------------------------------------------------------------<br />
# loads a 'seed' model<br />
LoadModel(ModelNo = 1, File = "MODEL.RFM");<br />
#------------------------------------------------------------------------------------<br />
# enters the cycle loop<br />
BeginLoop(LoopFile = "LOOP.DAT");<br />
#----------------------------------------------------------------------------<br />
# changes the title of the application<br />
MainWindow(Title = "Fitting spectrum at T = %1 K");<br />
#----------------------------------------------------------------------------<br />
# loads a new experimental reflectivity curve<br />
LoadDataset(DatasetNo = 1, Quantity = "R", MasterFile = "RB%1.DAT",<br />
XMethod = 3, Xmin = 75.0, Xmax = 2000.0, XPts = 1000, XGrid = 2);<br />
#----------------------------------------------------------------------------<br />
# plots the experimental reflectivity curve<br />
Guide <strong>to</strong> RefFIT Page 47
AddDataCurve(GraphNo = 1, DatasetNo = 1, ShowLine = 1, ShowSymbol = 1,<br />
ShowError = 0, nSymbolSize = 1, nSymbolShape = 0, SymbolOpen = 1);<br />
#----------------------------------------------------------------------------<br />
# adds the corresponding chi-square term<br />
AddChiSqTerm(DatasetNo = 1, ModelNo = 1, Weight = 1.0);<br />
#----------------------------------------------------------------------------<br />
# wait until all the graphs are redrawn<br />
Wait();<br />
#----------------------------------------------------------------------------<br />
# performs the <strong>fit</strong>ting (maximum 10 iterations)<br />
Fit(NumIters = 10);<br />
#----------------------------------------------------------------------------<br />
# suspends the execution, allows the user <strong>to</strong> verify, that the <strong>fit</strong> is OK<br />
Suspend();<br />
#----------------------------------------------------------------------------<br />
# saves the new model parameters under a unique name<br />
SaveModel(ModelNo = 1, File = "MOD_%1.RFM");<br />
#----------------------------------------------------------------------------<br />
# export the model reflecitivity and conductivity curves<br />
ExportModelCurve(File = "RF_%1.DAT", ModelNo = 1, Quantity = "R",<br />
Xmin = 1E-4, Xmax = 1E6, XPts = 1000, XGrid = 2);<br />
ExportModelCurve(File = "S1_%1.DAT", ModelNo = 1, Quantity = "S1",<br />
Xmin = 0.995e-4, Xmax = 1.005e-4, XPts =3, XGrid = 1);<br />
#----------------------------------------------------------------------------<br />
# deletes the experimental reflectivity curve<br />
DeleteDataCurve(GraphNo = 1, DatasetNo = 1);<br />
#----------------------------------------------------------------------------<br />
#deletes the chi-square term<br />
DeleteChiSqTerm(DatasetNo = 1, ModelNo = 1);<br />
#----------------------------------------------------------------------------<br />
#unloads the dataset<br />
UnloadDataset(DatasetNo = 1);<br />
#------------------------------------------------------------------------------------<br />
# the end of the cycle loop<br />
EndLoop();<br />
#------------------------------------------------------------------------------------<br />
# deletes the model curve<br />
DeleteModelCurve(GraphNo = 1, ModelNo = 1, Quantity = "R");<br />
DeleteModelCurve(GraphNo = 2, ModelNo = 1, Quantity = "S1");<br />
#------------------------------------------------------------------------------------<br />
Guide <strong>to</strong> RefFIT Page 48
# res<strong>to</strong>res the original application title<br />
MainWindow(Title = "");<br />
#------------------------------------------------------------------------------------<br />
# exits the application<br />
Exit(QuitApp = 1);<br />
#------------------------------------------------------------------------------------<br />
Listing 3 Macro “FITALL.RFS” <strong>fit</strong>s the reflectivity <strong>spectra</strong> at different temperatures one-by-one in a cycle.<br />
The cycle body is marked by the two commands: BeginLoop and EndLoop. In the<br />
first command the name of the ‘loop file’ has <strong>to</strong> be specified (“LOOP.DAT”). The cycle will be<br />
repeated as many times as the number of lines in the loop file. On each stage the symbol “%1”<br />
in the file name parameter of all input-output commands (LoadDataset, SaveModel,<br />
ExportModelCurve) is substituted with the string in the corresponding line of the loop file<br />
(for instance, “RB%1.DAT” will be substituted by “RB004.DAT” on the first stage, by<br />
“RB100.DAT” on the second stage and so on.<br />
It is essential, that within the cycle body the commands LoadDataset,<br />
CreateDataCurve and AddChiSquareTerm are followed by the corresponding ‘anticommands’<br />
UnloadDataset, DeleteDataCurve and DeleteChiSquareTerm<br />
correspondingly. Otherwise the execution of a macro may cause the program crash (sorry, that<br />
RefFIT is not ‘fool-proof’ yet!).<br />
Now you can run the macro, as described in section 3.3.<br />
In the beginning it will <strong>fit</strong> the spectrum at 4 K and show a dialog window asking whether<br />
you want <strong>to</strong> continue the macro execution (see Figure 4-22). This dialog is invoked by the<br />
command Suspend that we put after the command Fit. If you are not happy with the <strong>fit</strong>ting<br />
quality, you can s<strong>to</strong>p the macro and ‘correct’ the model manually. It is also possible <strong>to</strong> correct<br />
the model without the terminating the macro and <strong>to</strong> continue the execution later on. If you find<br />
the <strong>fit</strong>ting match acceptable, then continue the program without doing anything.<br />
In this version the macro will ask you <strong>to</strong> verify the <strong>fit</strong>ting quality for every temperature. If<br />
you think it is unnecessary, then just remove or ‘comment out’ the command Suspend, and<br />
run the macro again. It is much faster now, isn’t it?!!!<br />
You may have noticed already that the macro execution creates a number of new files.<br />
These are: (i) the models saved in the files “MOD_XXX.RFM” (RefFIT format) and<br />
“MOD_XXX.ASC” (text format), (ii) the model reflectivity curves (files “RF_XXX.DAT”),<br />
(iii) the model <strong>optical</strong> conductivity curves (files “S1_XXX.DAT”), (iv) the file “PAR.DAT”,<br />
where RefFIT ‘flushes’ the model parameters <strong>to</strong> every time it saves a model (see section 4.5.1).<br />
You can use the file “PAR.DAT” <strong>to</strong> plot the temperature dependence of the parameters of<br />
the phonon modes. Let us make a graph of ω o (T ) and γ (T ) of the model third oscilla<strong>to</strong>r,<br />
which seems <strong>to</strong> change strongly when we sweep across the critical temperature. One way <strong>to</strong> do<br />
it is <strong>to</strong> import the file “PAR.DAT” <strong>to</strong> the Origin worksheet (see Figure 3-29). Then we should<br />
somehow convert the first column (which is a filename text) <strong>to</strong> the temperature (which is a<br />
Guide <strong>to</strong> RefFIT Page 49
number). Here you can do it just ‘by hand’, but when you have more temperatures, it makes<br />
sense <strong>to</strong> do the conversion differently 14 .<br />
Figure 3-29 File “PAR.DAT”, which contains the temperature dependence of the phonon parameter, can be<br />
imported in<strong>to</strong> Origin.<br />
The desired parameters are s<strong>to</strong>red in the 10-th and 12-th columns respectively (the<br />
meaning of columns is described in section 4.5.1). You can plot the graphs, as is shown in<br />
Figure 3-30. One can see that the phonon mode softens and narrows dramatically below the<br />
transition temperature (210-230 K). This is perhaps the strongest phonon anomaly I ever seen!<br />
ω 0 (cm -1 )<br />
410<br />
400<br />
390<br />
380<br />
370<br />
(a)<br />
0 50 100 150 200 250 300<br />
Temperature (K)<br />
0<br />
0 50 100 150 200 250 300<br />
Guide <strong>to</strong> RefFIT Page 50<br />
γ (cm -1 )<br />
60<br />
50<br />
40<br />
30<br />
20<br />
10<br />
(b)<br />
Temperature (K)<br />
Figure 3-30 The temperature dependence of a phonon mode, s<strong>to</strong>red in the file “PAR.DAT” after the macro<br />
execution.<br />
14 I know one ‘trick’: <strong>to</strong> import the file “LOOP.DAT” <strong>to</strong> the first column of this worksheet.
4. Reference<br />
4.1. System requirements<br />
RefFIT can be run under all Microsoft Windows versions starting from Windows 95.<br />
Although it is difficult <strong>to</strong> formulate specific computer requirements, one can advise <strong>to</strong> have at<br />
least 128 Mb of memory and processor faster than 1 GHz. The point is that some complicated<br />
<strong>fit</strong>ting tasks claim a lot of memory and are computationally rather challenging, especially if the<br />
variational dielectric functions are involved (see sections 2.2.4, 2.2.5, 4.6.3). Also, a high<br />
processor speed is necessary <strong>to</strong> update the screen in real time when a user is manually ‘playing<br />
with’ model parameters.<br />
4.2. Installation and starting RefFIT<br />
Although there is no setup program, the installation of RefFIT is very easy. One should<br />
manually create a direc<strong>to</strong>ry, e.g. “D:\REFFIT”, and copy <strong>to</strong> it all the files from the distribution<br />
package (including “REFFIT.EXE”), keeping the direc<strong>to</strong>ry structure. No extra files, such as<br />
dynamical libraries, have <strong>to</strong> be installed on the system.<br />
To start RefFIT, one should just run file “REFFIT.EXE”. It can be done, for instance, by<br />
double-clicking on the program icon in the Explorer program. To facilitate the program call one<br />
can create a shortcut <strong>to</strong> “REFFIT.EXE” on the Windows taskbar. When using a macro,<br />
“REFFIT.EXE” should be called with a macro name as a command line parameter. More<br />
details about macros can be found in section 4.11.<br />
Right after starting, the application window looks rather ascetic (Figure 4-1). All actions<br />
are done using the menus. The menu “File” is intended <strong>to</strong> Save and Load the RefFIT projects 15 .<br />
Via the “Window” menu all RefFIT windows (models, graphs etc.) are created. Finally, from<br />
the “Help” menu one can access the “RefFIT manual” (this file basically) 16 and get the “About”<br />
information.<br />
As usual, one can choose “Exit” in the “File” menu or click the but<strong>to</strong>n in order <strong>to</strong><br />
terminate the application.<br />
15<br />
This option is not realized yet! However, one can ‘save’ the project by writing it in the form of a macro.<br />
16<br />
It is supposed that your system can read the pdf-files (Adobe Reader or Adobe Acrobat must be already<br />
installed).<br />
Guide <strong>to</strong> RefFIT Page 51
Figure 4-1 This is how RefFIT looks like when it starts. No internal objects are created yet.<br />
4.3. Parameters<br />
A parameter in RefFIT is a number, which is used as an input for model formulas <strong>to</strong><br />
calculate <strong>optical</strong> quantities, and can be varied (manually or au<strong>to</strong>matically) in order <strong>to</strong> improve<br />
the match of the model and experimental <strong>spectra</strong>. The examples of parameters are Lorentzian<br />
transverse frequency, and experimental angle of incidence. Parameter values are displayed and<br />
can be manually edited either in the “Experimental parameters” window (Figure 4-3) or<br />
“Model” windows (Figure 4-4).<br />
The value is not the only characteristic of a parameter. Another essential property is the<br />
switch, which determines if a parameter is allowed <strong>to</strong> be varied in the au<strong>to</strong>mated <strong>fit</strong>ting (active<br />
in <strong>fit</strong>) or not. There are also maximal and minimal values (limits) that parameters may have 17 .<br />
To access these extra characteristics a separate window is provided, which is called<br />
“Parameter control” (Figure 4-2). It contains the full information about the parameter, which is<br />
currently selected. To see the characteristics of another parameter, one should select it by a<br />
mouse click or by moving the marker <strong>to</strong> it with the arrow keys. This window also contains a<br />
trackbar, which allows you <strong>to</strong> change the parameter value in a comfortable way by dragging it<br />
up and down. Note that all the other windows in RefFIT will be updated in real time.<br />
17 Although the limits can be set, the <strong>fit</strong>ting routine is not yet able <strong>to</strong> take them in<strong>to</strong> account<br />
Guide <strong>to</strong> RefFIT Page 52
Figure 4-2 The “Parameter control” windows contains the full information about the selected parameter.<br />
The activity switch can be also <strong>to</strong>ggled in the “Model” window by clicking right mouse<br />
but<strong>to</strong>n on the parameter, or pressing SPACE when the parameter is selected.<br />
4.4. Experimental Parameters<br />
There is a set of parameters, which are not directly related <strong>to</strong> the model dielectric<br />
functions, but rather <strong>to</strong> the experimental conditions. For instance, the reflectivity coefficient<br />
depends on the angle of incidence, even though the dielectric function does not. This kind of<br />
parameters is collected in a separate window called “Experimental parameters” (Figure 4-3). It<br />
can be displayed by choosing the corresponding item in the “Window” menu.<br />
Figure 4-3 The “Experimental parameters” window lists all parameters, related <strong>to</strong> the experimental conditions.<br />
One should note that experimental parameters apply <strong>to</strong> the output quantities of the models<br />
of the Dielectric Function type only (see section 4.6). In the case of other model types all the<br />
parameters, necessary <strong>to</strong> calculate model outputs, are contained in the model window.<br />
The description of all the experimental parameters is given in Table 4-1.<br />
Parameter name Units Description<br />
Sample thickness cm Thickness of the sample, used <strong>to</strong> calculate the coefficient of<br />
transmission with the interference (“T”) and without the<br />
interference “TT”.<br />
Thickness spread - The relative spread of the sample thickness. Used <strong>to</strong> model<br />
the effect of non-parallel (wedged) sample. Applies <strong>to</strong> the<br />
quantities “T” and “TT”.<br />
Angle of incidence degrees The angle of incidence. The normal incidence corresponds <strong>to</strong><br />
0 o , the <strong>to</strong>tally grazing incidence – 90 o . Applies only <strong>to</strong> “Rp”,<br />
“Rs” and “Rps”.<br />
Guide <strong>to</strong> RefFIT Page 53
Angle spread degrees The absolute spread of angles of incidence. Used <strong>to</strong> model<br />
the effect of non-parallel beam. Applies <strong>to</strong> “Rp”, “Rs” and<br />
“Rps”.<br />
Scaling fac<strong>to</strong>r of R - Used <strong>to</strong> scale the calculated value of reflectivity by a<br />
constant value. Has no particular physical meaning, but may<br />
help <strong>to</strong> simulate the systematic error bars. Applies only <strong>to</strong><br />
‘R’, ‘Rp’ and ‘Rs’.<br />
Scaling fac<strong>to</strong>r of T - The same as, scaling fac<strong>to</strong>r of R, but applied <strong>to</strong> the<br />
transmission coefficient (“T” and “TT”).<br />
Table 4-1 The description of the experimental parameters.<br />
4.5. Models<br />
Models are the central objects in the RefFIT program. One can define a model as a set of<br />
parameters, which are used <strong>to</strong> calculate a set of <strong>optical</strong> quantities, for example reflectivity,<br />
conductivity, loss function etc., according <strong>to</strong> certain sets of formulas. Each model is<br />
represented by a separate window, which looks like Figure 4-4.<br />
Figure 4-4 An example of the window.<br />
In order <strong>to</strong> create a new model one should choose the “Model” command in the<br />
“Window” menu. One can open as many as 100 models at the same time. They will<br />
au<strong>to</strong>matically receive names “Model1”, “Model2” etc.<br />
To close the existing model window you can either click either or but<strong>to</strong>n.<br />
When the Model window is closed then the model itself is destroyed as an object.<br />
The model window can be rescaled.<br />
4.5.1. Saving and loading models<br />
A Model can be s<strong>to</strong>red in a separate file. To do that, one should activate the<br />
corresponding window and press the F2 but<strong>to</strong>n. In the “Save Model as” window that appears<br />
one can specify the file path (direc<strong>to</strong>ry) and the file name. The convention is that the model<br />
files have the extension “RFM”, e.g. “MYMODEL.RFM”.<br />
Guide <strong>to</strong> RefFIT Page 54
The model file s<strong>to</strong>res information about the parameters in the internal RefFIT format,<br />
which cannot be viewed or accessed by other programs. However, every time a model is saved,<br />
an extra file is created au<strong>to</strong>matically, which lists all parameter values and error bars in the text<br />
format, that can be opened, e.g, by the Notepad program. This file has the same name as the<br />
model file, but the extension “ASC”. For instance, after saving a model under file name<br />
“MOD12.RFM”, a text file “MOD12.ASC” is created. Note, that error bars are not calculated,<br />
unless the corresponding <strong>fit</strong>ting option is specified (section 4.10.2).<br />
There is another ‘side’ action, which accompanies model saving. Namely, a new line is<br />
added <strong>to</strong> a file called “PAR.DAT”, which lies in the current direc<strong>to</strong>ry. This line has the<br />
following format “ModelFileName Chi-Square Einf Wo[1] Wp[1] G[1] Wo[2] Wp[2] G[2]<br />
Wo[3] Wp[3] G[3] …”, where ModelFileName is the filename of the model saved, Chi-Square<br />
is the current value of the <strong>fit</strong>ting chi-square, Einf is the value of ε ∞ , Wo[1], Wp[1] and G[1]<br />
are the values parameter ω 0 , ω p and γ from the first row in the Lorentzian table, Wo[2],<br />
Wp[2] and G[2] are the parameters from the second row and so on. File “PAR.DAT” is very<br />
useful, when, for example, the <strong>spectra</strong> for different temperatures are <strong>fit</strong>ted in a cycle and for<br />
each temperature the model is saved under a different name. Then one can easily plot the<br />
temperature dependence of model parameters, such as plasma frequency or conductivity gap,<br />
using any standard scientific graphics package (see an example in section 3.3.2).<br />
A saved model can be loaded in<strong>to</strong> an existing model window. One should create a new<br />
model window or activate the existing one and press the F3 but<strong>to</strong>n. After that the model file <strong>to</strong><br />
be loaded has <strong>to</strong> be selected. It is a good idea <strong>to</strong> save models after each modification (e.g.,<br />
<strong>fit</strong>ting run) <strong>to</strong> avoid the potential loss of data.<br />
4.5.2. Editing models<br />
The rows in the ‘Lorenzian’ section can be added and deleted by the but<strong>to</strong>ns and<br />
, or, alternatively, by the Insert and Delete keys. A row can be moved up and down by<br />
clicking and . They can also be sorted in different ways by mouse clicking on the<br />
column headers. For instance, in order <strong>to</strong> sort the Lorenzians by increasing transversal<br />
frequencies one should click on the first column header “Wo”.<br />
4.5.3. Model types<br />
The meanings of parameters and output <strong>optical</strong> <strong>spectra</strong> depend on the model type. At the<br />
moment there exist several types of models. The most common one is the “Dielectric Function”<br />
type (see section 4.6). Each newly created model is assumed <strong>to</strong> be of this type. In this case the<br />
meaning of the parameters exactly corresponds <strong>to</strong> the text labels in the Model window.<br />
Initially the “Dielectric Function” was the only model type in RefFIT, but recently other<br />
types were introduced (see section 4.7). Due <strong>to</strong> technical reasons it was easier <strong>to</strong> keep the same<br />
appearance of the Model window for other model types and use special ‘tricks’ in order <strong>to</strong><br />
explain RefFIT that the model type is not “Dielectric Function”.<br />
According <strong>to</strong> the convention, the way <strong>to</strong> change the model type is <strong>to</strong> put a negative<br />
integer number (code) in<strong>to</strong> the parameter “Einf” and make this parameter fixed (look red on the<br />
screen). The code -1 corresponds <strong>to</strong> the extra (special) model type 1, code -2 corresponds <strong>to</strong> the<br />
Guide <strong>to</strong> RefFIT Page 55
extra model type 2, etc. In this case “Einf” is not treated as a parameter but just as model type<br />
identifier and the text labels in the Model window do not have original meanings anymore.<br />
Particular meaning of parameters in the “Lorenzian” section depends on the model type. I must<br />
apologize for such an ‘awkward’ convention, which was temporarily chosen <strong>to</strong> avoid the major<br />
changes in the program’s user interface. In future RefFIT versions a more elegant way <strong>to</strong><br />
distinguish model types will surely be found.<br />
Each model has a set of output quantities, which depends on the model type. Different<br />
quantities are designated by abbreviations. For instance, reflectivity is referred <strong>to</strong> as “R”, the<br />
real part of conductivity – “S1”, penetration depth – “PD” etc. These abbreviations are<br />
meaningful only for the Dielectric Function model. For other types the meaning of the output<br />
quantities is different, although the same abbreviations are used.<br />
The next sections describe different model types.<br />
4.6. “Dielectric function” model<br />
In the “Dielectric Function” model the complex dielectric function ε = ε1<br />
+ iε<br />
2 is<br />
calculated as a sum (linear superposition) of different terms, e.g., Drude, Lorentz, or others,<br />
using the parameters residing in the “Model” window. The dielectric function has only one<br />
component, thus this model is applicable either <strong>to</strong> the isotropic sample or <strong>to</strong> the special<br />
experiment geometry, when only one component of the dielectric tensor is involved 18 .<br />
All the output <strong>optical</strong> quantities are derived from the dielectric function. In some cases<br />
extra parameters are used from the “Experimental parameters” set. For example, the<br />
transmission of a thin sample depends on sample thickness.<br />
Table 4-2 lists all output quantities of the “Dielectric Function” model. The formulas in<br />
this table refer <strong>to</strong> the complex refraction index N = n1<br />
+ in2<br />
= ε , complex reflectivity<br />
1−<br />
N<br />
ωε<br />
r = r1<br />
+ ir2<br />
= and complex <strong>optical</strong> conductivity σ = σ 1 + iσ<br />
2 = .<br />
1+<br />
N<br />
4πi<br />
Quantity<br />
abbre-<br />
viation<br />
“R” Normalincidence<br />
reflectivity of<br />
semi-infinite<br />
Description Calculation formula(s) Units Experimental<br />
parameters<br />
sample<br />
“T” Normalincidence<br />
transmission of<br />
a finitethickness<br />
sample,<br />
2<br />
α R | r |<br />
- Scaling fac<strong>to</strong>r<br />
T T α<br />
average<br />
, where<br />
18 Some special models can combine several isotropic dielectric function <strong>to</strong> form a tensor.<br />
of R ( α R )<br />
- sample<br />
thickness<br />
( d ),<br />
thickness<br />
spread ( s d ),<br />
scaling fac<strong>to</strong>r<br />
Guide <strong>to</strong> RefFIT Page 56
considering<br />
multiple (Fabri-<br />
Perot) internal<br />
reflections and a<br />
possible<br />
thickness spread<br />
“TT” Normalincidence<br />
transmission of<br />
a finitethickness<br />
sample, ignoring<br />
multiple (Fabri-<br />
Perot) internal<br />
reflections but<br />
considering a<br />
possible<br />
thickness spread<br />
“Rp” Grazingincidence<br />
reflectivity (ppolarization)<br />
T<br />
N<br />
∑ wi<br />
average =<br />
i=<br />
0<br />
N<br />
∑<br />
i=<br />
1<br />
T ( d )<br />
Guide <strong>to</strong> RefFIT Page 57<br />
w<br />
1 ⎛ i − N / 2 ⎞<br />
wi = , d i = d⎜1<br />
+ sd<br />
⎟ ,<br />
N + 1 ⎝ N ⎠<br />
( N = 10 ),<br />
2<br />
( 1−<br />
r ) t(<br />
d)<br />
T ( d)<br />
= ,<br />
2<br />
1−<br />
r t(<br />
d)<br />
⎛ ω ⎞<br />
t( d)<br />
= exp⎜i<br />
ε d ⎟<br />
⎝ c ⎠<br />
T T α<br />
T<br />
average<br />
, where<br />
N<br />
∑<br />
i<br />
= average<br />
i = 0<br />
N<br />
∑<br />
i = 1<br />
w<br />
i<br />
i<br />
i<br />
2<br />
wT<br />
( d )<br />
1 ⎛ i − N / 2 ⎞<br />
wi = , d i = d⎜1<br />
+ sd<br />
⎟ ,<br />
N + 1 ⎝ N ⎠<br />
( N = 10 ),<br />
2<br />
T ( d)<br />
= ( 1−<br />
r ) t(<br />
d)<br />
,<br />
⎛ ω ⎞<br />
t( d)<br />
= exp⎜i<br />
ε d ⎟<br />
⎝ c ⎠<br />
α R R p<br />
R<br />
p<br />
average<br />
i<br />
2<br />
, where<br />
N<br />
∑ wi<br />
average<br />
=<br />
i=<br />
0<br />
N<br />
∑<br />
i=<br />
1<br />
R<br />
p<br />
w<br />
i<br />
,<br />
,<br />
(θ )<br />
1 ⎛ i − N / 2 ⎞<br />
wi = , θ i = θ⎜1<br />
+ sd ⎟ ,<br />
N + 1 ⎝ N ⎠<br />
( N = 10 ),<br />
2<br />
R p ( θ ) = rp<br />
( θ )<br />
,<br />
r p<br />
ε cosθ<br />
−<br />
( θ ) =<br />
ε cosθ<br />
+<br />
i<br />
ε − sin<br />
,<br />
ε − sin<br />
2<br />
2<br />
θ<br />
θ<br />
of T ( α T )<br />
- sample<br />
thickness (d),<br />
thickness<br />
spread (sd),<br />
scaling fac<strong>to</strong>r<br />
of T (αT)<br />
- angle of<br />
incidence<br />
(θ ), angle<br />
spread ( s θ ),<br />
scaling fac<strong>to</strong>r<br />
of R ( α R )
“Rs” Grazingincidence<br />
reflectivity (spolarization)<br />
“Rps” Ratio between<br />
Rp and Rs<br />
“E1” The real part of<br />
the dielectric<br />
function<br />
“E2” The imaginary<br />
part of the<br />
dielectric<br />
function<br />
R s R α<br />
R<br />
s<br />
average<br />
, where<br />
N<br />
∑ wi<br />
average =<br />
i=<br />
0<br />
N<br />
∑<br />
i=<br />
1<br />
R (θ )<br />
1 ⎛ i − N / 2 ⎞<br />
wi = , θ i = θ⎜1<br />
+ sd ⎟ ,<br />
N + 1 ⎝ N ⎠<br />
( N = 10 ),<br />
2<br />
R ( ) = r ( θ )<br />
r s<br />
s θ s<br />
cosθ<br />
−<br />
( θ ) =<br />
cosθ<br />
+<br />
R ps<br />
R<br />
ps<br />
average<br />
, where<br />
Guide <strong>to</strong> RefFIT Page 58<br />
s<br />
w<br />
N<br />
∑ wi<br />
average<br />
=<br />
i=<br />
0<br />
N<br />
i<br />
i<br />
ε − sin<br />
ε − sin<br />
R<br />
∑<br />
i=<br />
1<br />
ps<br />
w<br />
i<br />
2<br />
2<br />
i<br />
,<br />
θ<br />
θ<br />
(θ )<br />
1 ⎛ i − N / 2 ⎞<br />
wi = , θ i = θ⎜1<br />
+ sd ⎟ ,<br />
N + 1 ⎝ N ⎠<br />
( N = 10 ),<br />
2<br />
R ( ) = r ( θ )<br />
r<br />
ps θ ps<br />
ps<br />
r<br />
( θ ) =<br />
r<br />
“S1” The real part of<br />
the <strong>optical</strong><br />
conductivity in<br />
practical units<br />
π<br />
σ 1 ×<br />
15<br />
“S2” The imaginary<br />
part of the<br />
π<br />
σ 2 ×<br />
15<br />
p<br />
s<br />
2<br />
2<br />
sin θ − cosθ<br />
ε − sin θ<br />
=<br />
2<br />
2<br />
sin θ + cosθ<br />
ε − sin θ<br />
,<br />
- angle of<br />
incidence<br />
(θ ), angle<br />
spread ( s θ ),<br />
scaling fac<strong>to</strong>r<br />
of R ( α R )<br />
- angle of<br />
incidence<br />
(θ ), angle<br />
spread ( s θ )<br />
ε - -<br />
1<br />
ε - -<br />
2<br />
Ω -1 cm -1 -<br />
Ω -1 cm -1 -
<strong>optical</strong><br />
conductivity in<br />
practical units<br />
“N1” The real part of<br />
the refraction<br />
index<br />
“N2” The imaginary<br />
part of the<br />
refraction index<br />
(extinction<br />
coefficient)<br />
“PD” Penetration<br />
depth<br />
1<br />
2πn2ω<br />
“LF” Loss function ⎛ 1 ⎞ ε 2<br />
Im⎜−<br />
⎟ = 2 2<br />
⎝ ε ⎠ ε + ε<br />
Table 4-2 The output quantities of the “Dielectric Function” model.<br />
4.6.1. Drude-Lorentz dielectric function<br />
n - -<br />
1<br />
n - -<br />
2<br />
1<br />
cm -<br />
Guide <strong>to</strong> RefFIT Page 59<br />
2<br />
- -<br />
The physical meaning of the Drude-Lorentz (DL) dielectric function and its parameters is<br />
described in section 2.2.3.<br />
The dimensionless ε ∞ is s<strong>to</strong>red in the “Einf” field. Each row in the “Lorentzians” table<br />
corresponds <strong>to</strong> one oscilla<strong>to</strong>r. The transverse frequency ω 0 is taken from the column “Wo”<br />
(measured in cm -1 ), plasma frequency ω p – from column “Wp” (measured in cm -1 ), and<br />
linewidth γ (measured in cm -1 ) – from column “G”. The light frequency ω is measured in cm -<br />
1<br />
as well.<br />
The Drude term is a particular case of the Lorentz term, with ω 0 = 0 . In this case ω 0<br />
must be fixed (not active in <strong>fit</strong>).<br />
4.6.2. Special dielectric functions<br />
In addition <strong>to</strong> the standard Drude-Lorentz model RefFIT has a number of extra built-in<br />
formulas for the dielectric function. In this section we will describe all of them.<br />
The parameters of the extra (special) dielectric functions can be s<strong>to</strong>red in the<br />
“Lorentzians” table of the model window, using a ‘trick’, similar <strong>to</strong> the one intended <strong>to</strong><br />
distinguish the Dielectric Function model from other (special) models (section 4.5).<br />
By default, RefFIT assumes that each row in the “Lorentzians” table corresponds <strong>to</strong> a<br />
Lorentz oscilla<strong>to</strong>r. However, if the “Wo” column contains a negative integer value, e.g., -10 (it<br />
should be also fixed!), RefFIT considers the parameters in the “Wp” and “G” columns as the<br />
ones of a special dielectric function. The particular type of a dielectric function is determined<br />
by the number in the “Wo” column. Some special functions depend on more than two<br />
parameters, so that two or more rows are necessary <strong>to</strong> s<strong>to</strong>re them.
The list of the built-in special dielectric function formulas is given in Table 4-3. The<br />
selection might look strange at a first glance. The point is that it is not meant <strong>to</strong> be a<br />
comprehensive collection of functions for <strong>fit</strong>ting. It is rather a set of some special formulas that<br />
RefFIT users, including myself, have ever employed in their data analysis. As was mentioned<br />
in the Introduction, the list is being continuously extended and everyone can ask me <strong>to</strong> include<br />
an extra function that he (or she) would like <strong>to</strong> have. The light frequency ω is assumed <strong>to</strong> be in<br />
cm -1 . Note, that all the formulas give a dielectric function that satisfies Kramers-Kronig<br />
relations (see section 2.2.1), unless the opposite is explicitly mentioned.<br />
Dielectric function<br />
Van der Marel’s formula for the dielectric function of a non-<br />
Fermi liquid (Ref.[11], formula (15))<br />
2<br />
ω p<br />
ε = −<br />
2α<br />
1−2α<br />
ω(<br />
ω + iγ<br />
1)<br />
( ω + iγ<br />
2 )<br />
Formula for the c-axis dielectric function of cuprates with the<br />
body-centered tetragonal structure liquids (Ref.[11], formula<br />
(14))<br />
2<br />
4 2<br />
3 2 3 / 2<br />
ε = ( 60i<br />
/ ω)<br />
2σ<br />
( 1+<br />
2Ω<br />
)( 1−<br />
8Ω<br />
− 8Ω<br />
) + 16Ω<br />
( 1+<br />
Ω ) ,<br />
0<br />
where Ω = ( γ 1 − iω)<br />
/ γ 2<br />
[ ]<br />
Formula for the ab-plane dielectric function of cuprates<br />
(Ref.[11], formula (3))<br />
γ 1<br />
ε = ( 60i<br />
/ ω)<br />
σ 0<br />
,<br />
γ − iω<br />
γ + γ − iω<br />
1<br />
1<br />
The dielectric function of a weak-coupling s-wave BCS<br />
superconduc<strong>to</strong>r with arbitrary scattering rate (Ref. [12]).<br />
Parameter t is the reduced temperature t = T / Tc<br />
. The formulas<br />
of Ref.[12] are taken as they are, with τ = 1/<br />
γ , except for the<br />
temperature dependence of the gap, which in this case is<br />
π<br />
∆ ( t)<br />
= ∆ 0 cos t .<br />
2<br />
Note: the computational code is taken from Ref..[12].<br />
Drude (not Lorentz!) term with arbitrary sign of the <strong>spectra</strong>l<br />
weight<br />
A<br />
ε = −<br />
ω(<br />
ω + iγ<br />
)<br />
Note: although a negative A would have a little physical<br />
meaning for the usual dielectric function, it can be used for the<br />
differential dielectric function (see section 4.7.1).<br />
Constant (frequency independent) dielectric function<br />
ε = ε1<br />
+ iε<br />
2<br />
Note: this function is simple but obviously NOT Kramers-<br />
2<br />
Wo<br />
(code)<br />
Wp G<br />
-1 ω p<br />
[cm -1 ]<br />
α<br />
-2 γ 1<br />
[cm -1 ]<br />
γ 2<br />
[cm -1 ]<br />
-3 σ 0<br />
[Ω -1 cm -1 ]<br />
-<br />
-4 γ 1<br />
[cm -1 ]<br />
γ 2<br />
[cm -1 ]<br />
-5 σ 0<br />
[Ω -1 cm -1 ]<br />
γ 1<br />
[cm -1 ]<br />
Guide <strong>to</strong> RefFIT Page 60<br />
-6<br />
-7 ω p<br />
[cm -1 ]<br />
-8 t 0<br />
-9 A<br />
[cm -2 ]<br />
-10<br />
-<br />
ε 1 ε<br />
2<br />
γ 2<br />
[cm -1 ]<br />
γ<br />
[cm -1 ]<br />
∆<br />
[cm -1 ]<br />
γ<br />
[cm -1 ]
Kronig friendly, so be careful!<br />
“Gapped” Drude function:<br />
4πσ 1(<br />
ω)<br />
ε ε1<br />
+ i + Aδ<br />
( ω)<br />
ω<br />
4πσ 1(<br />
ω)<br />
ε = ε1<br />
+ i , if fSW = 0.<br />
ω<br />
= , if fSW = 1<br />
Here<br />
σ 1 ( ω ) = Γ ( ω ) σ 1 D ( ω ) is the “gapped” conductivity,<br />
∞<br />
σ ′ ′<br />
1(<br />
ω ) dω<br />
ε1<br />
( ω)<br />
= 1+<br />
8∫<br />
is the KK transform of σ 2 2<br />
1 ,<br />
ω′<br />
− ω<br />
0<br />
1 ⎛ ⎛ ⎞<br />
⎜<br />
ω − 2∆<br />
⎞<br />
Γ(<br />
ω)<br />
= ξ + −<br />
⎟<br />
⎜<br />
+ ⎜<br />
⎟<br />
0 ( 1 ξ 0 ) 1 tanh<br />
2<br />
⎟<br />
,<br />
⎝ ⎝ 2δ<br />
∆ ⎠⎠<br />
is the smoothed step function,<br />
2<br />
ω pγ<br />
σ 1D<br />
( ω)<br />
=<br />
is the Drude conductivity.<br />
2 2<br />
4π<br />
( γ + ω )<br />
Here A is the <strong>spectra</strong>l weight added at zero frequency <strong>to</strong><br />
compensate the loss of <strong>spectra</strong>l weight due <strong>to</strong> the gap (if fSW =<br />
1). In other words, A is adjusted in order <strong>to</strong> keep the <strong>to</strong>tal<br />
2<br />
<strong>spectra</strong>l weight as if it there were no gap (e.g., ω / 8 ).<br />
Note: This formula has no microscopic justification. It is just a<br />
handy way <strong>to</strong> introduce the conductivity gap of a controllable<br />
shape <strong>to</strong> the Drude dielectric while keeping the KK relations.<br />
The shape depends on the gap value ∆ , the gap spread δ ∆ and<br />
the filling fac<strong>to</strong>r ξ (0 for the full gap, 1 for no gap). A similar<br />
0<br />
dielectric (but without the KK transformation) was used in<br />
Ref.[13].<br />
Lorentz term with arbitrary sign of the <strong>spectra</strong>l weight<br />
A<br />
ε = − 2 2<br />
ω0<br />
− ω − iγω<br />
Note: although a negative value of A would have little physical<br />
meaning for the usual dielectric function, it can be used for the<br />
differential dielectric function (see section 4.7.1).<br />
The difference between two Lorentzians with the same <strong>spectra</strong>l<br />
weight and linewidth, but different frequencies<br />
A<br />
A<br />
ε = −<br />
2 2<br />
2 2<br />
ω1<br />
− ω − iγω<br />
ω2<br />
− ω − iγω<br />
Note: this term allows <strong>to</strong> model the shift of the oscilla<strong>to</strong>r<br />
frequency in the differential dielectric function (see section<br />
-20 ω p<br />
[cm -1 ]<br />
-21 ∆<br />
[cm -1 ]<br />
γ<br />
[cm -1 ]<br />
δ ∆<br />
[cm -1 ]<br />
Guide <strong>to</strong> RefFIT Page 61<br />
p<br />
-22<br />
ξ 0<br />
-25 A<br />
[cm -2 ]<br />
-26<br />
-27<br />
ω 0<br />
[cm -1 ]<br />
ω 1<br />
[cm -1 ]<br />
-28 A<br />
[cm -2 ]<br />
fSW<br />
γ<br />
[cm -1 ]<br />
-<br />
ω 2<br />
[cm -1 ]<br />
γ<br />
[cm -1 ]
4.7.1).<br />
The same function as for codes -25 and -26, just in case one<br />
needs two terms of this type.<br />
Table 4-3 Special dielectric functions.<br />
4.6.3. Variational (free-shape) dielectric function<br />
-29 A<br />
[cm -2 ]<br />
-30<br />
ω 0<br />
[cm -1 ]<br />
γ<br />
[cm -1 ]<br />
-<br />
A variational dielectric function (VDF) 19 is very different from a ‘conventional’ one in a<br />
sense, that it is not described by a single mathematical formula. Instead, the values of the<br />
dielectric function at every experimental frequency point are considered as independent<br />
parameters. The theory behind this approach is given in sections 2.2.4 and 2.2.5.<br />
A VDF can be in one of two regimes: the KK-constrained and not KK-constrained ones.<br />
In the not-KK-constrained regime both ε 1 and ε 2 are treated as independently varied<br />
parameters at every frequency point (see section 2.2.5). In the KK-constrained regime only ε 2<br />
is treated as an independent function, while ε 1 is given by the KK-transform of ε 2 (see section<br />
2.2.4).<br />
An extra constraint in the KK mode is that ε 2 is zero at the edges of the <strong>spectra</strong>l range. It<br />
is due <strong>to</strong> avoid discontinuity of ε 2 , which causes divergent singularities in ε 1.<br />
Let N be the number of experimental frequency points. From the above it is clear that<br />
the KK-constrained VDF will have N − 2 parameters, while the non-KK-constrained one will<br />
have 2 N parameters. As the usual RefFIT parameters, the parameters, related <strong>to</strong> the VDF, can<br />
be active or inactive in <strong>fit</strong>.<br />
I beg pardon since the user interface designed <strong>to</strong> handle the variational dielectric function<br />
is rather rudimental. The reason is that the first-found ‘temporary’ interface solution is still<br />
used. It will be designed certainly more logically in future.<br />
One VDF can be optionally added <strong>to</strong> the <strong>to</strong>tal model dielectric function. The user can<br />
switch it on and off (if it is off, the VDF part is ignored when the <strong>to</strong>tal dielectric function is<br />
calculated). The frequency set ω i (see section 2.2.4) is specified when the VDF is initialized.<br />
The user can switch from the KK-constrained regime <strong>to</strong> the non-KK-constrained one and back.<br />
He can also switch on and off the VDF <strong>fit</strong>ting activity (when its <strong>fit</strong>ting activity is off, all<br />
parameters of the VDF are fixed).<br />
The status of the free-shape dielectric function and its parameters cannot be seen in the<br />
model window. However, it can be modified by pressing one of special but<strong>to</strong>ns F4, F5, F6 and<br />
F7, while the model window is active. The action of these but<strong>to</strong>ns is described in Table 4-4.<br />
Key Action<br />
F4 Switches the VDF of this model on and off. When switched off, it is not removed<br />
from the memory, but just ignored and does not contribute <strong>to</strong> the <strong>to</strong>tal dielectric<br />
19 we will also refer <strong>to</strong> variational dielectric function as “free-shape” dielectric function<br />
Guide <strong>to</strong> RefFIT Page 62
function. This command cannot be used before the initialization (but<strong>to</strong>n F6).<br />
F5 Toggles between the KK-constrained and non KK-constrained modes. This<br />
command cannot be used before the initialization (but<strong>to</strong>n F6).<br />
F6 Initializes the VDF of this model. Attention: the set of the frequency points ω i is<br />
copied from the dataset #1. Make sure, that there is a dataset there! After pressing<br />
F6 the VDF is switched on in the KK-constrained regime and all its parameters<br />
are active in <strong>fit</strong> (<strong>to</strong> change that later, use F4, F5 and F7). The initial values of all<br />
parameters are zero.<br />
F7 Toggles the <strong>fit</strong>ting activity of all parameters on and off simultaneously. This<br />
command cannot be used before the initialization (but<strong>to</strong>n F6).<br />
Table 4-4 The description of the controls of the variational dielectric function.<br />
The ‘bad news’ is that VDF is not saved <strong>to</strong>gether with the model (when using but<strong>to</strong>n F2).<br />
However, this shortcoming is easily bypassed by using macros <strong>to</strong> generate VDFs ‘on-fly’ or by<br />
exporting the model ε 1 and ε 2 <strong>to</strong> a file.<br />
It worth mentioning that <strong>to</strong> handle VDF in the KK-constrained mode requires a lot of<br />
computational work and may significantly slow down the program. Therefore one should avoid<br />
the <strong>fit</strong>ting of unnecessary large datasets. On an average modern PC (at the moment of writing<br />
this manual it is Pentium 1.5-2.5 GHz) RefFIT manages easily with N ~ 1000 . Working with<br />
larger datasets would require some patience.<br />
4.7. Special models<br />
As was mentioned in section 4.5, special models are distinguished from the “Dielectric<br />
Function” model by a ‘code’, which is s<strong>to</strong>red in the parameter “Einf”. The table “Lorentzians”<br />
is used <strong>to</strong> s<strong>to</strong>re the model parameters, whose meaning depends solely on the model type. Also,<br />
the output quantities are different from the ones of the “Dielectric Function” model (even<br />
though the same abbreviations are used, as in Table 4-2). Special models often contain links <strong>to</strong><br />
other models.<br />
Table 4-5 lists special models and the corresponding codes. The detailed description of<br />
special models is presented in the subsequent sections.<br />
“Einf”<br />
(Code)<br />
Special model<br />
-1 Differential dielectric function (section 4.7.1)<br />
-2 Reflection and transmission of a multi-layer sample (section 4.7.2)<br />
-3 Ellipsometry of an orthorhombic sample (section 4.7.3)<br />
-4 Ellipsometry of an orthorhombic sample (differential model) (section 4.7.4)<br />
-5 Ellipsometry of an orthorhombic film on an orthorhombic substrate (section<br />
4.7.5)<br />
-6 Extended Drude model (section 4.7.6)<br />
Table 4-5 Special models.<br />
Guide <strong>to</strong> RefFIT Page 63
4.7.1. Differential dielectric function<br />
This model is intended <strong>to</strong> <strong>fit</strong> differential <strong>spectra</strong> of any quantity that can be generated by<br />
the “Dielectric function” model (section 4.6). The theoretical description of differential <strong>spectra</strong><br />
is presented in section 2.3.<br />
A model of the “Differential dielectric function” type combines the two models of the<br />
“Dielectric function” type. The first dielectric function is treated as a base model and the<br />
second one – as a differential model. The description of the parameters is given in Table 4-6.<br />
# Wo Wp G<br />
1 Base model # - -<br />
2 Differential model # - -<br />
Table 4-6 The meaning of the parameters of the “Differential dielectric function” model.<br />
The output quantities of this model are the differential analogs of the quantities,<br />
generated by the “Dielectric function” model (see Table 4-2). For instance, the quantity “S1” is<br />
the differential conductivity.<br />
The Figure 4-5 presents an example of the “Differential dielectric function” model. It is<br />
assumed here that the base DF is s<strong>to</strong>red in the “Model2” and the differential DF is in “Model3”.<br />
Note that all parameters of the “Model1” are fixed. The output quantity “R” of the “Model1”<br />
will correspond <strong>to</strong> the differential reflectivity ∆ R , “T” will correspond <strong>to</strong> the differential<br />
transmission ∆ T and so forth.<br />
Figure 4-5 An example of the “Differential dielectric function” model.<br />
Usually the <strong>fit</strong>ting of differential <strong>spectra</strong> is done in two steps. On the first step the base<br />
model is adjusted <strong>to</strong> <strong>fit</strong> the base <strong>spectra</strong>. On the second step all the parameters of the base<br />
model are fixed and the differential model is adjusted <strong>to</strong> <strong>fit</strong> the differential <strong>spectra</strong>. Note that<br />
the internal parameters of the base model should be fixed on the second step.<br />
4.7.2. Reflection and transmission of a multi-layer sample<br />
This model has been designed <strong>to</strong> <strong>fit</strong> the normal-incidence reflection and transmission<br />
<strong>spectra</strong> of samples that consist of an arbitrary number of layers (Figure 4-6). Each layer is<br />
supposed <strong>to</strong> be isotropic and described by its own complex dielectric functionε , thickness d<br />
and thickness spread δ d .<br />
Guide <strong>to</strong> RefFIT Page 64
Iinc<br />
Itrans<br />
ε<br />
ε<br />
( 1)<br />
( 2)<br />
…<br />
(n)<br />
ε<br />
Iref<br />
d1±δd1<br />
d2±δd2<br />
dn±δdn<br />
Figure 4-6 The experimental configuration of the model “Reflection and transmission of a multi-layer sample”.<br />
The sample reflectivity is defined as R = I ref / I inc , transmission is defined as<br />
T = I trans / I inc , where I inc is the intensity of the incident light, I ref - intensity of the reflected<br />
light and I trans - intensity of the transmitted light. The exact formulas for R and T are rather<br />
cumbersome; they can be found, for instance, in Ref. [14].<br />
The parameters of this model are described in Table 4-7. The number of layers is given<br />
by the number of rows in the “Lorentzians” table. Each row corresponds <strong>to</strong> a particular layer.<br />
# Wo Wp G<br />
1 DF model (layer #1) Thickness d (layer #1) [cm] Relative thickness spread δd/d<br />
(layer #1)<br />
2 DF model (layer #2) Thickness d (layer #2) [cm] Relative thickness spread δd/d<br />
(layer #2)<br />
… … … …<br />
N DF model (layer #n) Thickness d (layer #n) [cm] Relative thickness spread δd/d<br />
(layer #n)<br />
Table 4-7 The parameters of the model “Reflection and transmission of a multi-layer sample”.<br />
An example of this of kind of model window is shown in Table 4-6. Here a two-layer<br />
system (film-substrate) is modeled. The <strong>to</strong>p layer (film) is described by the dielectric function<br />
from “Model2”; it has a thickness of 1.76e-6 cm (17.6 nm) and relative thickness spread of 1%.<br />
The substrate is described by the dielectric function from “Model3” and it is 0.057 cm (570<br />
micron) thick with a relative spread of 3%. Note that the film thickness is treated as a variable<br />
parameter (marked blue).<br />
Guide <strong>to</strong> RefFIT Page 65
Figure 4-7 An example of the model “Reflection and transmission of a multi-layer sample”.<br />
There are only two output quantities, calculated by this model. Output “R” corresponds <strong>to</strong><br />
the reflectivity and output “T” corresponds <strong>to</strong> the transmission.<br />
It saves a lot of computational time <strong>to</strong> set the thickness spread <strong>to</strong> zero unless it is really<br />
necessary <strong>to</strong> model a wedged sample.<br />
4.7.3. Ellipsometry of an orthorhombic sample<br />
This model is designed <strong>to</strong> <strong>fit</strong> the ellipsometric measurements done on an anisotropic<br />
semi-infinite sample. Of course, it can be also used (as the simplest case) for an isotropic<br />
sample. The experimental geometry, including the orientation of principal dielectric tensor<br />
axes, is shown in Figure 4-8.<br />
Figure 4-8 The experimental configuration of the model “Ellipsometry of an orthorhombic sample”.<br />
As this manual is not an ellipsometry textbook, we present only the formulas used. The<br />
complex reflectivities for the p- and s-polarized light are:<br />
r<br />
p<br />
s<br />
E inc<br />
p<br />
E inc<br />
ε y<br />
θ p<br />
Eref<br />
ε z<br />
2<br />
sin θ<br />
p 1−<br />
− ε x cosθ<br />
s<br />
2<br />
Eref<br />
ε<br />
E cosθ<br />
− ε − sin θ<br />
z<br />
ref<br />
y<br />
≡ =<br />
and r p<br />
s ≡ =<br />
.<br />
E<br />
2<br />
s<br />
2<br />
inc sin θ<br />
Einc<br />
cosθ<br />
+ ε y − sin θ<br />
1−<br />
+ ε x cosθ<br />
ε<br />
z<br />
ε x<br />
s<br />
Eref<br />
Guide <strong>to</strong> RefFIT Page 66
In ellipsometry the complex ratio ρ = r p / rs<br />
is measured, commonly expressed in terms<br />
i∆<br />
of the two real parameters ψ and ∆ : ρ = tan ψe<br />
. The inversion of this formula gives<br />
ψ = arctan ρ and ∆ = arg ρ .<br />
The pseudo-dielectric function is defined as:<br />
ε pseudo<br />
2<br />
⎡<br />
⎤<br />
2<br />
2 ⎛1<br />
+ ρ ⎞<br />
= sin θ ⎢1<br />
+ tan θ⎜<br />
⎟ ⎥ .<br />
⎢⎣<br />
⎝1<br />
− ρ ⎠ ⎥⎦<br />
In the case of an isotropic sample the ε pseudo coincides with the true dielectric function ε .<br />
One of the possible ellipsometry configurations involves a fixed polarizer (at angle P )<br />
and a rotating analyzer (without a retarder). In this case the Fourier coefficients of the detec<strong>to</strong>r<br />
signal as functions of the analyzer angle are:<br />
2<br />
2<br />
tan ψ − tan P 2 tanψ<br />
cos ∆ tan P<br />
α =<br />
, β =<br />
.<br />
2<br />
2<br />
2<br />
2<br />
tan ψ + tan P tan ψ + tan P<br />
The description of the model parameters is given in Table 4-8.<br />
# Wo Wp G<br />
1 DF model for εx θ [degrees] P [degrees]<br />
2 DF model for εy - -<br />
3 DF model for εz - -<br />
Table 4-8 The parameters of the model “Ellipsometry of an orthorhombic sample”.<br />
An example of such a model is shown in Figure 4-9. It is assumed that the “Model2”<br />
containsε x , the “Model3” contains ε y and “Model4” contains ε z . The angle of incidence is<br />
80 o and the polarizer angle is 45 o .<br />
To imitate the isotropic sample, one should assign the dielectric components ε x , ε y and<br />
ε z may <strong>to</strong> the same model. For a uniaxial crystal two of the three components should refer <strong>to</strong><br />
the same “Dielectric function” model.<br />
Figure 4-9 An example of the model “Ellipsometry of an orthorhombic sample”.<br />
Guide <strong>to</strong> RefFIT Page 67
Table 4-9 describes the meaning of the output quantities. Note again, that quantity<br />
abbreviations here have no meaning whatsoever.<br />
Quantity<br />
abbreviation<br />
Description<br />
“E1” ψ [degrees]<br />
“E2” ∆ [degrees]<br />
“S1” α<br />
“S2” β<br />
“N1” Re ε pseudo<br />
“N2” Im ε pseudo<br />
Table 4-9 The output quantities of the model “Ellipsometry of an orthorhombic sample”.<br />
4.7.4. Differential ellipsometry of an orthorhombic sample<br />
This model is the ‘differential’ extension of the model “Ellipsometry of an orthorhombic<br />
sample”. The details about differential models are given in section 2.3.<br />
The description of the model parameters is given in Table 4-8.<br />
# Wo Wp G<br />
1 The base model for ε x The differential model for ε x θ [degrees]<br />
2 The base model for ε y The differential model for ε y P [degrees]<br />
3 The base model for ε z The differential model for ε z -<br />
Table 4-10 The parameters of the model “Differential ellipsometry of an orthorhombic sample.<br />
The output quantities are the differential versions of quantities listed in Table 4-9.<br />
4.7.5. Ellipsometry of an orthorhombic film on an orthorhombic substrate<br />
This model is an extension of the ellipsometry <strong>to</strong> the double-layer system, like a film on a<br />
substrate (Figure 4-10). The symmetry of both film and substrate dielectric tensors can be as<br />
low as orthorhombic. The substrate is treated as a semi-infinite one.<br />
Guide <strong>to</strong> RefFIT Page 68
`<br />
Figure 4-10 The experimental configuration of the model “Ellipsometry of an orthorhombic film on an<br />
orthorhombic substrate”.<br />
All the formulas are the same as for the model “Ellipsometry of an orthorhombic<br />
Sample” (section 4.7.3), except the ones for r p and r s , which are a bit more lengthy:<br />
r<br />
r<br />
p<br />
0 f<br />
p<br />
fs<br />
rp<br />
t<br />
s<br />
E inc<br />
p<br />
p<br />
E inc<br />
f<br />
ε y<br />
s<br />
ε y<br />
of<br />
rp<br />
+ t r<br />
=<br />
1+<br />
t<br />
θ p<br />
Eref<br />
fs<br />
p p<br />
of fs<br />
pr<br />
p rp<br />
z<br />
f<br />
ε z<br />
s<br />
ε z<br />
of fs<br />
rs<br />
+ t srs<br />
, rs<br />
= , where<br />
of fs<br />
1+<br />
t r r<br />
s<br />
s<br />
s<br />
2<br />
sin θ f<br />
1−<br />
− ε cosθ<br />
f<br />
x<br />
f 2<br />
ε<br />
cosθ<br />
− ε − sin θ<br />
z<br />
0 f<br />
y<br />
= , r s =<br />
,<br />
2<br />
f 2<br />
sin θ f<br />
cosθ<br />
+ ε y − sin θ<br />
1−<br />
+ ε x cosθ<br />
f<br />
ε<br />
2<br />
2<br />
f sin θ s sin θ<br />
ε x 1−<br />
− ε<br />
s<br />
x 1−<br />
f<br />
ε z<br />
ε z<br />
= ,<br />
2<br />
2<br />
f sin θ s sin θ<br />
ε x 1−<br />
+ ε x 1−<br />
ε<br />
ε<br />
⎪⎧<br />
2<br />
⎪⎫<br />
f sin θ<br />
= ⎨4πiωd<br />
ε x 1−<br />
f ⎬<br />
⎪⎩<br />
ε z ⎪⎭<br />
s<br />
z<br />
f<br />
z<br />
fs<br />
r s<br />
f 2<br />
ε − sin θ −<br />
f 2<br />
ε − sin θ +<br />
f 2<br />
exp , s = exp{ 4πiωd<br />
ε y − sin θ }<br />
s<br />
ε − sin<br />
s<br />
ε − sin<br />
Guide <strong>to</strong> RefFIT Page 69<br />
=<br />
y<br />
y<br />
t , d is the thickness of<br />
the <strong>to</strong>p layer (measured in cm), ω is the light frequency (measured in cm -1 ).<br />
The description of the model parameters is given in Table 4-11.<br />
# Wo Wp G<br />
1 DF model for ε θ [degrees] P [degrees]<br />
f<br />
x<br />
f<br />
ε x<br />
s<br />
ε x<br />
s<br />
Eref<br />
d<br />
y<br />
y<br />
2<br />
2<br />
θ<br />
θ
2 f<br />
The model for ε d [cm] -<br />
y<br />
3 f<br />
The model for ε z<br />
- -<br />
4 The model for ε - -<br />
5 s<br />
The model for ε y<br />
- -<br />
6 s<br />
The model for ε z<br />
- -<br />
s<br />
x<br />
Table 4-11 The parameters of the model “Ellipsometry of an orthorhombic film on an orthorhombic substrate”.<br />
An example of such a model is shown in Figure 4-11. It is assumed that the “Model2”,<br />
“Model3” and “Model4” describe the x, y and z components respectively of the film dielectric<br />
tensor. The substrate is uniaxial with the symmetry axis z, normal <strong>to</strong> the sample surface. The x-<br />
and y-components of the substrate dielectric tensor are described by the “Model5”, the zcomponent<br />
is given by the “Model6”. The angle of incidence is 70 o , the angle of polarizer is<br />
45 o and the film thickness 0.000532 cm (5.32 micron).<br />
Figure 4-11 An example of the model “Ellipsometry of an orthorhombic film on an orthorhombic substrate”.<br />
4.7.6. Extended Drude<br />
This model takes as an input a dielectric function ε (ω)<br />
given by some dielectric function<br />
model and converts it <strong>to</strong> the frequency-dependent scattering rate 1/ τ ( ω)<br />
and the normalized<br />
*<br />
frequency-dependent effective mass m ( ω ) / m according <strong>to</strong> the formulas:<br />
2<br />
1 ω p ⎛ 1 ⎞<br />
= − Im ⎜<br />
⎟ , ∞<br />
τ ( ω)<br />
ω ⎝ ε ( ω)<br />
− ε ⎠<br />
*<br />
m ( ω)<br />
m<br />
2<br />
ω p ⎛ 1 ⎞<br />
− Re ⎜<br />
⎟ .<br />
2<br />
ω ⎝ ε ( ω)<br />
− ε ⎠<br />
= ∞<br />
Guide <strong>to</strong> RefFIT Page 70
Here ω p and ∞<br />
ε are considered as parameters of the extended Drude model (note, that they<br />
have nothing <strong>to</strong> do with the parameters of the model, which calculates ε (ω)<br />
). In addition<br />
*<br />
another ‘scattering rate’ 1/<br />
τ ( ω)<br />
is calculated:<br />
⎛ 1 ⎞<br />
ω Im<br />
1<br />
⎜<br />
ε ( ω)<br />
ε ⎟ ∞<br />
⎝ − 1/<br />
τ ( ω)<br />
=<br />
⎠<br />
= .<br />
*<br />
*<br />
τ ( ω)<br />
⎛ 1 ⎞ m ( ω)<br />
/ m<br />
Re ⎜<br />
ε ( ω)<br />
ε ⎟ ∞<br />
⎝ − ⎠<br />
*<br />
Note, that 1/<br />
τ ( ω)<br />
does not depend on the parameter ω p .<br />
The description of the model parameters is given in Table 4-12.<br />
# Wo Wp G<br />
1 The model for (ω)<br />
ω [cm -1 ] ∞<br />
ε<br />
ε p<br />
Table 4-12 The model parameters of the model “Extended Drude”.<br />
Table 4-13 describes the meaning of the output quantities.<br />
Quantity<br />
abbreviation<br />
Description<br />
“R” 1/ τ ( ω)<br />
[cm -1 ]<br />
“T” *<br />
m ( ω ) / m<br />
“Rp” 1/<br />
( )<br />
* -1<br />
τ ω [cm ]<br />
Table 4-13 The output quantities of the model “Extended Drude”.<br />
Figure 4-12 gives an example of the extended Drude model. The complex value of ε (ω)<br />
is taken from “Model 2”, ω p = 12000 cm -1 and ∞<br />
ε = 3.6.<br />
Figure 4-12 An example of the model “Extended Drude”<br />
4.8. Dataset manager<br />
The dataset manager is used <strong>to</strong> load, assign, s<strong>to</strong>re and unload experimental datasets. To<br />
activate this window one should choose the “Dataset manager” item from the “Window” menu<br />
Guide <strong>to</strong> RefFIT Page 71
(Figure 3-8). Using this window one can load up <strong>to</strong> 10 independent datasets at the same time.<br />
One can s<strong>to</strong>re more of them, using the macro language (see section 4.11.4).<br />
To close the “Dataset Manager” window you can either click the or<br />
but<strong>to</strong>n. Closing this window helps <strong>to</strong> save the screen space but does not cause unloading of<br />
datasets.<br />
4.8.1. Loading and unloading datasets<br />
In order <strong>to</strong> load a dataset <strong>to</strong> a certain slot, one should click the but<strong>to</strong>n. An extra<br />
window will show up, where you can specify the way the data should be loaded <strong>to</strong> the RefFIT<br />
memory. Each dataset is a table, which consists of three columns: X, Y and Yerr. The X is the<br />
light frequency (in cm -1 ), the Y is the measured <strong>optical</strong> quantity (e.g., reflectivity) and the Yerr<br />
is the error bar.<br />
Figure 4-13 The dataset manager window.<br />
One should always specify the master data file. It must contain at least two columns: X<br />
and Y. Optionally it may have third column Yerr. The fastest way is <strong>to</strong> take X, Y and Yerr from<br />
the master file. If Yerr is missing, a default value (=0.01) will be put.<br />
The data file should be a plain (ANSI) text file. Do not use special text encodings, like<br />
UNICODE. The columns in the data file have <strong>to</strong> be separated by the space character “ “ or the<br />
tabulation character. Do not use commas, semicolons etc.<br />
Sometimes, it is convenient <strong>to</strong> have different frequency points in the dataset. For<br />
instance, if you load reflection and transmission file, which are measured with different<br />
frequency points, you might still want <strong>to</strong> have two datasets with the same frequency points. In<br />
this case there two options. Firstly, you may provide an extra file with only one column – X,<br />
which will serve as a source of frequency points. Secondly, you may generate your own grid of<br />
frequency points by specifying the interval in the fields “Xmin” and “Xmax”, the number of<br />
Guide <strong>to</strong> RefFIT Page 72
points “#pts” and the grid type (linear or logarithmic). For a linear grid all the frequencies are<br />
equally spaced. For a logarithmic grid the logarithms of frequencies are equally spaced. The<br />
latter grid is useful, if you have more structures in the low-frequency part of your spectrum<br />
than in the high-frequency part. The conversion from the original frequency grid <strong>to</strong> the new one<br />
is done by a linear interpolation method.<br />
In the majority of cases the Y-column is taken from the master file. However, there is a<br />
possibility <strong>to</strong> set Y <strong>to</strong> a fixed (constant) value.<br />
Ideally the error bars should be provided in the master file. Proper error bars always<br />
improve the <strong>fit</strong>ting reliability. There is an option <strong>to</strong> load error bars from a separate file, or set it<br />
<strong>to</strong> a fixed (constant) value. Never set it <strong>to</strong> zero, because it will cause the “division by zero”<br />
error!<br />
Having chosen the right loading options click the but<strong>to</strong>n. Once you have loaded<br />
the data set you must specify its type. The dataset types should correspond <strong>to</strong> one of the model<br />
output types (see Table 4-2). You can choose the type from the list in the “Quantity” column.<br />
By default, the program determines the data type looking at the first letters of the file name. For<br />
instance, RefFIT will suggest type “PD” (Penetration depth) for the filename<br />
“PD_T300K.DAT”.<br />
There is an extra possibility <strong>to</strong> cut the <strong>spectra</strong>l range <strong>to</strong> a subset that will be used for<br />
<strong>fit</strong>ting. To do this you may specify the limits of the “Cutting range”. The corresponding number<br />
of frequency points will be highlighted in the field “# points”.<br />
To unload a dataset click the but<strong>to</strong>n. To unload all the datasets at once, click the<br />
4.9. Graphs<br />
but<strong>to</strong>n in the lower part of the window.<br />
Graphs in RefFIT serve <strong>to</strong> visualize the model and experimental data and update their<br />
changes in real time. Each graph is shown in a separate window (Figure 4-14). A new graph<br />
can be created by choosing “Graph” in the “Window” menu. Closing the graph window<br />
destroys the graph as an object.<br />
One can specify graph properties, such as axis scale, title etc., and graph contents, such as<br />
the set of curves and their appearance on the screen.<br />
Guide <strong>to</strong> RefFIT Page 73
Figure 4-14 The “Graph” window.<br />
4.9.1. Graph properties<br />
To set the graph properties, one should double-click on the gray (outer) area of the graph<br />
(Figure 4-14). The window “Graph properties” will pop up (Figure 4-15). Here one can change<br />
the properties of the “X” and “Y” axes. It is only necessary <strong>to</strong> set the range. The tick step will<br />
be determined au<strong>to</strong>matically according <strong>to</strong> the graph size. The default value for the “Y” axis is<br />
“Reflectivity” which should be changed if other <strong>spectra</strong> will be plotted (e.g., conductivity) in<br />
order <strong>to</strong> avoid confusions. This, however, does not influence the <strong>fit</strong>ting procedure. One can<br />
save a bit of the graph space by not showing axis titles.<br />
Figure 4-15 The “Graph properties” window<br />
By default, all the loaded dataset points are plotted. However, one can show only the data<br />
points which are used for <strong>fit</strong>ting (specified in the “cutting range” in the dataset manager) by<br />
checking the “show only <strong>fit</strong>ted data points” option.<br />
Guide <strong>to</strong> RefFIT Page 74
4.9.2. Graph contents<br />
To set the graph contents, one should double-click on the white (inner) area of the graph<br />
(Figure 4-14). In the window “Graph contents” (Figure 4-16) one can select the curves <strong>to</strong> show<br />
in the graph and specify their appearance.<br />
Figure 4-16 The “Graph contents” window.<br />
It is possible <strong>to</strong> plot five types of curves: “DATA”, “MODEL”, “CHI-SQ”, “MULTI”<br />
and “FREQ”.<br />
The curves of the “DATA” type represent experimental <strong>spectra</strong>, loaded as datasets (see<br />
section 4.8). They can be plotted either as symbols of different shape and size, as lines, as error<br />
bars, or as a combination of these.<br />
The “MODEL” type corresponds <strong>to</strong> model output quantities (transmission, conductivity<br />
etc.). Model curves are always continuous.<br />
A curve of the “CHI-SQ” type shows the square of the difference between experimental<br />
and model <strong>spectra</strong> (chi-square). It is used <strong>to</strong> estimate the <strong>fit</strong>ting match. It is this value, which is<br />
minimized in the <strong>fit</strong>ting procedure (see section 2.1.2).<br />
The “MULTI” type is used <strong>to</strong> show the contribution of all Lorentz oscilla<strong>to</strong>rs, included in<br />
the model, separately. Obviously, it applies only <strong>to</strong> the Drude-Lorentz model type and only <strong>to</strong><br />
the additive quantities, such as the outputs “E1”, “E2”, “S1” and “S2” of the “Dielectric<br />
function” model.<br />
The “FREQ” is a special curve type, which indicates the transverse frequencies of the<br />
Lorentz oscilla<strong>to</strong>rs in a form of dashed vertical lines.<br />
In order <strong>to</strong> specify the curves <strong>to</strong> be plotted one should first check the corresponding<br />
but<strong>to</strong>ns in the groups “Curve type” and “Quantity”. The full list of available curves, according<br />
<strong>to</strong> these but<strong>to</strong>ns will be shown in the “Available curves” section. The next step is <strong>to</strong> select some<br />
curves from this list (using the mouse, possibly in combination with the CTRL and SHIFT<br />
keys) and move them <strong>to</strong> the list “Graph curves” by clicking the but<strong>to</strong>n. In order <strong>to</strong> remove<br />
curves from the “Graph curves” list one should select them and click the but<strong>to</strong>n.<br />
Guide <strong>to</strong> RefFIT Page 75
The graph curves appearance can be adjusted using the controls from the ‘Curve<br />
properties’ part. One should select one curve and change its properties, then switch <strong>to</strong> another<br />
one and repeat the procedure and so on. It is possible <strong>to</strong> select a group of curves and modify<br />
their properties. Each curve can be shifted or/and scaled, if necessary, in order <strong>to</strong> be better seen<br />
on the graph.<br />
To apply the specified graph contents curves one should press but<strong>to</strong>n or .<br />
In the latter case the changes will be applied without closing the “Graph Contents” window.<br />
4.10. Fit window<br />
The “Fit” window is activated by the “Fit” item from the “Window” menu (Figure 4-17).<br />
It is used <strong>to</strong> set the <strong>fit</strong>ting task, launch/s<strong>to</strong>p the au<strong>to</strong>mated <strong>fit</strong>ting routine and moni<strong>to</strong>r the <strong>fit</strong>ting<br />
progress. The closing of this window does not change the <strong>fit</strong>ting task (section 4.10.1) and<br />
<strong>fit</strong>ting options (section 4.10.2).<br />
Figure 4-17 The “Fit” window.<br />
4.10.1. Setting up the <strong>fit</strong>ting task<br />
The posing of the <strong>fit</strong>ting task is essentially the setting the chi-square terms <strong>to</strong> be<br />
minimized (see section 2.1, Equation 2-11, Equation 2-12). Each chi-square term is specified<br />
by a pair “Dataset-Model”. By including such a pair you tell RefFIT which model has <strong>to</strong> be<br />
<strong>fit</strong>ted <strong>to</strong> which dataset.<br />
It is important, that one can select many chi-square terms simultaneously, which allows<br />
<strong>fit</strong>ting several <strong>spectra</strong> of different type at the same time. There is a full freedom <strong>to</strong> specify any<br />
combinations of Dataset-Model pairs!<br />
Initially there are no chi-square terms in the <strong>fit</strong>ting task (Figure 4-17). To add them, one<br />
should press the but<strong>to</strong>n. In the window ”Add ChiSq terms” (Figure 4-18) one can select<br />
Guide <strong>to</strong> RefFIT Page 76
Available ChiSq terms and click the (using field “Model” and “Dataset” helps <strong>to</strong><br />
narrow the list). After that the new terms will show up in the “Fit” window (Figure 4-19).<br />
Figure 4-18 The “Add ChiSq term(s)” window.<br />
To remove chi-square terms one should select them in the list and press the but<strong>to</strong>n<br />
(Figure 4-19). By default, all terms have the same weight w equal <strong>to</strong> 1. To change the weight,<br />
one should select the corresponding term(s) and type the new weight in the “Weight” field.<br />
Figure 4-19 The “Fit” window with one chi-square term selected.<br />
The values of the individual chi-square terms and the <strong>to</strong>tal chi-square value (considering<br />
term weights) are always seen in the “Fit” window. They are updated in real time as the model<br />
parameters are changed manually, or au<strong>to</strong>matically.<br />
The number of <strong>fit</strong> points and parameters is derived on the base of the chi-square terms.<br />
Only the points in the cutting range of the Dataset are considered by the <strong>fit</strong>ting routine.<br />
Guide <strong>to</strong> RefFIT Page 77
4.10.2. Fitting options<br />
There is a possibility <strong>to</strong> set up the technical parameters, which regulate the flow of the<br />
<strong>fit</strong>ting process. To do this one should click the but<strong>to</strong>n in the “Fit” window (Figure<br />
4-19). The dialog window “Fitting options” will show up (Figure 4-20).<br />
Figure 4-20 The “Fitting options” window.<br />
To use these options requires the knowledge of the Levenberg-Marquardt algorithm,<br />
described in section 2.1.1. However, in most cases the default settings work reasonably well.<br />
The first set of parameters (“S<strong>to</strong>p <strong>fit</strong>ting after”) define the criteria <strong>to</strong> terminate the <strong>fit</strong>ting<br />
process. The following criteria can be applied:<br />
(i) a certain maximum number of iterations is exceeded;<br />
(ii) the <strong>fit</strong>ting takes <strong>to</strong>o much time;<br />
(iii) the process seems <strong>to</strong> converge, i.e., the <strong>to</strong>tal chi-square did not vary significantly<br />
during the last few iterations;<br />
(iv) one of the parameters goes out of range 20 ;<br />
(v) the linearity parameter λ becomes <strong>to</strong>o large.<br />
The group “Confidence limits” deals with the calculation of the parameter confidence<br />
limits, or error bars (see section 2.1.3). One can force RefFIT <strong>to</strong> calculate them after each<br />
<strong>fit</strong>ting iteration. This may slightly slow down the <strong>fit</strong>ting process. The value in the “DeltaChiSq”<br />
2<br />
corresponds <strong>to</strong> δχ in Equation 2-14.<br />
By default, all <strong>spectra</strong> and parameters are updated on the screen after each iteration. In<br />
order <strong>to</strong> save some time it is possible <strong>to</strong> let the program <strong>to</strong> update the screen not so often by<br />
changing the field “Update screen every … iteration(s)” 21 .<br />
20 This option is not realized yet<br />
Guide <strong>to</strong> RefFIT Page 78
At each iteration a linear equation system with the α -matrix is solved (Equation 2-9). It<br />
becomes impossible when the determinant of the matrix is getting <strong>to</strong>o small. This happens, for<br />
instance, if one of the active parameters does not affect the value of chi-square. In this case the<br />
iterations s<strong>to</strong>p. One can specify the minimal allowed value of the determinant, which is by<br />
default 10 -30 .<br />
The initial value of λ can also be modified (the default value is 0.001).<br />
4.10.3. Starting/s<strong>to</strong>pping <strong>fit</strong>ting process<br />
To start the au<strong>to</strong>mated <strong>fit</strong>ting one should click the but<strong>to</strong>n (Figure 4-19). Only a<br />
very limited set of actions is allowed when the <strong>fit</strong> is running (e.g., one can resize the windows).<br />
The process can be s<strong>to</strong>pped by the same but<strong>to</strong>n, which is now looks as . It may take some<br />
time before the program really s<strong>to</strong>ps, because it must complete the current iteration.<br />
During the <strong>fit</strong>ting process the following quantities are displayed: the current value of this<br />
chi-square, its absolute change compared <strong>to</strong> the initial value, the number of iterations and<br />
elapsed <strong>fit</strong>ting time.<br />
In order <strong>to</strong> recover the previous parameter values before the last <strong>fit</strong>ting started, one<br />
should click the but<strong>to</strong>ns 22 . It is only possible right after the <strong>fit</strong>ting run.<br />
4.11. Macro language<br />
Once you have found a good data <strong>fit</strong>, you may need <strong>to</strong> do the same task many times, for<br />
instance, <strong>to</strong> <strong>fit</strong> the same kind of <strong>spectra</strong> for different temperatures. Each case, however,<br />
involves an appreciable number of actions, such as opening a model, loading data, adding chisquare<br />
terms and so forth. Imagine, how many mouse clicks have <strong>to</strong> be done <strong>to</strong> <strong>fit</strong> <strong>spectra</strong> for,<br />
let’s say, 10 temperatures! And what about 300 temperatures?!!!<br />
To facilitate the execution of routine operation the macro scripts are indispensable.<br />
Another advantage of scripts is the possibility <strong>to</strong> modify them in order <strong>to</strong> tackle new problems,<br />
which are similar <strong>to</strong> the ones already solved. Also, a script may serve as a sort of logbook,<br />
which helps <strong>to</strong> recollect, how exactly a particular data analysis has been performed a long time<br />
ago.<br />
4.11.1. Writing and executing macros<br />
Macro scripts are s<strong>to</strong>red as text files, which can be created and modified using any text<br />
edi<strong>to</strong>r such as Windows Notepad. Make sure, that the file is saved as a usual, or ANSI, text<br />
(and not, for example, as UNICODE text). The convention is (although it is not obliga<strong>to</strong>ry) <strong>to</strong><br />
use the extension ‘RFS’ <strong>to</strong> macro files, for instance “MACRO1.RFS”.<br />
Once a macro is created, it can be executed at the stage when RefFIT starts. One should<br />
call the RefFIT program supplemented with the macro file name, for example<br />
“D:\REFFIT\REFFIT.EXE MACRO1.RFS”. In this case the executable file “REFFIT.EXE”<br />
21 The screen update time is usually only a minor fraction of the <strong>to</strong>tal computing activity.<br />
22 this option is not realized yet<br />
Guide <strong>to</strong> RefFIT Page 79
should be in the direc<strong>to</strong>ry “D:\REFFIT” and the macro file “MACRO1.RFS” should be in the<br />
currently selected direc<strong>to</strong>ry.<br />
There are several ways <strong>to</strong> launch the RefFIT program with a script name. The most<br />
universal one (though not the most handy) is <strong>to</strong> create a batch file, called, e.g.,<br />
“MACRO1.BAT”, which contains only one command line “D:\REFFIT\REFFIT.EXE<br />
MACRO1.RFS”. It can be done using the same edi<strong>to</strong>r program, like Notepad (Figure 4-21).<br />
The execution of “MACRO1.BAT” (e.g., by clicking on it in the Windows Explorer) will have<br />
the desired effect.<br />
Figure 4-21 The batch file <strong>to</strong> start macro “MACRO1.RFS”.<br />
Scripts can be called more comfortably by just double-clicking on the icons of their files.<br />
For that one should associate the file extension “RFS” with the executable “REFFIT.EXE”. It<br />
can be done, for instance, in the standard Windows Explorer program by clicking on a macro<br />
file with the right mouse but<strong>to</strong>n, selecting item “Open With”→”Choose program” and then<br />
specifying the actual path <strong>to</strong> “REFFIT.EXE”.<br />
4.11.2. Macro syntax<br />
The RefFIT macro syntax is extremely simple. Macro scripts consist of commands,<br />
separated by semicolon “;”. It is a good idea (although not imperative) <strong>to</strong> write each command<br />
on a separate line. Commands correspond <strong>to</strong> actions done by the mouse or the keyboard in the<br />
application windows.<br />
The command syntax is as follows: “CommandName(Par1 = Value1, Par2 = Value2,<br />
…);” The CommandName identifies the command. “Par1”, “Par2” etc. are the names of<br />
parameters; “Value1”, “Value2” etc. are their values. The parameters should be separated by<br />
commas “,”. The set of parameters depends, of course, on the command. In some cases certain<br />
parameters might be omitted. Even if no parameters are set in the command, the command<br />
name must be followed by empty brackets “()”. The sequence of parameters in brackets does<br />
not matter.<br />
The parameters can be of integer, double or text type. The integer parameter value can be<br />
any integer number, e.g., 10. The double parameter value can be any double (floating point)<br />
number, e.g., 1.23E-4. The text parameter value should be a text string, enclosed in parentheses<br />
“…”, e.g., “CONDUCTIVITY”.<br />
Any command preceded by the “#” character is ignored by the macro interpreter. This<br />
can be used <strong>to</strong> put text comments in<strong>to</strong> the macro, or temporarily ‘comment out’ some<br />
commands.<br />
Guide <strong>to</strong> RefFIT Page 80
Before a macro is actually executed, it is first translated by the macro interpreter. If the<br />
interpreter finds any kind of error, the execution does not start. Unfortunately, at this moment<br />
the interpreter is not programmed <strong>to</strong> make any error report. If a macro does not run, the easiest<br />
way <strong>to</strong> localize the error is <strong>to</strong> comment out potentially erroneous commands one by one and try<br />
the macro again.<br />
4.11.3. General macro commands<br />
Command name: MainWindow<br />
Description: Moves, resizes and renames the main application window.<br />
Parameters:<br />
Name Type Description What if omitted<br />
XPos Integer Horizontal position of the left side (in Window is neither<br />
screen pixels)<br />
moved nor resized<br />
YPos Integer Vertical position of the <strong>to</strong>p side (in Window is neither<br />
screen pixels)<br />
moved nor resized<br />
Width Integer Window width (in screen pixels) The window is moved<br />
but the width is not<br />
changed<br />
Height Integer Window height (in screen pixels) The window is moved<br />
but the height is not<br />
changed<br />
Title Text Window title The window title is not<br />
changed<br />
Command name: Wait<br />
Description: makes sure that the screen (i.e., parameters and model curves) is fully updated <strong>to</strong><br />
reflect the last parameter changes and then waits the specified amount of time.<br />
Note: this is a ‘technical’ command, which has absolutely no influence on the data and <strong>fit</strong>ting<br />
process.<br />
Parameters:<br />
Name Type Description What if omitted<br />
Time Integer The extra time <strong>to</strong> wait (in<br />
Assumed <strong>to</strong> be 0<br />
milliseconds)<br />
Command name: Suspend<br />
Description: suspends the macro execution and shows a “Suspend” window (Figure 4-22),<br />
which allows a user <strong>to</strong> choose whether <strong>to</strong> continue or s<strong>to</strong>p macro execution.<br />
Note: It is useful, when the macro works in a cycle and the <strong>fit</strong>ting match has <strong>to</strong> be visually<br />
verified on each step of the cycle.<br />
Guide <strong>to</strong> RefFIT Page 81
Figure 4-22 The “Suspend” window.<br />
Parameters: no parameters<br />
Command name: Exit<br />
Description: terminates the execution of macro without going further.<br />
Note: this command is useful during the ‘debugging’ of the macro.<br />
Parameters:<br />
Name Type Description What if omitted<br />
QuitApp Integer If QuiteApp ≠ 0, then the application<br />
will be terminated also<br />
Assumed <strong>to</strong> be 0<br />
4.11.4. Dataset macro commands<br />
Command name: DatasetManager<br />
Description: shows the “Dataset Manager” window on the screen and sets its position<br />
Parameters:<br />
Name Type Description What if omitted<br />
XPos Integer Horizontal position of the left side (in The position is not<br />
screen pixels)<br />
changed<br />
YPos Text Vertical position of the <strong>to</strong>p side (in The position is not<br />
screen pixels)<br />
changed<br />
Command name: LoadDataset<br />
Description: loads a dataset<br />
Note: This command has the same effect as manual dataset loading (section 4.8). Even though<br />
not more than 10 datasets can be loaded manually in the dataset manager, up <strong>to</strong> 100 datasets<br />
can be loaded with this command.<br />
Parameters:<br />
Name Type Description What if omitted<br />
DatasetNo Integer Dataset number, corresponding <strong>to</strong> the<br />
slot number in the Dataset Manager.<br />
Starts from 1.<br />
Assumed <strong>to</strong> be 1<br />
Guide <strong>to</strong> RefFIT Page 82
Quantity Text Abbreviation of the quantity, which is<br />
ascribed <strong>to</strong> this dataset, e.g. “R”, “S1”<br />
etc. (see Table 4-2);<br />
MasterFile Text The name of the master file (including<br />
file path, if the file is not in the same<br />
direc<strong>to</strong>ry, as the macro file), i.e.<br />
“R.DAT”, or<br />
“C:\MYDATA\E2.DAT”, or<br />
“..\SPECTRA\N1.DAT”<br />
XMethod Integer Specifies the algorithm used <strong>to</strong><br />
generate column X in the database.<br />
=1: X is taken from the master file (1 st<br />
column)<br />
=2: X is taken from the extra file,<br />
according <strong>to</strong> parameter XFile<br />
=3: X is generated, according <strong>to</strong><br />
parameters Xmin, Xmax, XPts and<br />
XGrid<br />
XFile Text The name of the extra file, used <strong>to</strong><br />
generate column X (including file<br />
path, if the file is not in the same<br />
direc<strong>to</strong>ry, as the macro file). Only<br />
applies when XMethod=2.<br />
XMin Double The minimum value of the generated<br />
X Only applies, when XMethod=3.<br />
XMax Double The maximum generated X value.Only<br />
applies when XMethod=3.<br />
XPts Integer The number of the generated X values.<br />
Only applies when XMethod=3.<br />
XGrid Integer Specifies the grid type of the<br />
generated X values<br />
=1: linear grid (equally spaced values)<br />
=2: logarithmic grid<br />
YMethod Integer Specifies the algorithm used <strong>to</strong><br />
generate column Y in the dataset.<br />
=1: Y is taken from the master file (2 nd<br />
column)<br />
=2: Y is set <strong>to</strong> a constant value,<br />
according <strong>to</strong> parameter YVal<br />
YVal Double Specifies the constant value <strong>to</strong> be set<br />
<strong>to</strong> column Y. Only applies when<br />
YMethod=2.<br />
YErrMethod Integer Specifies the algorithm used <strong>to</strong><br />
generate column YErr in the dataset.<br />
=1: YErr is taken from the master file<br />
(3 rd column)<br />
Assumed <strong>to</strong> be “R” (i.e.<br />
reflectivity)<br />
Does not load any<br />
dataset<br />
Assumed <strong>to</strong> be 1<br />
No action is taken (if<br />
XMethod=2).<br />
Assumed <strong>to</strong> be 1.0<br />
Assumed <strong>to</strong> be 1000.0<br />
Assumed <strong>to</strong> be 1000<br />
Assumed <strong>to</strong> be 1<br />
Assumed <strong>to</strong> be 1<br />
Assumed <strong>to</strong> be 0.0<br />
Assumed <strong>to</strong> be 0.01<br />
Guide <strong>to</strong> RefFIT Page 83
=2: YErr is taken from the extra file,<br />
according <strong>to</strong> parameter YErrFile<br />
=3: YErr is set <strong>to</strong> a constant value,<br />
according <strong>to</strong> parameter YErrVal<br />
YErrFile Text The name of the extra file, used <strong>to</strong><br />
generate column YErr (including file<br />
path, if the file is not in the same<br />
direc<strong>to</strong>ry, as macro file). Only applies<br />
when YErrMethod=2.<br />
YErrVal Double Specifies the constant value <strong>to</strong> be set<br />
<strong>to</strong> column YErr. Only applies when<br />
YErrMethod=3.<br />
Sets YErr <strong>to</strong> be 0.01<br />
(constant value)<br />
Assumed <strong>to</strong> be 0.01<br />
Command name: UnloadDataset<br />
Description: unloads a dataset.<br />
Parameters:<br />
Name Type Description What if omitted<br />
DatasetNo Integer Dataset number, which corresponds <strong>to</strong><br />
the slot number in the Dataset<br />
Manager. Starts from 1.<br />
Assumed <strong>to</strong> be 1<br />
Command name: CutDataset<br />
Description: specifies the cutting range of the dataset, which is considered by the <strong>fit</strong>ting<br />
routine.<br />
Parameters:<br />
Name Type Description What if omitted<br />
DatasetNo Integer Dataset number, which corresponds <strong>to</strong><br />
the slot number in the Dataset<br />
Manager. Starts from 1.<br />
Assumed <strong>to</strong> be 1<br />
XMin Double The minimum value of the cutting<br />
range<br />
Xmin is not changed<br />
XMax Double The maximum value of the cutting<br />
range<br />
Xmax is not changed<br />
4.11.5. Model macro commands<br />
Command name: NewModel<br />
Description: Creates a new model; moves and resizes the model window.<br />
Note: when a new model is created, it is au<strong>to</strong>matically ascribed an identity number, which<br />
starts from 1 and increments for every new model. It can be seen in the window title, e.g.,<br />
model #5 has title “Model5”. This number is used by other commands <strong>to</strong> identify this model.<br />
Guide <strong>to</strong> RefFIT Page 84
Parameters:<br />
Name Type Description What if omitted<br />
XPos Integer Horizontal position of the left side (in The default value is<br />
screen pixels)<br />
assumed<br />
YPos Integer Vertical position of the <strong>to</strong>p side (in The default value is<br />
screen pixels)<br />
assumed<br />
Width Integer Window width (in screen pixels) The default value is<br />
assumed<br />
Height Integer Window height (in screen pixels) The default value is<br />
assumed<br />
Command name: SaveModel<br />
Description: Saves the specified model <strong>to</strong> a file.<br />
Note: This command is equivalent <strong>to</strong> using the F2 but<strong>to</strong>n in the “Model” window (section 4.5).<br />
Parameters:<br />
Name Type Description What if omitted<br />
ModelNo Integer The identity number of the model <strong>to</strong><br />
be saved<br />
Assumed <strong>to</strong> be 1<br />
File Text The name of the model file (including<br />
file path, if the file is not in the same<br />
direc<strong>to</strong>ry, as macro file), i.e.<br />
“MODEL1.RFM”, or<br />
“C:\MYDATA\MODEL1.RFM”, or<br />
“..\MODELS\MODEL2.RFM”<br />
No action is taken<br />
Command name: LoadModel<br />
Description: Loads a model from a file <strong>to</strong> the specified (already created) model.<br />
Note: This command has the same effect as using F3 but<strong>to</strong>n in the window ‘Model’ (section<br />
4.5). It does NOT create a new model in RefFIT, so the model with the specified identity<br />
number has <strong>to</strong> be already created with the NewModel command.<br />
Parameters:<br />
Name Type Description What if omitted<br />
ModelNo Integer Model identity number Assumed <strong>to</strong> be 1<br />
File Text The name of the model file (including<br />
file path, if the file is not in the same<br />
direc<strong>to</strong>ry, as macro file), i.e.<br />
“MODEL1.RFM”, or<br />
“C:\MYDATA\MODEL1.RFM”, or<br />
“..\MODELS\MODEL2.RFM”<br />
No action is taken<br />
Command name: SetModelParam<br />
Guide <strong>to</strong> RefFIT Page 85
Description: Sets the value and the <strong>fit</strong>ting activity of the specified model parameter<br />
Note: this command affects only one model parameter<br />
Parameters:<br />
Name Type Description What if omitted<br />
ModelNo Integer Model identity number No action is taken<br />
ParamName Text The name of the parameter.<br />
“Einf” - epsilon at infinity;<br />
“Wo” – transverse frequency;<br />
“Wp” – plasma frequency;<br />
“G” – linewidth.<br />
No action is taken<br />
LorNo Integer The number of the Lorenzian (starting No action is taken in<br />
from 1). It is ignored, if<br />
case ParamName =<br />
ParamName=”Einf”<br />
”Wo”, “Wp” or “G”<br />
Value Double The new value The current value of the<br />
parameter is unchanged<br />
FitActive Integer =0 – not active in <strong>fit</strong>ting (fixed) The current <strong>fit</strong>ting<br />
=1 – active in <strong>fit</strong>ting (free)<br />
activity of the<br />
parameter is unchanged<br />
Command name: CopyModelParam<br />
Description: Makes a (destination) parameter <strong>to</strong> be the exact copy of another (source)<br />
parameter.<br />
Note: it copies ALL characteristics of the parameter, including minimum and maximum limits<br />
(not only the value and the <strong>fit</strong>ting activity).<br />
Parameters:<br />
Name Type Description What if omitted<br />
DestModelNo Integer Identity number of the destination<br />
model<br />
No action is taken<br />
DestParamName Text The name of the destination<br />
parameter.<br />
“Einf” - epsilon at infinity;<br />
“Wo” – transverse frequency;<br />
“Wp” – plasma frequency;<br />
“G” – linewidth.<br />
No action is taken<br />
DestLorNo Integer The number of the destination No action is taken in<br />
Lorenzian (starting from 1). It is case DestParamName<br />
ignored, if<br />
DestParamName=”Einf”<br />
= ”Wo”, “Wp” or “G”<br />
SourceModelNo Integer Identity number of the source<br />
model<br />
No action is taken<br />
SourceParamName Text The name of the source parameter.<br />
“Einf” - epsilon at infinity;<br />
“Wo” – transverse frequency;<br />
No action is taken<br />
Guide <strong>to</strong> RefFIT Page 86
“Wp” – plasma frequency;<br />
“G” – linewidth.<br />
SourceLorNo Integer The number of the source<br />
Lorentian (starting from 1). It is<br />
ignored, if<br />
SourceParamName=”Einf”<br />
No action is taken in<br />
case<br />
SourceParamName =<br />
”Wo”, “Wp” or “G”<br />
Command name: FixAllModelParams<br />
Description: Makes all the parameters of the specified model not active in <strong>fit</strong>ting (fixed).<br />
Note: it is nice <strong>to</strong> use this command when one has <strong>to</strong> adjust a model using one set of data and<br />
then <strong>to</strong> use it for other purposes without <strong>fit</strong>ting. For example, when extracting <strong>optical</strong> properties<br />
of a thin film, it is common <strong>to</strong> obtain first the dielectric function of the substrate from an<br />
independent measurement and then <strong>to</strong> use it as known (fixed) while analyzing <strong>spectra</strong> measured<br />
on the ‘film-substrate’ system.<br />
Parameters:<br />
Name Type Description What if omitted<br />
ModelNo Integer Model identity number No action is taken<br />
Command name: FreeShape<br />
Description: Emulates the pressing of but<strong>to</strong>ns F4, F5, F6 and F7 in the model window. Note:<br />
these but<strong>to</strong>ns are used <strong>to</strong> set up the so called variational, or ‘free-shape’, dielectric function (see<br />
section 4.6.3).<br />
Parameters:<br />
Name Type Description What if omitted<br />
ModelNo Integer Model identity number No action is taken<br />
Key Text Specifies the but<strong>to</strong>n <strong>to</strong> be emulated:<br />
“F4”, “F5”, “F6” or “F7”<br />
No action is taken<br />
4.11.6. Graph macro commands<br />
Command name: NewGraph<br />
Description: Creates a new graph; moves and resizes the graph window.<br />
Note: when a new graph is created, it is au<strong>to</strong>matically ascribed an identity number, which starts<br />
from 1 and increments for every new graph. It can be seen in the window title, e.g. graph #5<br />
has title “Graph5”. This number is used by other commands <strong>to</strong> identify this graph.<br />
Parameters:<br />
Name Type Description What if omitted<br />
XPos Integer Horizontal position of the left side (in The default value is<br />
screen pixels)<br />
assumed<br />
Guide <strong>to</strong> RefFIT Page 87
YPos Integer Vertical position of the <strong>to</strong>p side (in The default value is<br />
screen pixels)<br />
assumed<br />
Width Integer Window width (in screen pixels) The default value is<br />
assumed<br />
Height Integer Window height (in screen pixels) The default value is<br />
assumed<br />
Command name: GraphProperties<br />
Description: Sets the graph properties.<br />
Parameters:<br />
Name Type Description What if omitted<br />
GraphNo Integer Graph identity number No action is taken<br />
XMin Double Minimal X value XMin is unchanged<br />
XMax Double Maximal X value XMax is unchanged<br />
XLog Integer =0: linear X scale<br />
=1: logarithmic X scale<br />
XLog is unchanged<br />
XTitle Text X title XTitle is unchanged<br />
YMin Double Minimal Y value YMin is unchanged<br />
YMax Double Maximal Y value YMax is unchanged<br />
YLog Integer =0: linear Y scale<br />
=1: logarithmic Y scale<br />
YLog is unchanged<br />
YTitle Text Y title YTitle is unchanged<br />
Command name: AddDataCurve<br />
Description: Adds a data curve <strong>to</strong> the graph.<br />
Parameters:<br />
Name Type Description What if omitted<br />
GraphNo Integer Graph identity number No action is taken<br />
DatasetNo Integer Number of the dataset <strong>to</strong> be plotted No action is taken<br />
nColor Integer The curve color<br />
=0: AUTO (au<strong>to</strong>matic incrementing)<br />
=1: Black<br />
=2: Red<br />
=3: Green<br />
=4: Blue<br />
=5: Cyan<br />
=6: Magenta<br />
=7: Yellow<br />
=8: Gray<br />
=9: Grass<br />
=10: Sky<br />
=11: Orange<br />
Assumed <strong>to</strong> be 0<br />
Guide <strong>to</strong> RefFIT Page 88
ShowLine Integer<br />
=12: Chalk<br />
=13: Brown<br />
=14: Sea<br />
=15: Gold<br />
=16: Khaki<br />
=0: not <strong>to</strong> show line<br />
=1: <strong>to</strong> show line<br />
ShowSymbol Integer =0: not <strong>to</strong> show symbol<br />
=1: <strong>to</strong> show symbol<br />
ShowError Integer =0: not <strong>to</strong> show error bar<br />
=1: <strong>to</strong> show error bar<br />
nSymbolSize Integer Symbol size (only for ShowSymbol<br />
=1 )<br />
=0: 1 pixel<br />
=1: 3 pixels<br />
=2: 5 pixels<br />
=3: 7 pixels<br />
=4: 9 pixels<br />
=5: 11 pixels<br />
=6: 13 pixels<br />
=7: 15 pixels<br />
nSymbolShape Integer Symbol shape (only for ShowSymbol<br />
=1 )<br />
=0: square<br />
=1: circle<br />
=2: up triangle<br />
=3: down triangle<br />
=4: diamond<br />
SymbolOpen Integer (only for ShowSymbol =1 )<br />
=0: closed symbol<br />
=1: open symbol<br />
Assumed <strong>to</strong> be 1<br />
Assumed <strong>to</strong> be 1<br />
Assumed <strong>to</strong> be 1<br />
Assumed <strong>to</strong> be 2<br />
Assumed <strong>to</strong> be 0<br />
Assumed <strong>to</strong> be 0<br />
Scale Double Curve scale Assumed <strong>to</strong> be 1.0 (not<br />
scaled)<br />
Shift Double Curve shift Assumed <strong>to</strong> be 0.0 (not<br />
shifted)<br />
Command name: AddModelCurve<br />
Description: Adds a model curve <strong>to</strong> the graph.<br />
Parameters:<br />
Name Type Description What if omitted<br />
GraphNo Integer Graph identity number No action is taken<br />
ModelNo Integer Number of the model <strong>to</strong> be plotted No action is taken<br />
Quantity Text Abbreviation of the quantity <strong>to</strong> be Assumed <strong>to</strong> be “R” (i.e.<br />
plotted, e.g. “R”, “S1” etc. (see Table reflectivity)<br />
Guide <strong>to</strong> RefFIT Page 89
4-2);<br />
nColor Integer The curve color<br />
(the same as for command<br />
AddDataCurve)<br />
Assumed <strong>to</strong> be 0<br />
Scale Double Curve scale Assumed <strong>to</strong> be 1.0 (not<br />
scaled)<br />
Shift Double Curve shift Assumed <strong>to</strong> be 0.0 (not<br />
shifted)<br />
Command name: DeleteDataCurve<br />
Description: Deletes data curve from the graph.<br />
Parameters:<br />
Name Type Description What if omitted<br />
GraphNo Integer Graph identity number No action is taken<br />
DatasetNo Integer Number of the dataset, which gives the<br />
curve <strong>to</strong> be deleted<br />
No action is taken<br />
Command name: DeleteModelCurve<br />
Description: Deletes model curve from the graph.<br />
Parameters:<br />
Name Type Description What if omitted<br />
GraphNo Integer Graph identity number No action is taken<br />
ModelNo Integer Number of the model, which gives the<br />
curve <strong>to</strong> be deleted<br />
No action is taken<br />
Quantity Text Abbreviation of the quantity, which<br />
corresponds <strong>to</strong> the curve <strong>to</strong> be deleted<br />
No action is taken<br />
Command name: ExportModelCurve<br />
Description: exports the spectrum of the specified model quantity <strong>to</strong> a file<br />
Parameters:<br />
Name Type Description What if omitted<br />
File Text The name of the file (including file<br />
path, if the file is not in the same<br />
direc<strong>to</strong>ry, as macro file), i.e.<br />
“E1.DAT”, or<br />
“C:\MYDATA\E1.DAT”, or<br />
“..\EPS\E2.DAT”<br />
No action is taken<br />
ModelNo Integer The model number No action is taken<br />
Quantity Text Abbreviation of the quantity <strong>to</strong> be<br />
exported<br />
No action is taken<br />
Guide <strong>to</strong> RefFIT Page 90
XMin Double Minimal X (frequency) value No action is taken<br />
XMax Double Maximal X value No action is taken<br />
XPts Number Number of points <strong>to</strong> be exported No action is taken<br />
XGrid Number =1: linear grid<br />
=2: logarithmic grid<br />
Assumed <strong>to</strong> be 1<br />
4.11.7. Experimental parameters macro commands<br />
Command name: ExpParams<br />
Description: shows the “Experimental parameters” window on the screen and sets its position<br />
Parameters:<br />
Name Type Description What if omitted<br />
XPos Integer Horizontal position of the left side (in The position is not<br />
screen pixels)<br />
changed<br />
YPos Text Vertical position of the <strong>to</strong>p side (in The position is not<br />
screen pixels)<br />
changed<br />
Command name: SetExpParam<br />
Description: Sets the value and the <strong>fit</strong>ting activity of the specified experimental parameter<br />
Parameters:<br />
Name Type Description What if omitted<br />
ParamName Text The name of the parameter. The<br />
possible names are:<br />
“Sample thickness”<br />
“Thickness spread”<br />
“Angle of incidence”<br />
“Angle spread”<br />
"Scaling fac<strong>to</strong>r of R"<br />
"Scaling fac<strong>to</strong>r of T"<br />
No action is taken<br />
Value Double The new value The current value of the<br />
parameter is unchanged<br />
FitActive Integer =0 – not active in <strong>fit</strong>ting (fixed) The current <strong>fit</strong>ting<br />
=1 – active in <strong>fit</strong>ting (free)<br />
activity of the<br />
parameter is unchanged<br />
4.11.8. Fitting macro commands<br />
Command name: WindowFit<br />
Description: shows the “Fit” window on the screen and sets its position.<br />
Note: this command is not necessary <strong>to</strong> do a <strong>fit</strong>.<br />
Parameters:<br />
Guide <strong>to</strong> RefFIT Page 91
Name Type Description What if omitted<br />
XPos Integer Horizontal position of the left side (in The position is not<br />
screen pixels)<br />
changed<br />
YPos Text Vertical position of the <strong>to</strong>p side (in The position is not<br />
screen pixels)<br />
changed<br />
Command name: AddChiSqTerm<br />
Description: adds the specified chi-square term <strong>to</strong> the <strong>fit</strong>ting task<br />
Note: the chi-square term is defined by the pair Dataset-Model. The right quantity should be<br />
ascribed <strong>to</strong> the dataset when loading!<br />
Parameters:<br />
Name Type Description What if omitted<br />
DatasetNo Integer Number of the dataset No action is taken<br />
ModelNo Integer Number of the model No action is taken<br />
Weight Double The weight of the term Assumed <strong>to</strong> be 1.0<br />
Command name: DeleteChiSqTerm<br />
Description: delete the specified chi-square term from the <strong>fit</strong>ting task<br />
Note: the chi-square term is defined by the pair dataset-model.<br />
Parameters:<br />
Name Type Description What if omitted<br />
DatasetNo Integer Number of the dataset No action is taken<br />
ModelNo Integer Number of the model No action is taken<br />
Command name: Fit<br />
Description: starts the <strong>fit</strong>ting process<br />
Note: there is no command <strong>to</strong> s<strong>to</strong>p the <strong>fit</strong>ting process. It will be s<strong>to</strong>pped on the base of the<br />
termination criteria (see section 4.10.2).<br />
Parameters:<br />
Name Type Description What if omitted<br />
NumIters Integer The maximum number of iterations No limit on the number<br />
that will be performed<br />
of iterations is imposed<br />
4.11.9. Loop macro commands<br />
The two loop commands allow <strong>to</strong> perform calculations in a cycle, for instance, <strong>to</strong> do the<br />
same data <strong>fit</strong>ting for several temperature (or magnetic field) values. Command BeginLoop<br />
marks the beginning of the cycle; command EndLoop marks the end of the cycle. They<br />
Guide <strong>to</strong> RefFIT Page 92
always come in pairs. All commands enclosed between BeginLoop and EndLoop are<br />
executed in a cycle.<br />
The command BeginLoop has one text parameter “LoopFile”, which contains the name<br />
(with a path, if necessary) of the so-called loop file. The loop file instructs RefFIT on how <strong>to</strong><br />
run the cycle. It is a text file, which has the same number of lines, as the desired number of<br />
cycle steps. Each line contains one or more words separated by space. The first word is the first<br />
cycle variable, the second word is the second variable and so forth.<br />
The cycle variables are used <strong>to</strong> modify text parameters of the commands in the cycle. If a<br />
text parameter contains combination “%1”, then it will be substituted by the first cycle variable.<br />
The combination “%2” is substituted by the second cycle variable etc. For instance, if the first<br />
cycle variable is “250”, then text string “C:\MYDATA\REFL_T%1.DAT” will become<br />
“C:\MYDATA\REFL_T250.DAT”. Such a substitution, for example, in the File parameter of<br />
the LoadDataset command will cause the loading of a different dataset on each cycle step.<br />
Guide <strong>to</strong> RefFIT Page 93
5. Bibliography<br />
1. OPTPAL as well as many other useful FORTRAN <strong>optical</strong> programs by Dirk van der Marel<br />
can be downloaded from http://optics.unige.ch/vdm/marel_files/fortran_codes.html.<br />
2. Principles of optics, M.Born, E.Wolf, Pergamon Press (1968).<br />
3. Numerical recipes, W.H.Press, B.P.Flannery, S.A.Teukolsky and W.T.Vetterling,<br />
Cambridge Univ. Press (1986).<br />
4. Variational <strong>fit</strong>ting of <strong>optical</strong> data A.B.Kuzmenko, <strong>to</strong> be published.<br />
5. J.W. van der Eb, A.B.Kuzmenko and D. Van der Marel, Phys. Rev. Lett. 86, 3407 (2001).<br />
6. F.C.Jahoda, Phys.Rev. 107, 1261 (1957).<br />
7. H.Somal, PhD Thesis, University of Groningen (1999).<br />
8. A.B.Kuzmenko, N.Tombros, H.J.A.Molegraaf, M.Grüninger, D. van der Marel and<br />
S.Uchida, Phys. Rev. Lett. 91, 037004 (2003).<br />
9. F.P.Mena, <strong>to</strong> be published.<br />
10. A.B. Kuzmenko, D. van der Marel, P. J. M. van Bentum, E. A. Tishchenko, C. C.Presura,<br />
and A. A. Bush, Phys. Rev. B, 63, 094303 (2001).<br />
11. D. van der Marel, Phys. Rev. B 60, R765 (1999).<br />
12. W.Zimmermann, E.H.Brandt, M.Bauer, E.Seider and L.Genzel, Physica C 183, 99 (1991).<br />
13. C.C.Homes, T.Timusk, D.A.Bonn, R.Liang and W.Hardy, Physica C 254, 265 (1995).<br />
14. O.S.Heavens, “Thin Film Physics”, Ed. Methuen, London (1970).<br />
Guide <strong>to</strong> RefFIT Page 94