software to fit optical spectra - Quantum Materials Group
software to fit optical spectra - Quantum Materials Group
software to fit optical spectra - Quantum Materials Group

Create successful ePaper yourself
Turn your PDF publications into a flip-book with our unique Google optimized e-Paper software.
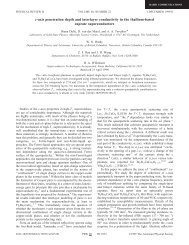
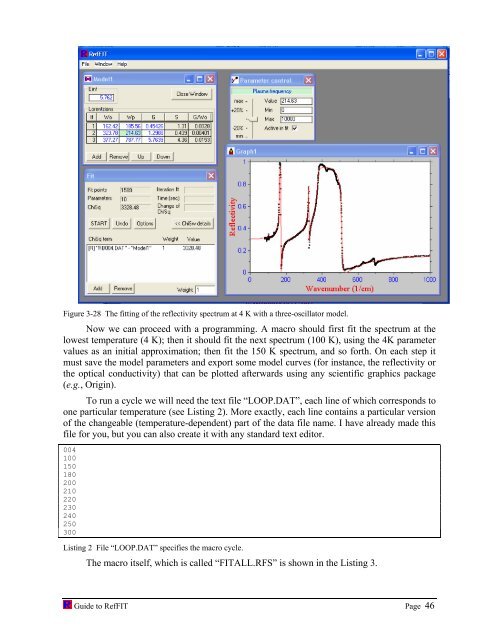
Figure 3-28 The <strong>fit</strong>ting of the reflectivity spectrum at 4 K with a three-oscilla<strong>to</strong>r model.<br />
Now we can proceed with a programming. A macro should first <strong>fit</strong> the spectrum at the<br />
lowest temperature (4 K); then it should <strong>fit</strong> the next spectrum (100 K), using the 4K parameter<br />
values as an initial approximation; then <strong>fit</strong> the 150 K spectrum, and so forth. On each step it<br />
must save the model parameters and export some model curves (for instance, the reflectivity or<br />
the <strong>optical</strong> conductivity) that can be plotted afterwards using any scientific graphics package<br />
(e.g., Origin).<br />
To run a cycle we will need the text file “LOOP.DAT”, each line of which corresponds <strong>to</strong><br />
one particular temperature (see Listing 2). More exactly, each line contains a particular version<br />
of the changeable (temperature-dependent) part of the data file name. I have already made this<br />
file for you, but you can also create it with any standard text edi<strong>to</strong>r.<br />
004<br />
100<br />
150<br />
180<br />
200<br />
210<br />
220<br />
230<br />
240<br />
250<br />
300<br />
Listing 2 File “LOOP.DAT” specifies the macro cycle.<br />
The macro itself, which is called “FITALL.RFS” is shown in the Listing 3.<br />
Guide <strong>to</strong> RefFIT Page 46