software to fit optical spectra - Quantum Materials Group
software to fit optical spectra - Quantum Materials Group
software to fit optical spectra - Quantum Materials Group

You also want an ePaper? Increase the reach of your titles
YUMPU automatically turns print PDFs into web optimized ePapers that Google loves.
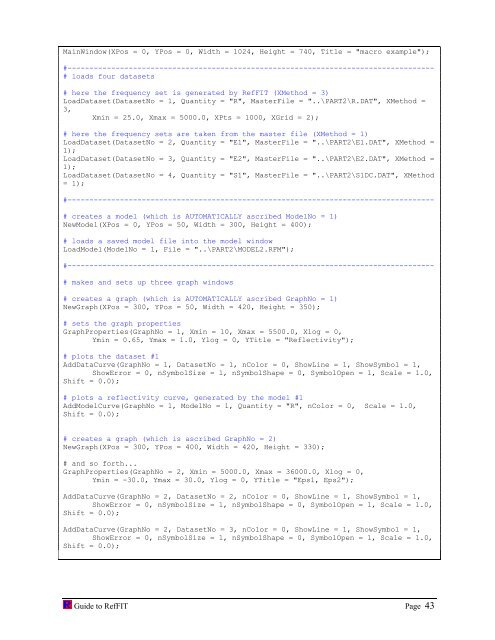
MainWindow(XPos = 0, YPos = 0, Width = 1024, Height = 740, Title = "macro example");<br />
#------------------------------------------------------------------------------------<br />
# loads four datasets<br />
# here the frequency set is generated by RefFIT (XMethod = 3)<br />
LoadDataset(DatasetNo = 1, Quantity = "R", MasterFile = "..\PART2\R.DAT", XMethod =<br />
3,<br />
Xmin = 25.0, Xmax = 5000.0, XPts = 1000, XGrid = 2);<br />
# here the frequency sets are taken from the master file (XMethod = 1)<br />
LoadDataset(DatasetNo = 2, Quantity = "E1", MasterFile = "..\PART2\E1.DAT", XMethod =<br />
1);<br />
LoadDataset(DatasetNo = 3, Quantity = "E2", MasterFile = "..\PART2\E2.DAT", XMethod =<br />
1);<br />
LoadDataset(DatasetNo = 4, Quantity = "S1", MasterFile = "..\PART2\S1DC.DAT", XMethod<br />
= 1);<br />
#------------------------------------------------------------------------------------<br />
# creates a model (which is AUTOMATICALLY ascribed ModelNo = 1)<br />
NewModel(XPos = 0, YPos = 50, Width = 300, Height = 400);<br />
# loads a saved model file in<strong>to</strong> the model window<br />
LoadModel(ModelNo = 1, File = "..\PART2\MODEL2.RFM");<br />
#------------------------------------------------------------------------------------<br />
# makes and sets up three graph windows<br />
# creates a graph (which is AUTOMATICALLY ascribed GraphNo = 1)<br />
NewGraph(XPos = 300, YPos = 50, Width = 420, Height = 350);<br />
# sets the graph properties<br />
GraphProperties(GraphNo = 1, Xmin = 10, Xmax = 5500.0, Xlog = 0,<br />
Ymin = 0.65, Ymax = 1.0, Ylog = 0, YTitle = "Reflectivity");<br />
# plots the dataset #1<br />
AddDataCurve(GraphNo = 1, DatasetNo = 1, nColor = 0, ShowLine = 1, ShowSymbol = 1,<br />
ShowError = 0, nSymbolSize = 1, nSymbolShape = 0, SymbolOpen = 1, Scale = 1.0,<br />
Shift = 0.0);<br />
# plots a reflectivity curve, generated by the model #1<br />
AddModelCurve(GraphNo = 1, ModelNo = 1, Quantity = "R", nColor = 0, Scale = 1.0,<br />
Shift = 0.0);<br />
# creates a graph (which is ascribed GraphNo = 2)<br />
NewGraph(XPos = 300, YPos = 400, Width = 420, Height = 330);<br />
# and so forth...<br />
GraphProperties(GraphNo = 2, Xmin = 5000.0, Xmax = 36000.0, Xlog = 0,<br />
Ymin = -30.0, Ymax = 30.0, Ylog = 0, YTitle = "Eps1, Eps2");<br />
AddDataCurve(GraphNo = 2, DatasetNo = 2, nColor = 0, ShowLine = 1, ShowSymbol = 1,<br />
ShowError = 0, nSymbolSize = 1, nSymbolShape = 0, SymbolOpen = 1, Scale = 1.0,<br />
Shift = 0.0);<br />
AddDataCurve(GraphNo = 2, DatasetNo = 3, nColor = 0, ShowLine = 1, ShowSymbol = 1,<br />
ShowError = 0, nSymbolSize = 1, nSymbolShape = 0, SymbolOpen = 1, Scale = 1.0,<br />
Shift = 0.0);<br />
Guide <strong>to</strong> RefFIT Page 43