software to fit optical spectra - Quantum Materials Group
software to fit optical spectra - Quantum Materials Group
software to fit optical spectra - Quantum Materials Group

Create successful ePaper yourself
Turn your PDF publications into a flip-book with our unique Google optimized e-Paper software.
In ellipsometry the complex ratio ρ = r p / rs<br />
is measured, commonly expressed in terms<br />
i∆<br />
of the two real parameters ψ and ∆ : ρ = tan ψe<br />
. The inversion of this formula gives<br />
ψ = arctan ρ and ∆ = arg ρ .<br />
The pseudo-dielectric function is defined as:<br />
ε pseudo<br />
2<br />
⎡<br />
⎤<br />
2<br />
2 ⎛1<br />
+ ρ ⎞<br />
= sin θ ⎢1<br />
+ tan θ⎜<br />
⎟ ⎥ .<br />
⎢⎣<br />
⎝1<br />
− ρ ⎠ ⎥⎦<br />
In the case of an isotropic sample the ε pseudo coincides with the true dielectric function ε .<br />
One of the possible ellipsometry configurations involves a fixed polarizer (at angle P )<br />
and a rotating analyzer (without a retarder). In this case the Fourier coefficients of the detec<strong>to</strong>r<br />
signal as functions of the analyzer angle are:<br />
2<br />
2<br />
tan ψ − tan P 2 tanψ<br />
cos ∆ tan P<br />
α =<br />
, β =<br />
.<br />
2<br />
2<br />
2<br />
2<br />
tan ψ + tan P tan ψ + tan P<br />
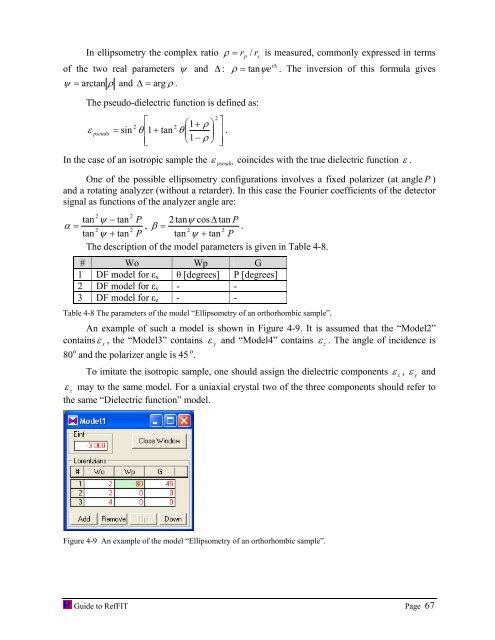
The description of the model parameters is given in Table 4-8.<br />
# Wo Wp G<br />
1 DF model for εx θ [degrees] P [degrees]<br />
2 DF model for εy - -<br />
3 DF model for εz - -<br />
Table 4-8 The parameters of the model “Ellipsometry of an orthorhombic sample”.<br />
An example of such a model is shown in Figure 4-9. It is assumed that the “Model2”<br />
containsε x , the “Model3” contains ε y and “Model4” contains ε z . The angle of incidence is<br />
80 o and the polarizer angle is 45 o .<br />
To imitate the isotropic sample, one should assign the dielectric components ε x , ε y and<br />
ε z may <strong>to</strong> the same model. For a uniaxial crystal two of the three components should refer <strong>to</strong><br />
the same “Dielectric function” model.<br />
Figure 4-9 An example of the model “Ellipsometry of an orthorhombic sample”.<br />
Guide <strong>to</strong> RefFIT Page 67