software to fit optical spectra - Quantum Materials Group
software to fit optical spectra - Quantum Materials Group
software to fit optical spectra - Quantum Materials Group

You also want an ePaper? Increase the reach of your titles
YUMPU automatically turns print PDFs into web optimized ePapers that Google loves.
4.9.2. Graph contents<br />
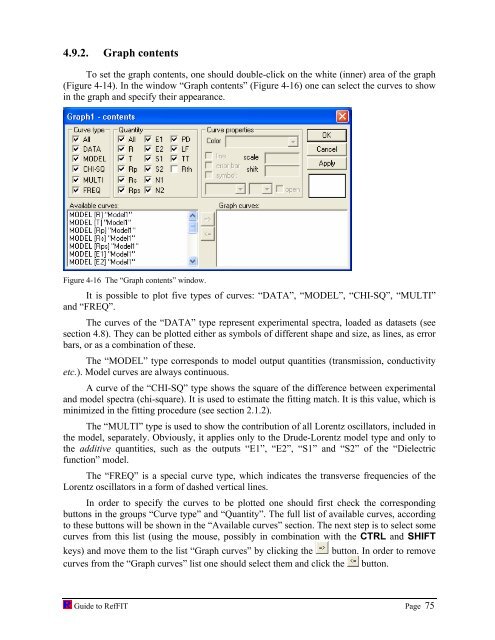
To set the graph contents, one should double-click on the white (inner) area of the graph<br />
(Figure 4-14). In the window “Graph contents” (Figure 4-16) one can select the curves <strong>to</strong> show<br />
in the graph and specify their appearance.<br />
Figure 4-16 The “Graph contents” window.<br />
It is possible <strong>to</strong> plot five types of curves: “DATA”, “MODEL”, “CHI-SQ”, “MULTI”<br />
and “FREQ”.<br />
The curves of the “DATA” type represent experimental <strong>spectra</strong>, loaded as datasets (see<br />
section 4.8). They can be plotted either as symbols of different shape and size, as lines, as error<br />
bars, or as a combination of these.<br />
The “MODEL” type corresponds <strong>to</strong> model output quantities (transmission, conductivity<br />
etc.). Model curves are always continuous.<br />
A curve of the “CHI-SQ” type shows the square of the difference between experimental<br />
and model <strong>spectra</strong> (chi-square). It is used <strong>to</strong> estimate the <strong>fit</strong>ting match. It is this value, which is<br />
minimized in the <strong>fit</strong>ting procedure (see section 2.1.2).<br />
The “MULTI” type is used <strong>to</strong> show the contribution of all Lorentz oscilla<strong>to</strong>rs, included in<br />
the model, separately. Obviously, it applies only <strong>to</strong> the Drude-Lorentz model type and only <strong>to</strong><br />
the additive quantities, such as the outputs “E1”, “E2”, “S1” and “S2” of the “Dielectric<br />
function” model.<br />
The “FREQ” is a special curve type, which indicates the transverse frequencies of the<br />
Lorentz oscilla<strong>to</strong>rs in a form of dashed vertical lines.<br />
In order <strong>to</strong> specify the curves <strong>to</strong> be plotted one should first check the corresponding<br />
but<strong>to</strong>ns in the groups “Curve type” and “Quantity”. The full list of available curves, according<br />
<strong>to</strong> these but<strong>to</strong>ns will be shown in the “Available curves” section. The next step is <strong>to</strong> select some<br />
curves from this list (using the mouse, possibly in combination with the CTRL and SHIFT<br />
keys) and move them <strong>to</strong> the list “Graph curves” by clicking the but<strong>to</strong>n. In order <strong>to</strong> remove<br />
curves from the “Graph curves” list one should select them and click the but<strong>to</strong>n.<br />
Guide <strong>to</strong> RefFIT Page 75