software to fit optical spectra - Quantum Materials Group
software to fit optical spectra - Quantum Materials Group
software to fit optical spectra - Quantum Materials Group

You also want an ePaper? Increase the reach of your titles
YUMPU automatically turns print PDFs into web optimized ePapers that Google loves.
AddModelCurve(GraphNo = 2, ModelNo = 1, Quantity = "E1", nColor = 0, Scale = 1.0,<br />
Shift = 0.0);<br />
AddModelCurve(GraphNo = 2, ModelNo = 1, Quantity = "E2", nColor = 0, Scale = 1.0,<br />
Shift = 0.0);<br />
NewGraph(XPos = 650, YPos = 200, Width = 352, Height = 330);<br />
GraphProperties(GraphNo = 3, Xmin = 0, Xmax = 1000.0, Xlog = 0,<br />
Ymin = 0.0, Ymax = 60000, Ylog = 0, YTitle = "Sigma1 (S/cm)");<br />
AddDataCurve(GraphNo = 3, DatasetNo = 4, nColor = 0, ShowLine = 0, ShowSymbol = 1,<br />
ShowError = 0, nSymbolSize = 4, nSymbolShape = 0, SymbolOpen = 0, Scale = 1.0,<br />
Shift = 0.0);<br />
AddModelCurve(GraphNo = 3, ModelNo = 1, Quantity = "S1", nColor = 0, Scale = 1.0,<br />
Shift = 0.0);<br />
#------------------------------------------------------------------------------------<br />
# opens the "Fit" window<br />
WindowFit(Xpos = 0, YPos = 450);<br />
# adds four chi-square terms <strong>to</strong> the <strong>fit</strong>ting task, which means that all datasets are<br />
#requested <strong>to</strong> be <strong>fit</strong>ted, but does not perform <strong>fit</strong>ting yet<br />
AddChiSqTerm(DatasetNo = 1, ModelNo = 1, Weight = 1e3);<br />
AddChiSqTerm(DatasetNo = 2, ModelNo = 1, Weight = 1.0);<br />
AddChiSqTerm(DatasetNo = 3, ModelNo = 1, Weight = 1.0);<br />
AddChiSqTerm(DatasetNo = 4, ModelNo = 1, Weight = 1e-6);<br />
#------------------------------------------------------------------------------------<br />
# starts the <strong>fit</strong>ting, which is limited by 10 iterations<br />
Fit(NumIters = 10);<br />
#------------------------------------------------------------------------------------<br />
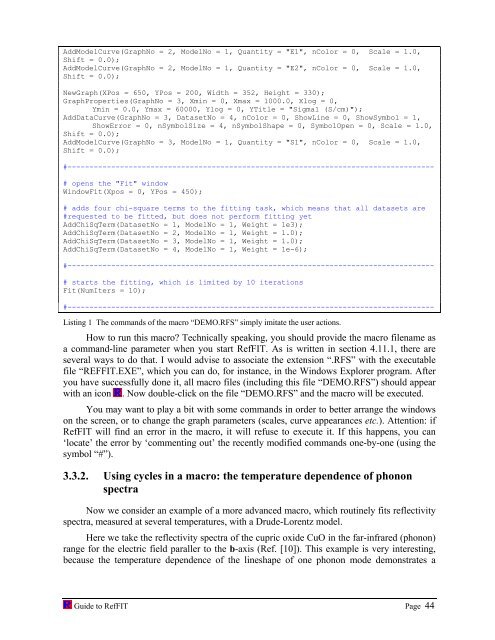
Listing 1 The commands of the macro “DEMO.RFS” simply imitate the user actions.<br />
How <strong>to</strong> run this macro? Technically speaking, you should provide the macro filename as<br />
a command-line parameter when you start RefFIT. As is written in section 4.11.1, there are<br />
several ways <strong>to</strong> do that. I would advise <strong>to</strong> associate the extension “.RFS” with the executable<br />
file “REFFIT.EXE”, which you can do, for instance, in the Windows Explorer program. After<br />
you have successfully done it, all macro files (including this file “DEMO.RFS”) should appear<br />
with an icon . Now double-click on the file “DEMO.RFS” and the macro will be executed.<br />
You may want <strong>to</strong> play a bit with some commands in order <strong>to</strong> better arrange the windows<br />
on the screen, or <strong>to</strong> change the graph parameters (scales, curve appearances etc.). Attention: if<br />
RefFIT will find an error in the macro, it will refuse <strong>to</strong> execute it. If this happens, you can<br />
‘locate’ the error by ‘commenting out’ the recently modified commands one-by-one (using the<br />
symbol “#”).<br />
3.3.2. Using cycles in a macro: the temperature dependence of phonon<br />
<strong>spectra</strong><br />
Now we consider an example of a more advanced macro, which routinely <strong>fit</strong>s reflectivity<br />
<strong>spectra</strong>, measured at several temperatures, with a Drude-Lorentz model.<br />
Here we take the reflectivity <strong>spectra</strong> of the cupric oxide CuO in the far-infrared (phonon)<br />
range for the electric field paraller <strong>to</strong> the b-axis (Ref. [10]). This example is very interesting,<br />
because the temperature dependence of the lineshape of one phonon mode demonstrates a<br />
Guide <strong>to</strong> RefFIT Page 44