software to fit optical spectra - Quantum Materials Group
software to fit optical spectra - Quantum Materials Group
software to fit optical spectra - Quantum Materials Group

Create successful ePaper yourself
Turn your PDF publications into a flip-book with our unique Google optimized e-Paper software.
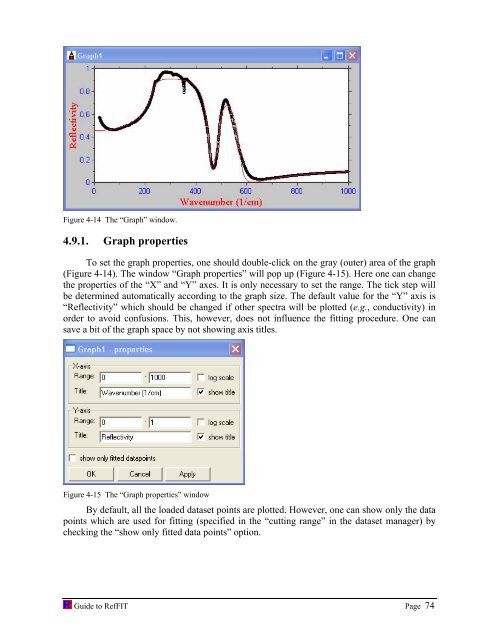
Figure 4-14 The “Graph” window.<br />
4.9.1. Graph properties<br />
To set the graph properties, one should double-click on the gray (outer) area of the graph<br />
(Figure 4-14). The window “Graph properties” will pop up (Figure 4-15). Here one can change<br />
the properties of the “X” and “Y” axes. It is only necessary <strong>to</strong> set the range. The tick step will<br />
be determined au<strong>to</strong>matically according <strong>to</strong> the graph size. The default value for the “Y” axis is<br />
“Reflectivity” which should be changed if other <strong>spectra</strong> will be plotted (e.g., conductivity) in<br />
order <strong>to</strong> avoid confusions. This, however, does not influence the <strong>fit</strong>ting procedure. One can<br />
save a bit of the graph space by not showing axis titles.<br />
Figure 4-15 The “Graph properties” window<br />
By default, all the loaded dataset points are plotted. However, one can show only the data<br />
points which are used for <strong>fit</strong>ting (specified in the “cutting range” in the dataset manager) by<br />
checking the “show only <strong>fit</strong>ted data points” option.<br />
Guide <strong>to</strong> RefFIT Page 74