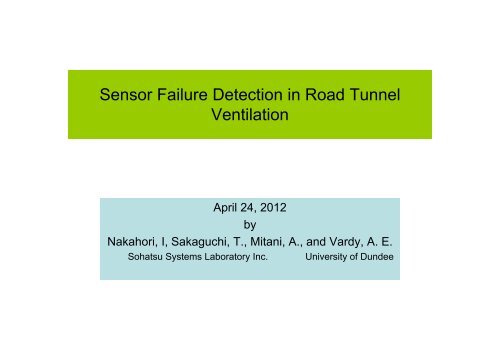
Sensor Failure Detection in Road Tunnel Ventilation
Sensor Failure Detection in Road Tunnel Ventilation
Sensor Failure Detection in Road Tunnel Ventilation

You also want an ePaper? Increase the reach of your titles
YUMPU automatically turns print PDFs into web optimized ePapers that Google loves.
<strong>Sensor</strong> <strong>Failure</strong> <strong>Detection</strong> <strong>in</strong> <strong>Road</strong> <strong>Tunnel</strong><br />
<strong>Ventilation</strong><br />
April 24, 2012<br />
by<br />
Nakahori, I, Sakaguchi, T., Mitani, A., and Vardy, A. E.<br />
Sohatsu Systems Laboratory Inc. University of Dundee
Outl<strong>in</strong>e of Presentation<br />
1. <strong>Road</strong> <strong>Tunnel</strong> <strong>Ventilation</strong> Control System<br />
2. <strong>Sensor</strong> <strong>Failure</strong>s<br />
3. Longitud<strong>in</strong>al <strong>Ventilation</strong> Models<br />
4. Proposed Method of <strong>Sensor</strong> <strong>Failure</strong> <strong>Detection</strong><br />
5. Illustrative Example of <strong>Sensor</strong> <strong>Failure</strong> <strong>Detection</strong><br />
6. Conclusions
1. <strong>Road</strong> <strong>Tunnel</strong> <strong>Ventilation</strong> Control System<br />
Fig. 1 Configuration of Inverter-driven <strong>Road</strong> <strong>Tunnel</strong> <strong>Ventilation</strong> Control System<br />
- Instrument Panel: sensor signals from VI, CO, AV, Traffic Counter,<br />
Fire Detector, Emergency Situation Detector and etc. are gathered.<br />
- Control Panel: control SW determ<strong>in</strong>es the speed of the jet-fans.<br />
- Inverter Panel: electrical voltage with variable frequency is<br />
generated to actually drive the jet-fans.
2. <strong>Sensor</strong> <strong>Failure</strong>s<br />
2.1 Typical <strong>Failure</strong> <strong>in</strong> Traffic Counter (“TC”)<br />
- Loop detector TC performance go<strong>in</strong>g down due to wear and tear.<br />
- Laser detector TC performance go<strong>in</strong>g down due to wear and tear.<br />
- Video TC performance go<strong>in</strong>g down under bad weather conditions<br />
such as heavy ra<strong>in</strong> and snow.<br />
2.2 Typical <strong>Failure</strong> <strong>in</strong> Air Velocity (“AV”) Meter<br />
- Measurements affected by the air flow disturbance due to vehicle<br />
movement <strong>in</strong> local AV meter.<br />
- Measurements disrupted by traffic congestion <strong>in</strong> cross sectional AV<br />
meter.<br />
2.3 Typical <strong>Failure</strong> <strong>in</strong> Pollution Concentration (“VI”, “CO”)<br />
- W<strong>in</strong>dows <strong>in</strong> VI meter affected by dust and contam<strong>in</strong>ants.<br />
- Screen <strong>in</strong> CO meter catch<strong>in</strong>g dust.
3. Longitud<strong>in</strong>al <strong>Ventilation</strong> Models<br />
Employs quasi-steady air velocity and pollution concentration models<br />
Vr<br />
Vr<br />
Ck-1 Ck Ck+1<br />
1 k-1 k k+1<br />
…<br />
Air Velocity Model<br />
- Vehicle piston force<br />
- Fan thrust<br />
- Natural w<strong>in</strong>d<br />
- <strong>Tunnel</strong> resistance force<br />
Traffic Flow (Input)<br />
-Vehicle location<br />
-Vehicle Velocity<br />
Pollution Concentration Model<br />
- Pollution generated by vehicles <strong>in</strong> box<br />
- Pollution com<strong>in</strong>g <strong>in</strong> from neighbor<strong>in</strong>g box<br />
- Pollution move out to neighbor<strong>in</strong>g box
4. Architecture of Proposed <strong>Sensor</strong> <strong>Failure</strong> <strong>Detection</strong><br />
Calibration<br />
Module<br />
X<br />
Three numerical modules and two data storages<br />
TC AV VI CO<br />
Measured Data<br />
Onl<strong>in</strong>e Simulation Module<br />
Traffic, Air Velocity, Pollution Density<br />
Parameters State Variables<br />
Predicted Data<br />
Fan<br />
<strong>Failure</strong><br />
<strong>Detection</strong><br />
Module<br />
X
4.1 Calibration<br />
Objective is to revise the parameter values that best fit the measured data set<br />
Pollution Gas Emission of<br />
Large & Small Vehicles<br />
JET FANS<br />
μL, μS<br />
Calibration process<br />
provides quantitative<br />
statistical data about<br />
deviation of measured<br />
and predicted values.<br />
ATL, ATS<br />
Effective Resistance Area of Large<br />
& Small Vehicles
4.2 Statistical Nature of Measured and Predicted Values<br />
10<br />
AV measured value m/s<br />
8<br />
6<br />
4<br />
2<br />
y = 0,8855x - 0,1029<br />
R² = 0,934<br />
0<br />
0 2 4 6 8 10<br />
AV predicted value m/s<br />
AV data were collected at Kawasaki Koro <strong>Tunnel</strong>, Japan.<br />
The Variation (= difference of measured and predicted values)<br />
is <strong>in</strong>dicative of “normal distribution”.
4.2 Statistical Nature of Measured and Predicted Values<br />
100<br />
VI measured value g/kg-air<br />
90<br />
80<br />
y = 0,9543x + 2,81<br />
R² = 0,4012<br />
70<br />
70 80 90 100<br />
VI predicted value g/kg-air<br />
VI data were collected at Kawasaki Koro <strong>Tunnel</strong>, Japan.<br />
The Variation (= difference of measured and predicted values)<br />
Is <strong>in</strong>dicative of “normal distribution”.
5. Illustrative Example of <strong>Sensor</strong> <strong>Failure</strong> <strong>Detection</strong><br />
Collected TC, AV and VI data from Kawasaki Koro <strong>Tunnel</strong> and run the Method<br />
ΔAV[m/s]<br />
ΔVI [%]<br />
10<br />
5<br />
0<br />
-5<br />
-10<br />
20<br />
10<br />
0<br />
-10<br />
-20<br />
12:00<br />
14:00<br />
3σ<br />
3σ<br />
16:00<br />
18:00<br />
∆AV(=AVmeasured-AVpredicted); ∆VI (=VImeasured-VIpredicted)<br />
20:00<br />
The sensor failure is detected at time 01:00.<br />
22:00<br />
00:00
5. Illustrative Example of <strong>Sensor</strong> <strong>Failure</strong> <strong>Detection</strong>
5. Illustrative Example of <strong>Sensor</strong> <strong>Failure</strong> <strong>Detection</strong><br />
Pictures <strong>in</strong>dicat<strong>in</strong>g ma<strong>in</strong>tenance team runn<strong>in</strong>g “unimog” mach<strong>in</strong>e and<br />
wash<strong>in</strong>g the tunnel wall dur<strong>in</strong>g clean<strong>in</strong>g up operation.
5. Illustrative Example of <strong>Sensor</strong> <strong>Failure</strong> <strong>Detection</strong><br />
Pictures show<strong>in</strong>g visibility <strong>in</strong>dex (“VI”) meter: light transmitter (left)<br />
and light reflector (right). Water drops caus<strong>in</strong>g “failure” are seen<br />
<strong>in</strong> the reflector.
VI値 VI[%] [%]<br />
5. Illustrative Example of <strong>Sensor</strong> <strong>Failure</strong> <strong>Detection</strong><br />
100<br />
80<br />
60<br />
40<br />
20<br />
Visual Inspection of Installation<br />
取付状況の目視点検<br />
Procedure to restore VI sensor<br />
センサ調整状況とVI計測値<br />
Clean<strong>in</strong>g of Clean<strong>in</strong>g of Manual<br />
Transmitter/ 投受光部 Reflector リフレクタ 手動校正 Calibration<br />
Receiver レンズの清掃 Lens 反射鏡の清掃<br />
Glass<br />
0<br />
23:35 23:45 23:55 0:05 0:15 0:25<br />
Time 時刻<br />
0:35 0:45 0:55 1:05
6. Conclusions<br />
• Has presented a sensor failure detection method <strong>in</strong> rout<strong>in</strong>e tunnel<br />
operations.<br />
• Makes statistical comparisons between measured and predicted<br />
values based on quasi-steady approximations to air flow and pollution<br />
concentration model.<br />
Summariz<strong>in</strong>g statements:<br />
• Measurements of traffic data can be used to predict evolv<strong>in</strong>g air<br />
velocities and pollution concentrations throughout the tunnel.<br />
• By analyz<strong>in</strong>g measured data, it is possible to <strong>in</strong>fer realistic<br />
approximations for values of tunnel and vehicle parameters.<br />
• The method of determ<strong>in</strong><strong>in</strong>g optimal values for tunnel and vehicle<br />
parameters provides quantitative statistical data about expected<br />
deviations between measured and predicted values at any sensor.<br />
• By monitor<strong>in</strong>g statistical variations of measured and predicted values<br />
of sensor dur<strong>in</strong>g actual tunnel operation, it is possible to detect<br />
significant variations from normal behavior and thus to identify<br />
<strong>in</strong>stances of probable sensor failures.
Thank you for your attention!