Project Assessment Form for PM2
Project Assessment Form for PM2
Project Assessment Form for PM2

You also want an ePaper? Increase the reach of your titles
YUMPU automatically turns print PDFs into web optimized ePapers that Google loves.
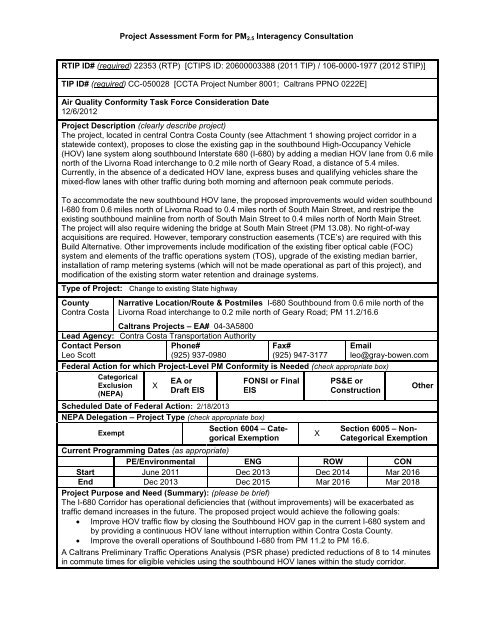
<strong>Project</strong> <strong>Assessment</strong> <strong>Form</strong> <strong>for</strong> <strong>PM2</strong>.5 Interagency Consultation<br />
RTIP ID# (required) 22353 (RTP) [CTIPS ID: 20600003388 (2011 TIP) / 106-0000-1977 (2012 STIP)]<br />
TIP ID# (required) CC-050028 [CCTA <strong>Project</strong> Number 8001; Caltrans PPNO 0222E]<br />
Air Quality Con<strong>for</strong>mity Task Force Consideration Date<br />
12/6/2012<br />
<strong>Project</strong> Description (clearly describe project)<br />
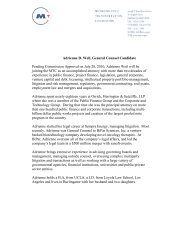
The project, located in central Contra Costa County (see Attachment 1 showing project corridor in a<br />
statewide context), proposes to close the existing gap in the southbound High-Occupancy Vehicle<br />
(HOV) lane system along southbound Interstate 680 (I-680) by adding a median HOV lane from 0.6 mile<br />
north of the Livorna Road interchange to 0.2 mile north of Geary Road, a distance of 5.4 miles.<br />
Currently, in the absence of a dedicated HOV lane, express buses and qualifying vehicles share the<br />
mixed-flow lanes with other traffic during both morning and afternoon peak commute periods.<br />
To accommodate the new southbound HOV lane, the proposed improvements would widen southbound<br />
I-680 from 0.6 miles north of Livorna Road to 0.4 miles north of South Main Street, and restripe the<br />
existing southbound mainline from north of South Main Street to 0.4 miles north of North Main Street.<br />
The project will also require widening the bridge at South Main Street (PM 13.08). No right-of-way<br />
acquisitions are required. However, temporary construction easements (TCE’s) are required with this<br />
Build Alternative. Other improvements include modification of the existing fiber optical cable (FOC)<br />
system and elements of the traffic operations system (TOS), upgrade of the existing median barrier,<br />
installation of ramp metering systems (which will not be made operational as part of this project), and<br />
modification of the existing storm water retention and drainage systems.<br />
Type of <strong>Project</strong>: Change to existing State highway<br />
County<br />
Contra Costa<br />
Narrative Location/Route & Postmiles I-680 Southbound from 0.6 mile north of the<br />
Livorna Road interchange to 0.2 mile north of Geary Road; PM 11.2/16.6<br />
Caltrans <strong>Project</strong>s – EA# 04-3A5800<br />
Lead Agency: Contra Costa Transportation Authority<br />
Contact Person<br />
Leo Scott<br />
Phone#<br />
(925) 937-0980<br />
Fax#<br />
(925) 947-3177<br />
Email<br />
leo@gray-bowen.com<br />
Federal Action <strong>for</strong> which <strong>Project</strong>-Level PM Con<strong>for</strong>mity is Needed (check appropriate box)<br />
Categorical<br />
Exclusion<br />
(NEPA)<br />
X<br />
EA or<br />
Draft EIS<br />
FONSI or Final<br />
EIS<br />
PS&E or<br />
Construction<br />
Other<br />
Scheduled Date of Federal Action: 2/18/2013<br />
NEPA Delegation – <strong>Project</strong> Type (check appropriate box)<br />
Exempt<br />
Section 6004 – Categorical<br />
Exemption<br />
X<br />
Section 6005 – Non-<br />
Categorical Exemption<br />
Current Programming Dates (as appropriate)<br />
PE/Environmental ENG ROW CON<br />
Start June 2011 Dec 2013 Dec 2014 Mar 2016<br />
End Dec 2013 Dec 2015 Mar 2016 Mar 2018<br />
<strong>Project</strong> Purpose and Need (Summary): (please be brief)<br />
The I-680 Corridor has operational deficiencies that (without improvements) will be exacerbated as<br />
traffic demand increases in the future. The proposed project would achieve the following goals:<br />
• Improve HOV traffic flow by closing the Southbound HOV gap in the current I-680 system and<br />
by providing a continuous HOV lane without interruption within Contra Costa County.<br />
• Improve the overall operations of Southbound I-680 from PM 11.2 to PM 16.6.<br />
A Caltrans Preliminary Traffic Operations Analysis (PSR phase) predicted reductions of 8 to 14 minutes<br />
in commute times <strong>for</strong> eligible vehicles using the southbound HOV lanes within the study corridor.
<strong>PM2</strong>.5 <strong>Project</strong> <strong>Assessment</strong> <strong>Form</strong> <strong>for</strong> Interagency Consultation<br />
Surrounding Land Use/Traffic Generators (especially effect on diesel traffic)<br />
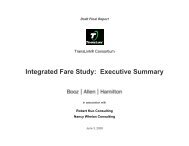
Attachment 2 (“Land Use in the <strong>Project</strong> Study Area”) depicts the geographic distribution of existing land<br />
use types along the corridor. From the northern project limit to the I-680/SR 24 interchange, existing<br />
land uses are commercial and residential. Offices and commercial uses dominate the area around the<br />
I-680/SR 24 interchange. After I-680 crosses Las Trampas Creek, land use transitions to residential.<br />
No substantial diesel vehicle e.g., heavy truck) traffic generators were identified or are anticipated along<br />
or near the project corridor.<br />
Brief summary of assumptions and methodology used <strong>for</strong> conducting analysis (please keep this<br />
concise – specifics may include date of when traffic counts were conducted, studies where truck<br />
percentages were derived)<br />
The following Level of Service (LOS) data are excerpted from the Draft Traffic Operations Report <strong>for</strong> the<br />
Southbound I-680 HOV Gap Closure PA/ED prepared <strong>for</strong> CCTA and Caltrans by Fehr & Peers in<br />
October 2012. In that month Fehr & Peers also provided predicted AADTs from which the AADTs<br />
presented below are extracted. As part of their project-related traffic studies, Fehr & Peers per<strong>for</strong>med<br />
extensive data collection ef<strong>for</strong>ts in May 2011 to determine existing peak period travel times, mainline<br />
queuing characteristics, traffic volumes, vehicle occupancies and truck percentages within study area<br />
boundaries. The principles presented in Chapter 2 (Causes of Congestion) in the manual entitled A<br />
Short Course on Freeway Operations Analysis, prepared by Caltrans District 4, were used to estimate<br />
demand volumes from the AM and PM traffic counts. The most recent available version of the CCTA<br />
Transportation Model (consistent with the corresponding MTC model) was validated to 2010 conditions<br />
within the study area and then used to develop future year peak period traffic <strong>for</strong>ecasts <strong>for</strong> the study<br />
corridor. Appendix 1 (<strong>Project</strong>s by County) in the Transportation 2035 Plan <strong>for</strong> the San Francisco Bay<br />
Area (April 2009) prepared by MTC is the primary source <strong>for</strong> determining which interstate and state<br />
route improvements to assume in the future. The freeway mainline segments, weaving areas, and ramp<br />
junction operations were analyzed using FREQ macroscopic modeling software. Truck percentages<br />
were derived from Caltrans’ 2011 Annual Average Daily Truck Traffic dataset.<br />
Opening Year: If facility is a highway or street, Build and No Build LOS, AADT, % and # trucks, truck AADT<br />
of proposed facility<br />
PREDICTED I-680 SB PEAK HOUR LEVEL OF SERVICE (LOS) & ANNUAL AVERAGE DAILY TRAFFIC (ADT): OPENING YEAR (2016)<br />
Peak Hour LOS: AM (PM) AADT<br />
All Lanes<br />
Assigned<br />
Mixed Flow<br />
Proportion<br />
Segment HOV Lanes Lanes<br />
Total of Trucks to Trucks<br />
Segment Length No Build Build No Build Build No Build Build Total No Build Build<br />
Concord Ave. On-Ramp to SR 242 On-<br />
Ramp<br />
1.15 B (A) B (A) F (C) C (C)<br />
67,100 to<br />
79,100<br />
67,100 to<br />
79,100<br />
3.9%<br />
3,149 to<br />
3,712<br />
3,149 to<br />
3,712<br />
SR 242 On-Ramp to Monument Blvd. On-<br />
Ramp<br />
1.01 B (B) B (B) F (C) C (C) 119,800 119,800 3.2% 5,623 5,623<br />
Contra Costa Blvd. On-Ramp to<br />
Sunnyvale Ave./N Main St. Off-Ramp<br />
0.81 B (A) C (B) F (C) C (C)<br />
122,900 to<br />
137,400<br />
122,900 to<br />
137,400<br />
3.2%<br />
5,768 to<br />
6,449<br />
5,768 to<br />
6,449<br />
Sunnyvale Ave./N Main St. Off-Ramp to<br />
Treat Blvd. On-Ramp<br />
0.49<br />
C (B) F (C) C (C) 138,000 138,000 3.2% 6,477 6,477<br />
Treat Blvd. On-Ramp to San Luis Rd./N<br />
Main St. Off-Ramp<br />
0.80<br />
C (B) F (C) F (C)<br />
127,600 to<br />
141,400<br />
128,200 to<br />
141,400<br />
3.2%<br />
5,989 to<br />
6,636<br />
6,017 to<br />
6,636<br />
San Luis Rd./N Main St. On-Ramp to SR<br />
24 Off-Ramp<br />
0.48 N/A C (B) F (F) F (C)<br />
125,400 to<br />
132,000<br />
126,200 to<br />
132,800<br />
4.0%<br />
5,886 to<br />
6,195<br />
5,923 to<br />
6,233<br />
SR 24 Off-Ramp to Olympic Blvd. Off-<br />
Ramp<br />
1.35<br />
B (B) F (F) F (C)<br />
75,500 to<br />
90,400<br />
76,300 to<br />
91,200<br />
5.8%<br />
3,544 to<br />
4,243<br />
3,581 to<br />
4,280<br />
SR 24 On-Ramp to S Main St. Off-Ramp 0.69<br />
B (C) F (F) F (F)<br />
102,200 to<br />
107,200<br />
102,500 to<br />
107,500<br />
5.8%<br />
4,797 to<br />
5,031<br />
4,811 to<br />
5,045<br />
S Main St. Off-Ramp to Rudgear Rd. On-<br />
Ramp<br />
0.47 B (C) B (C) F (F) F (F)<br />
95,900 to<br />
99,600<br />
96,100 to<br />
99,800<br />
5.8%<br />
4,501 to<br />
4,675<br />
4,510 to<br />
4,684<br />
Rudgear Road On-Ramp to Livorna Rd.<br />
Off-Ramp<br />
1.33 B (C) B (C) F (F) E (F) 105,800 106,000 5.8% 4,966 4,975<br />
Livorna Rd. On-Ramp to Stone Valley Rd.<br />
Off-Ramp<br />
0.91 B (C) B (C) F (E) F (E) 105,100 105,200 5.8% 4,933 4,937<br />
Stone Valley Rd. Off-Ramp to El Pintado<br />
Rd. Off-Ramp<br />
1.62<br />
B (C) B (C) F (E) E (E)<br />
98,400 to<br />
105,200<br />
98,500 to<br />
105,300<br />
5.8%<br />
4,618 to<br />
4,937<br />
4,623 to<br />
4,942<br />
SOURCES: Caltrans, 2012; Fehr & Peers, 2012a, 2012b
<strong>Project</strong> <strong>Assessment</strong> <strong>Form</strong> <strong>for</strong> <strong>PM2</strong>.5 Interagency Consultation<br />
RTP Horizon Year / Design Year: If facility is a highway or street, Build and No Build LOS, AADT, % and #<br />
trucks, truck AADT of proposed facility<br />
PREDICTED I-680 SB PEAK HOUR LEVEL OF SERVICE (LOS) & ANNUAL AVERAGE DAILY TRAFFIC (ADT): YEAR 2040*<br />
Peak Hour LOS: AM (PM) AADT<br />
All Lanes<br />
Assigned<br />
Mixed Flow<br />
Proportion<br />
Segment HOV Lanes Lanes<br />
Total of Trucks to Trucks<br />
Segment Length No Build Build No Build Build No Build Build Total No Build Build<br />
Concord Ave. On-Ramp to Willow Pass<br />
Rd. Off-Ramp<br />
0.62 F (A) F (A) F (F) F (F) 91,000 91,000 3.9% 4,271 4,271<br />
Willow Pass Rd. On-Ramp to Gregory<br />
Lane Off-Ramp<br />
0.09 F (B) F (B) F (F) F (F)<br />
84,200<br />
91,200<br />
84,200<br />
91,200<br />
3.9%<br />
3,952 to<br />
4,280<br />
3,952 to<br />
4,280<br />
Gregory Lane Off-Ramp to SR 242 On-<br />
Ramp<br />
0.44 F (A) F (A) F (F) F (F) 76,500 76,500 3.9% 3,590 3,590<br />
SR 242 On-Ramp to Monument Blvd. On-<br />
Ramp<br />
1.01 F (B) F (B) F (F) F (F) 142,900 142,900 3.2% 6,707 6,707<br />
Contra Costa Blvd. On-Ramp to<br />
Sunnyvale Ave./N Main St. Off-Ramp<br />
Sunnyvale Ave./N Main St. On-Ramp to<br />
Treat Blvd. On-Ramp<br />
Treat Blvd. On-Ramp to San Luis Rd./N<br />
Main St. Off-Ramp<br />
San Luis Rd./N Main St. On-Ramp to SR<br />
24 Off-Ramp<br />
SR 24 Off-Ramp to Ygnacio Valley Rd. On-<br />
Ramp<br />
Ygnacio Valley Rd. On-Ramp to Olympic<br />
Blvd. Off-Ramp<br />
SR 24 On-Ramp to Olympic Blvd. On-<br />
Ramp<br />
Olympic Blvd. On-Ramp to S Main St. Off-<br />
Ramp<br />
S Main St. Off-Ramp to Rudgear Rd. On-<br />
Ramp<br />
Rudgear Road On-Ramp to Livorna Rd.<br />
Off-Ramp<br />
Livorna Rd. On-Ramp to Stone Valley Rd.<br />
Off-Ramp<br />
Stone Valley Rd. Off-Ramp to El Pintado<br />
Rd. Off-Ramp<br />
Note: * Horizon Year <strong>for</strong> currently-adopted MTC RTP is 2035.<br />
SOURCES: Caltrans, 2012; Fehr & Peers, 2012a, 2012b<br />
0.81 F (B) E (C) F (F) F (F) 164,200 164,200 3.2%<br />
0.49 F (C) F (F) F (F)<br />
0.80 E (C) F (F) F (F)<br />
1.07 F (B) F (F)<br />
7,707 7,707<br />
7,566 7,566<br />
149,700 153,300 7,026 to 7,195 to<br />
3.2%<br />
164,700 164,700 7,730 7,730<br />
0.48 D (C) F (F) F (F) 156,800 161,400 4.0%<br />
0.28 N/A B (B) F (F) F (F)<br />
161,200 161,200 3.2%<br />
88,300<br />
92,900<br />
7,359 7,575<br />
4,144 4,360<br />
4,952 5,167<br />
6,191 6,256<br />
6,439 6,505<br />
125,300 125,900 5,881 to 5,909 to<br />
5.8%<br />
131,300 131,900 6,162 6,191<br />
133,000 133,000 6,242 to 6,242 to<br />
1.62 E (E) E (E) E (E) E (E) 5.8%<br />
140,200 140,200 6,580 6,580<br />
5.8%<br />
F (F) 105,500 110,100 5.8%<br />
0.49 F (C) F (F) F (F) 131,900 133,300 5.8%<br />
0.20 F (C) F (F) F (F) 137,200 138,600 5.8%<br />
0.47 F (F) F (F) F (F) F (F)<br />
1.33 F (F) F (F) F (F) F (F) 138,600 139,200 5.8%<br />
6,505 6,533<br />
0.91 E (E) E (F) E (F) E (F) 144,700 144,700 5.8% 6,791 6,791<br />
Opening Year: If facility is an interchange(s) or intersection(s), Build and No Build cross-street AADT, %<br />
and # trucks, truck AADT<br />
N/A<br />
RTP Horizon Year / Design Year: If facility is an interchange (s) or intersection(s), Build and No Build crossstreet<br />
AADT, % and # trucks, truck AADT<br />
N/A<br />
Opening Year: If facility is a bus, rail or intermodal facility/terminal/transfer point, # of bus arrivals <strong>for</strong> Build<br />
and No Build, % and # of bus arrivals will be diesel buses<br />
N/A<br />
RTP Horizon Year / Design Year: If facility is a bus, rail or intermodal facility/terminal/transfer point, # of bus<br />
arrivals <strong>for</strong> Build and No Build, % and # of bus arrivals will be diesel buses<br />
N/A<br />
Describe potential traffic redistribution effects of congestion relief (impact on other facilities)<br />
The project closes a gap in the HOV system in the center of the study corridor, but does not change the<br />
capacity of the freeway at either the beginning or end of the corridor, so it does not result in a significant<br />
change in the overall demand <strong>for</strong> traffic entering the study area. This is illustrated by comparing<br />
predicted No Build and corresponding Build AADTs shown in the tables above. Accordingly, changes to<br />
demand along potential alternate travel routes outside of the study corridor would also be expected to<br />
be minor.
<strong>PM2</strong>.5 <strong>Project</strong> <strong>Assessment</strong> <strong>Form</strong> <strong>for</strong> Interagency Consultation<br />
Comments/Explanation/Details (please be brief)<br />
Background<br />
− The Administrative Draft Initial Study/Environmental <strong>Assessment</strong> (IS/EA) is currently scheduled<br />
<strong>for</strong> completion in mid-December 2012. Accordingly, CCTA and its environmental process<br />
would greatly benefit from consideration of the project at the December 6 AQCTF Meeting.<br />
− The Draft IS/EA is scheduled to be circulated in mid-February 2013<br />
− CCTA is seeking a final project-level air quality con<strong>for</strong>mity determination by mid-November<br />
2013, the currently-planned date <strong>for</strong> Caltrans approval of a FONSI as appropriate.<br />
Lead Agency Determination Regarding Whether or Not the <strong>Project</strong> is a <strong>Project</strong> of Air<br />
Quality Concern (POAQC) [40 CFR 93.123(b)(1)]<br />
(i) New or expanded highway projects with significant number/increase in diesel vehicles?<br />
− As the preceding tables show, proportions of Caltrans-identified trucks (a reasonable<br />
representation of “diesel vehicles”) are estimated to vary from about 3 to 6 percent along the<br />
project study corridor with or without the project. This compares with 8 percent (based on<br />
125,000 total vehicles) <strong>for</strong> a “…project on a new highway or expressway…” from the first<br />
example of a POAQC presented in the EPA’s Quantitative Hot-spot guidance document. Most<br />
importantly, the current project would not be “…on a new highway or expressway…”<br />
− Predicted project-generated increases in total I-680 AADT are negligible where such increases<br />
are predicted at all. Assuming that those increases are proportionally distributed among trucks<br />
and other on-road vehicles, project-related increases in trucks would also be negligible.<br />
(ii) Affects intersections at LOS D, E, or F with a significant number of diesel vehicles?<br />
− As demonstrated above, the project is expected to result in only very minor redistributions of<br />
traffic. Predicted redistributions would have a very minor influence on the function of nearby<br />
roadway intersections, with negligible implications <strong>for</strong> near-intersection <strong>PM2</strong>.5 concentrations.<br />
− As discussed under (i), truck percentages along I-680 within the study corridor are relatively low<br />
in the context of the range of truck percentages along state highways.<br />
− As discussed in the response provided in the “Surrounding Land Use/Traffic Generators” field of<br />
this <strong>for</strong>m, no nearby, substantial truck-generating land uses – either existing, planned, or<br />
proposed -- were identified within or immediately adjacent to the study area.<br />
(iii) New bus and rail terminals and transfer points?<br />
- Not Applicable<br />
(iv) Expanded bus and rail terminals and transfer points?<br />
- Not Applicable<br />
(v) Affects areas identified in PM10 or <strong>PM2</strong>.5 implementation plan as site of violation?<br />
− Per 77 FR 65521- 65526 (October 29, 2012): “EPA is proposing to determine that the San<br />
Francisco Bay Area…has attained the 2006 24-hour .<strong>PM2</strong>.5…(NAAQS).” This proposed<br />
determination is based on 2009-2011 monitoring data that demonstrate no violations.<br />
− The most recent BAAQMD air quality plan that identified potential violations of the 2006 <strong>PM2</strong>.5<br />
NAAQS was the Bay Area 2010 Clean Air Plan. It reported a 2008 design value <strong>for</strong> <strong>PM2</strong>.5 of 36<br />
μg/m3, 1 μg/m3 over the NAAQS. That value represented the Vallejo monitoring station, over<br />
15 miles from the project study corridor; no other monitoring station in the San Francisco Bay<br />
Area was found to be in violation at that time.<br />
For these reasons, CCTA has concluded that the project is not a POAQC.
<strong>Project</strong> <strong>Assessment</strong> <strong>Form</strong> <strong>for</strong> <strong>PM2</strong>.5 Interagency Consultation<br />
ATTACHM ENT 1
<strong>PM2</strong>.5 <strong>Project</strong> <strong>Assessment</strong> <strong>Form</strong> <strong>for</strong> Interagency Consultation<br />
ATTACHM ENT 2