SFO's Strategic Plan to Improve On-Time Performanc
SFO's Strategic Plan to Improve On-Time Performanc
SFO's Strategic Plan to Improve On-Time Performanc

Create successful ePaper yourself
Turn your PDF publications into a flip-book with our unique Google optimized e-Paper software.
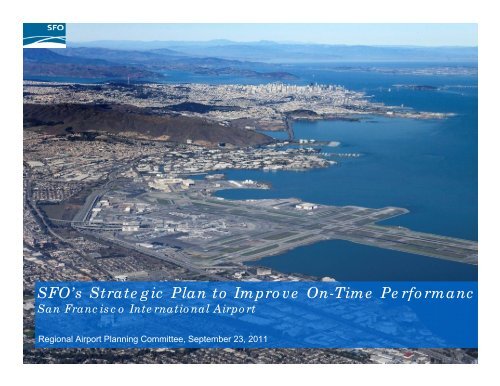
SFO’s <strong>Strategic</strong> <strong>Plan</strong> <strong>to</strong> <strong>Improve</strong> <strong>On</strong>-<strong>Time</strong> <strong>Performanc</strong><br />
San Francisco International Airport<br />
Regional Airport <strong>Plan</strong>ning Committee, September 23, 2011
Presentation Topics<br />
His<strong>to</strong>ry of SFO’s weather related delay problems<br />
Causes of delay and low airline on-time performance<br />
<strong>Strategic</strong> <strong>Plan</strong> Initiatives <strong>to</strong> improve airline on-time performance<br />
Next steps<br />
1
His<strong>to</strong>ry of SFO’s weather-related delay problems<br />
SFO has a unique delay problem<br />
• Combination of its runway configuration, local weather patterns, and airline<br />
scheduling practices<br />
• Marine climate makes low ceilings/visibility frequent and unpredictable<br />
• When scheduled arrivals exceed bad weather runway capacity, delays<br />
inevitably result<br />
SFO’s chronic poor on-time performance had improved<br />
significantly as demand dropped following 9/11<br />
• <strong>On</strong>-time performance previously lagged behind the national average and<br />
was among the worst compared <strong>to</strong> other U.S. airports<br />
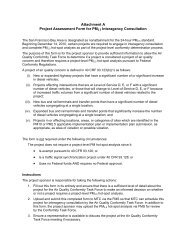
As traffic growth has returned, SFO’s on-time performance has<br />
again lagged the national average, particularly in the winter<br />
2
Average Annual <strong>On</strong>‐<strong>Time</strong> Arrival Percent<br />
90%<br />
85%<br />
80%<br />
75%<br />
70%<br />
65%<br />
60%<br />
55%<br />
50%<br />
Average Annual <strong>On</strong>‐<strong>Time</strong> Arrival Percent: Major U.S. Airports vs. SFO<br />
Average of <strong>to</strong>p 35 U.S. Airports<br />
San Francisco International Airport<br />
1998 1999 2000 2001 2002 2003 2004 2005 2006 2007 2008 2009 2010 2011<br />
Calendar Year<br />
3<br />
Source: FAA Airline Service Quality <strong>Performanc</strong>e, 1998-2011.
Causes of delay and low airline on-time performance<br />
Weather variability<br />
Decreased arrival capacity in bad weather<br />
Airline scheduling – especially during peak morning periods<br />
Airline fleet mix choices – more flights with smaller aircraft vs.<br />
fewer flights with larger aircraft<br />
4
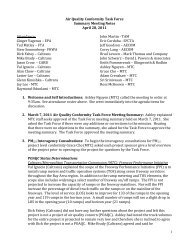
Average Annual Weather Conditions<br />
Good Weather<br />
74.1%<br />
5<br />
14.2%<br />
6.0%<br />
5.7%<br />
Marginal Weather<br />
Bad Weather<br />
Landing on Runways<br />
other than 28L/R
Bad morning weather followed by periods of recovery are one<br />
cause of delays<br />
Even in the best weather year, the Airport experienced bad<br />
weather on approximately 1/3 of the days<br />
In an average year, the Airport experiences bad weather on<br />
approximately 50% of all days<br />
Most common type of “bad weather” continues <strong>to</strong> be “bad<br />
morning weather”<br />
6
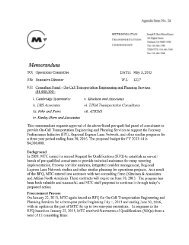
% of Bad Morning<br />
Weather Days<br />
<strong>On</strong> “bad morning weather” days, conditions usually clear by late morning<br />
Distribution of “burnoff” hour – 1996 <strong>to</strong> 2005<br />
25%<br />
20%<br />
15%<br />
10%<br />
5%<br />
0%<br />
8:00 9:00 10:00 11:00 12:00 13:00 14:00 15:00 16:00 17:00<br />
Burnoff Hour<br />
7
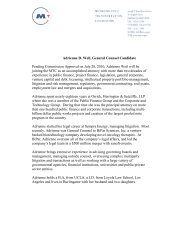
The combination of weather and scheduling patterns makes the<br />
8AM-1PM period the key <strong>to</strong> addressing the coming delay problem<br />
Hourly Arrivals<br />
50<br />
45<br />
40<br />
35<br />
30<br />
25<br />
20<br />
15<br />
10<br />
5<br />
0<br />
12:00 AM<br />
1:00 AM<br />
August 19, 2010<br />
2013 Forecast<br />
Marginal Weather Capacity<br />
Bad Weather Capacity<br />
2:00 AM<br />
3:00 AM<br />
4:00 AM<br />
5:00 AM<br />
6:00 AM<br />
8:00a.m. – 1:00p.m.<br />
7:00 AM<br />
8:00 AM<br />
9:00 AM<br />
10:00 AM<br />
11:00 AM<br />
12:00 PM<br />
8<br />
1:00 PM<br />
2:00 PM<br />
3:00 PM<br />
4:00 PM<br />
5:00 PM<br />
6:00 PM<br />
7:00 PM<br />
8:00 PM<br />
9:00 PM<br />
10:00 PM<br />
11:00 PM
SFO Scheduled Passenger Departures by Aircraft Type<br />
Calendar Year-Over-Year<br />
9<br />
Narrow Body<br />
Commuter<br />
Wide Body
Variability in Seats per Operation<br />
Average seats per operation for domestic airlines for domestic<br />
flights only and for domestic/international flights combined<br />
(2010 OAG data):<br />
Airline<br />
Average Seats<br />
(Dom only)<br />
10<br />
Average Seats<br />
(Intl+Dom)<br />
Airtran Airways (FL) 137.0 137.0<br />
American Airlines (AA) 166.7 166.7<br />
Alaska Airlines (AS) 131.3 133.5<br />
Continental Airlines (CO) 158.9 158.9<br />
Delta Air Lines (DL) 145.7 147.4<br />
Frontier Airlines (F9) 117.0 117.0<br />
Hawaiian Airlines (HA) 252.0 252.0<br />
JetBlue Airways (B6) 150.0 150.0<br />
Southwest Airlines (WN) 136.6 136.6<br />
Sun Country Airlines (SY) 129.0 129.0<br />
United Airlines (UA) 90.1 100.8<br />
US Airways (US) 152.2 152.2<br />
Virgin America (VX) 136.5 136.8
<strong>Strategic</strong> <strong>Plan</strong> Initiatives <strong>to</strong> <strong>Improve</strong> Airline <strong>On</strong>-<strong>Time</strong><br />
<strong>Performanc</strong>e<br />
<strong>Strategic</strong> <strong>Plan</strong> goal is <strong>to</strong> consistently maintain at least 75% on-time<br />
arrival performance<br />
<strong>Strategic</strong> <strong>Plan</strong> Initiatives include the following:<br />
• Rapid pursuit of NextGen and other technology<br />
• Regional airport system planning<br />
• FAA and airline collaboration<br />
11
Rapid pursuit of NextGen and other technology<br />
Collaboration for Incremental<br />
<strong>Improve</strong>ments<br />
– Reducing SOIA minima<br />
– Take advantage of new wake rules (.308)<br />
– Potential for new RNAV procedures<br />
– Future concepts for RNP and ADS-B<br />
applications<br />
Impact mitigations and collaboration<br />
during construction<br />
Providing transparency, analysis and<br />
data needed <strong>to</strong> help make informed<br />
decisions<br />
12
Staggered CSPROs Under<br />
FAA Order 7110.308<br />
FAAO 7110.65, paragraph<br />
5-9-6, limits the use of<br />
parallel dependent ILS<br />
approaches <strong>to</strong> parallel<br />
runways separated by at<br />
least 2,500 feet<br />
FAA Order 7110.308<br />
allows the use of such<br />
approaches at specific<br />
airports with parallel<br />
runways separated by<br />
less than 2,500 feet.<br />
15
Staggered CSPROs Under<br />
FAA Order 7110.308<br />
16
RNAV Offset<br />
17
RNAV Offset<br />
01L 01L<br />
01R<br />
01R<br />
18<br />
28R<br />
28L 28L 28R
Potential Near Term Concepts<br />
6-36 months (draft)<br />
Increased<br />
Dual Runway<br />
Availability<br />
6 months 12 months 18 months 36 months<br />
AM<br />
4.7 %<br />
3.2%<br />
All Day<br />
.308 with offset<br />
options;<br />
behind Large a/c;<br />
Cat I minima<br />
RNAV Vertical<br />
Offset<br />
0.5 nmi stagger<br />
Physical Offset<br />
28.1%<br />
14.9 %<br />
19<br />
15.1%<br />
9%
Potential Near Term Concepts 6-36 months (draft)<br />
These concepts would deliver more use of existing runways when<br />
SFO has bad or marginal weather – reducing delays and improving<br />
on-time performance<br />
Concept<br />
SOIA<br />
<strong>Improve</strong>ments<br />
FAA Joint Order<br />
7110.308<br />
Projected<br />
<strong>Time</strong>frame<br />
RNAV Step 1 18 months<br />
RNAV Step 2 24 months<br />
RNAV Step 3 36 months<br />
20<br />
Estimated Increased Dual<br />
Arrival Runway Availability<br />
During AM Peak<br />
Period All Day<br />
6 months 4.7% 3.2%<br />
12 months 28.1% 14.9%<br />
15.1% 9.0%
Regional System <strong>Plan</strong> Update<br />
Regional System <strong>Plan</strong> Update includes the following<br />
recommendations:<br />
• Encourage redistribution of domestic air passenger demand from SFO <strong>to</strong><br />
OAK and SJC<br />
• Increased use of Sonoma County Airport <strong>to</strong> serve local air passenger<br />
demand<br />
• A robust demand management program at SFO<br />
21
Collaboration with airlines<br />
Goals:<br />
• Limit delay in the morning hours<br />
• Maintain a level playing field<br />
• Encourage use of larger aircraft<br />
• Preserve/protect air service <strong>to</strong> small communities<br />
• Recognize SFO will require unique solutions<br />
Example: Potential Flight Consolidation Scenarios<br />
• Consolidating flights on<strong>to</strong> larger aircraft (e.g., turboprops up-gauged <strong>to</strong> regional<br />
jets and regional jets up-gauged <strong>to</strong> mainline jets) while maintaining the same<br />
level of service (i.e., number of daily seats from each origin) could reduce arrival<br />
demand during the busy morning peak period by between 6.2% and 8.4%<br />
reducing delays by as much as 18% <strong>to</strong> 25%.<br />
• Consolidating only flights by small aircraft from Large and Medium hub airports<br />
could reduce arrival demand during the busy morning peak period by 4.4%<br />
reducing delays by as much as 11%.<br />
22
Next Steps<br />
Continue meeting quarterly with the FAA and airlines on measures<br />
<strong>to</strong> enhance efficiency and better match demand <strong>to</strong> capacity<br />
• Last meeting of the SFO Delay Forum held 6/2/2011<br />
• Next meeting scheduled for 9/27/2011<br />
Continue <strong>to</strong> support regional airport system planning work in<strong>to</strong> the<br />
implementation phase<br />
Work directly with airlines <strong>to</strong> look for opportunities <strong>to</strong> adjust fleet<br />
mix choices <strong>to</strong> make better use of limited airfield resources – Fly<br />
Efficient Report<br />
24