

Etude de bruit de fond induit par les muons dans l'expérience ...
Etude de bruit de fond induit par les muons dans l'expérience ...
Etude de bruit de fond induit par les muons dans l'expérience ...

You also want an ePaper? Increase the reach of your titles
YUMPU automatically turns print PDFs into web optimized ePapers that Google loves.
tel-00724955, version 1 - 23 Aug 2012<br />
6<br />
122 Analysis of Run 10<br />
rate (event / 8 hr file)<br />
0.4<br />
0.35<br />
0.3<br />
0.25<br />
0.2<br />
0.15<br />
0.1<br />
0.05<br />
0<br />
15/07<br />
2008<br />
84.3 d<br />
all data<br />
without the overflow<br />
29/07<br />
2008<br />
12/08<br />
2008<br />
26/08<br />
2008<br />
09/09<br />
2008<br />
23/09<br />
2008<br />
all data<br />
07/10<br />
2008<br />
21/10<br />
2008<br />
rate (event / 8 hr file)<br />
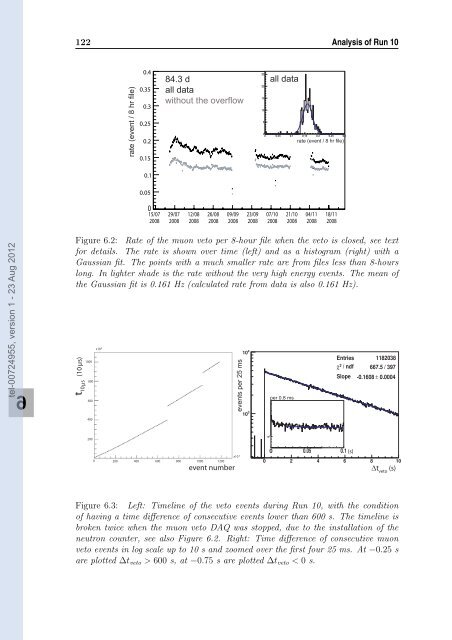
Figure 6.2: Rate of the muon veto per 8-hour file when the veto is closed, see text<br />
for <strong>de</strong>tails. The rate is shown over time (left) and as a histogram (right) with a<br />
Gaussian fit. The points with a much smaller rate are from fi<strong>les</strong> <strong>les</strong>s than 8-hours<br />
long. In lighter sha<strong>de</strong> is the rate without the very high energy events. The mean of<br />
the Gaussian fit is 0.161 Hz (calculated rate from data is also 0.161 Hz).<br />
t t10µs (10 µs)<br />
10µs (10 µs)<br />
1000<br />
800<br />
600<br />
400<br />
200<br />
x10 9<br />
0 200<br />
400 600 800 1000 1200<br />
event number<br />
events per 25 ms<br />
x10 3<br />
per 0.8 ms<br />
04/11<br />
2008<br />
18/11<br />
2008<br />
(s)<br />
∆t veto (s)<br />
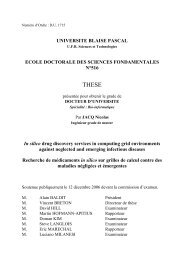
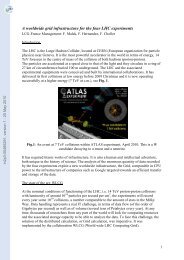
Figure 6.3: Left: Timeline of the veto events during Run 10, with the condition<br />
of having a time difference of consecutive events lower than 600 s. The timeline is<br />
broken twice when the muon veto DAQ was stopped, due to the installation of the<br />
neutron counter, see also Figure 6.2. Right: Time difference of consecutive muon<br />
veto events in log scale up to 10 s and zoomed over the first four 25 ms. At −0.25 s<br />
are plotted ∆tveto > 600 s, at −0.75 s are plotted ∆tveto < 0 s.

![[in2p3-00383985, v1] NUCLEAR PHYSICS at GANIL ... - HAL - IN2P3](https://img.yumpu.com/19016755/1/185x260/in2p3-00383985-v1-nuclear-physics-at-ganil-hal-in2p3.jpg?quality=85)
![[tel-00752304, v1] Pions réels et virtuels dans les noyaux](https://img.yumpu.com/19016523/1/184x260/tel-00752304-v1-pions-reels-et-virtuels-dans-les-noyaux.jpg?quality=85)