

Etude de bruit de fond induit par les muons dans l'expérience ...
Etude de bruit de fond induit par les muons dans l'expérience ...
Etude de bruit de fond induit par les muons dans l'expérience ...

Create successful ePaper yourself
Turn your PDF publications into a flip-book with our unique Google optimized e-Paper software.
tel-00724955, version 1 - 23 Aug 2012<br />
6<br />
132 Analysis of Run 10<br />
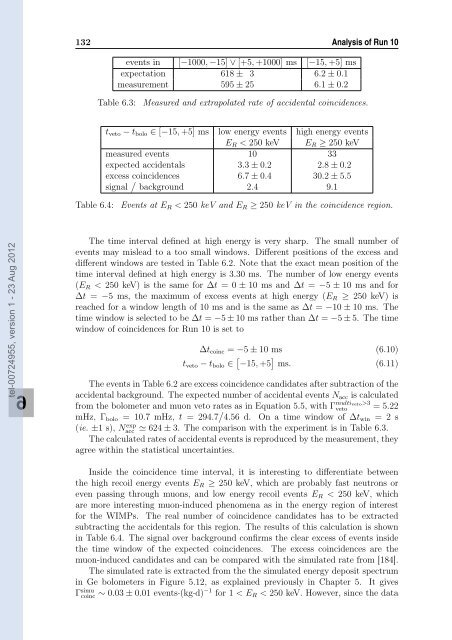
events in [−1000, −15] ∨ [+5, +1000] ms [−15, +5] ms<br />
expectation 618 ± 3 6.2 ± 0.1<br />
measurement 595 ± 25 6.1 ± 0.2<br />
Table 6.3: Measured and extrapolated rate of acci<strong>de</strong>ntal coinci<strong>de</strong>nces.<br />
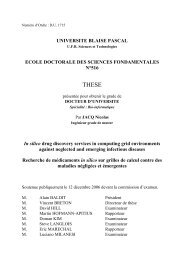
tveto − tbolo ∈ [−15, +5] ms low energy events high energy events<br />
ER < 250 keV ER ≥ 250 keV<br />
measured events 10 33<br />
expected acci<strong>de</strong>ntals 3.3 ± 0.2 2.8 ± 0.2<br />
excess coinci<strong>de</strong>nces 6.7 ± 0.4 30.2 ± 5.5<br />
signal background 2.4 9.1<br />
Table 6.4: Events at ER < 250 keV and ER ≥ 250 keV in the coinci<strong>de</strong>nce region.<br />
The time interval <strong>de</strong>fined at high energy is very sharp. The small number of<br />
events may mislead to a too small windows. Different positions of the excess and<br />
different windows are tested in Table 6.2. Note that the exact mean position of the<br />
time interval <strong>de</strong>fined at high energy is 3.30 ms. The number of low energy events<br />
(ER < 250 keV) is the same for ∆t = 0 ± 10 ms and ∆t = −5 ± 10 ms and for<br />
∆t = −5 ms, the maximum of excess events at high energy (ER ≥ 250 keV) is<br />
reached for a window length of 10 ms and is the same as ∆t = −10 ± 10 ms. The<br />
time window is selected to be ∆t = −5 ± 10 ms rather than ∆t = −5 ± 5. The time<br />
window of coinci<strong>de</strong>nces for Run 10 is set to<br />
∆tcoinc = −5 ± 10 ms (6.10)<br />
tveto − tbolo ∈ −15, +5 ms. (6.11)<br />
The events in Table 6.2 are excess coinci<strong>de</strong>nce candidates after subtraction of the<br />
acci<strong>de</strong>ntal background. The expected number of acci<strong>de</strong>ntal events Nacc is calculated<br />
from the bolometer and muon veto rates as in Equation 5.5, with Γ multiveto>3<br />
veto = 5.22<br />
mHz, Γbolo = 10.7 mHz, t = 294.7 4.56 d. On a time window of ∆twin = 2 s<br />
(ie. ±1 s), N exp<br />
acc 624 ± 3. The com<strong>par</strong>ison with the experiment is in Table 6.3.<br />
The calculated rates of acci<strong>de</strong>ntal events is reproduced by the measurement, they<br />
agree within the statistical uncertainties.<br />
Insi<strong>de</strong> the coinci<strong>de</strong>nce time interval, it is interesting to differentiate between<br />
the high recoil energy events ER ≥ 250 keV, which are probably fast neutrons or<br />
even passing through <strong>muons</strong>, and low energy recoil events ER < 250 keV, which<br />
are more interesting muon-induced phenomena as in the energy region of interest<br />
for the WIMPs. The real number of coinci<strong>de</strong>nce candidates has to be extracted<br />
subtracting the acci<strong>de</strong>ntals for this region. The results of this calculation is shown<br />
in Table 6.4. The signal over background confirms the clear excess of events insi<strong>de</strong><br />
the time window of the expected coinci<strong>de</strong>nces. The excess coinci<strong>de</strong>nces are the<br />
muon-induced candidates and can be com<strong>par</strong>ed with the simulated rate from [184].<br />
The simulated rate is extracted from the the simulated energy <strong>de</strong>posit spectrum<br />
in Ge bolometers in Figure 5.12, as explained previously in Chapter 5. It gives<br />
Γsimu coinc ∼ 0.03 ± 0.01 events·(kg·d) −1 for 1 < ER < 250 keV. However, since the data

![[in2p3-00383985, v1] NUCLEAR PHYSICS at GANIL ... - HAL - IN2P3](https://img.yumpu.com/19016755/1/185x260/in2p3-00383985-v1-nuclear-physics-at-ganil-hal-in2p3.jpg?quality=85)
![[tel-00752304, v1] Pions réels et virtuels dans les noyaux](https://img.yumpu.com/19016523/1/184x260/tel-00752304-v1-pions-reels-et-virtuels-dans-les-noyaux.jpg?quality=85)