

The reference price system and socioeconomic differences in ... - KCE
The reference price system and socioeconomic differences in ... - KCE
The reference price system and socioeconomic differences in ... - KCE

Create successful ePaper yourself
Turn your PDF publications into a flip-book with our unique Google optimized e-Paper software.
34 Reference Price System <strong>KCE</strong> reports 126<br />
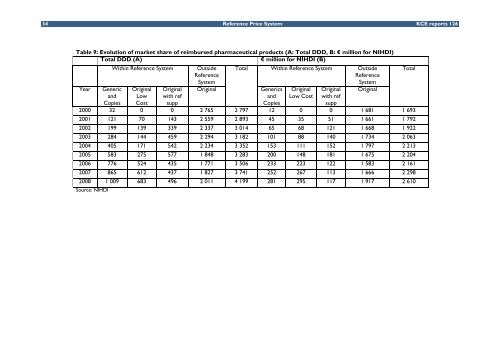
Table 9: Evolution of market share of reimbursed pharmaceutical products (A: Total DDD, B: € million for NIHDI)<br />
Total DDD (A) € million for NIHDI (B)<br />
Year Generic<br />
<strong>and</strong><br />
Copies<br />
With<strong>in</strong> Reference System Outside<br />
Reference<br />
Orig<strong>in</strong>al<br />
Low<br />
Cost<br />
Orig<strong>in</strong>al<br />
with ref<br />
supp<br />
System<br />
Total With<strong>in</strong> Reference System Outside<br />
Reference<br />
Orig<strong>in</strong>al Generics<br />
<strong>and</strong><br />
Copies<br />
Orig<strong>in</strong>al<br />
Low Cost<br />
Orig<strong>in</strong>al<br />
with ref<br />
supp<br />
System<br />
Orig<strong>in</strong>al<br />
2000 32 0 0 2 765 2 797 12 0 0 1 681 1 693<br />
2001 121 70 143 2 559 2 893 45 35 51 1 661 1 792<br />
2002 199 139 339 2 337 3 014 65 68 121 1 668 1 922<br />
2003 284 144 459 2 294 3 182 101 88 140 1 734 2 063<br />
2004 405 171 542 2 234 3 352 153 111 152 1 797 2 213<br />
2005 583 275 577 1 848 3 283 200 148 181 1 675 2 204<br />
2006 776 524 435 1 771 3 506 233 223 122 1 583 2 161<br />
2007 865 612 437 1 827 3 741 252 267 113 1 666 2 298<br />
2008 1 009 683 496 2 011 4 199 281 295 117 1 917 2 610<br />
Source: NIHDI<br />
Total


