Uncertainty in the Demand for Service - Faculty of Industrial ...
Uncertainty in the Demand for Service - Faculty of Industrial ...
Uncertainty in the Demand for Service - Faculty of Industrial ...

You also want an ePaper? Increase the reach of your titles
YUMPU automatically turns print PDFs into web optimized ePapers that Google loves.
<strong>Uncerta<strong>in</strong>ty</strong> <strong>in</strong> <strong>the</strong> <strong>Demand</strong> <strong>for</strong> <strong>Service</strong>:<br />
The Case <strong>of</strong> Call Centers and Emergency Departments<br />
M.Sc. Research Proposal<br />
Shimrit Maman<br />
Advisor: Pr<strong>of</strong>. Avishai Mandelbaum<br />
The <strong>Faculty</strong> Of <strong>Industrial</strong> Eng<strong>in</strong>eer<strong>in</strong>g and Management<br />
Technion - Israel Institute <strong>of</strong> Technology<br />
April 15, 2007<br />
1
1 Introduction<br />
Dur<strong>in</strong>g <strong>the</strong> last century and <strong>the</strong> beg<strong>in</strong>n<strong>in</strong>g <strong>of</strong> <strong>the</strong> current one, <strong>the</strong> service sector has grown significantly<br />
and now accounts <strong>for</strong> approximately 70% <strong>of</strong> <strong>the</strong> national <strong>in</strong>come <strong>in</strong> <strong>the</strong> United States.<br />
The service sector covers a wide spectrum <strong>of</strong> activities, e.g. education, pr<strong>of</strong>essional services,<br />
f<strong>in</strong>ancial services and government services. In this <strong>the</strong>sis we focus on telephone call centers and<br />
on <strong>the</strong> health care system.<br />
Call centers are very commonly used by companies and organizations <strong>for</strong> manag<strong>in</strong>g <strong>the</strong>ir customer<br />
relationships. This covers both <strong>the</strong> public and private sector. For some <strong>of</strong> <strong>the</strong> companies,<br />
such as banks and cellular operators, <strong>the</strong>ir call centers are <strong>the</strong> ma<strong>in</strong> channel <strong>for</strong> ma<strong>in</strong>ta<strong>in</strong><strong>in</strong>g contact<br />
with <strong>the</strong>ir customers. In general, call centers are becom<strong>in</strong>g a vital part <strong>of</strong> <strong>the</strong> service-driven<br />
society nowadays. As a result call centers have also become an object <strong>for</strong> academic research.<br />
For <strong>the</strong> analysis <strong>of</strong> call centers operations, queue<strong>in</strong>g <strong>the</strong>ory and statistics are be<strong>in</strong>g used. The<br />
problems that call centers operators are deal<strong>in</strong>g with, are <strong>of</strong>ten related to statistical characteristics<br />
<strong>of</strong> <strong>the</strong> calls arrival and handl<strong>in</strong>g processes. Very <strong>of</strong>ten, about 70% <strong>of</strong> <strong>the</strong> operations costs<br />
are devoted to human resources. As a result, <strong>for</strong>ecast<strong>in</strong>g <strong>the</strong> calls arrival rate, understand<strong>in</strong>g <strong>the</strong><br />
handl<strong>in</strong>g process, sett<strong>in</strong>g <strong>the</strong> right service per<strong>for</strong>mance measures and staff<strong>in</strong>g levels, are central<br />
problems at all call centers. These are issues that any call center manager deals with on a daily<br />
basis.<br />
Ano<strong>the</strong>r important area <strong>of</strong> <strong>the</strong> service sector is <strong>the</strong> health care system. Hospital managers<br />
are <strong>in</strong>creas<strong>in</strong>gly aware <strong>of</strong> <strong>the</strong> need to use <strong>the</strong>ir resources as efficiently as possible <strong>in</strong> order to<br />
cont<strong>in</strong>ue to assure <strong>the</strong>ir <strong>in</strong>stitutions’ survival and prosperity. Moreover, <strong>the</strong>re is a consistent<br />
pressure, com<strong>in</strong>g from <strong>the</strong> patients, to <strong>in</strong>crease <strong>the</strong> quality <strong>of</strong> care by technique improvements<br />
and medical <strong>in</strong>novations and to shorten <strong>the</strong> sojourn time <strong>in</strong> <strong>the</strong> hospital. Green [6] describes<br />
<strong>the</strong> general background and issues <strong>in</strong>volved <strong>in</strong> hospital capacity plann<strong>in</strong>g and provides examples<br />
<strong>of</strong> how Operations Research models can be used to provide important <strong>in</strong>sights <strong>in</strong>to operational<br />
strategies and practice.<br />
Satisfactory customer service can be def<strong>in</strong>ed <strong>in</strong> many ways, based on various per<strong>for</strong>mance measures.<br />
Focus<strong>in</strong>g on operational measures, a customer enjoys satisfactory service if her delay <strong>in</strong><br />
queue is at most τ seconds [11]. For an emergency medical service system, <strong>the</strong> ma<strong>in</strong> per<strong>for</strong>mance<br />
measure is <strong>the</strong> fraction <strong>of</strong> calls that are reached with<strong>in</strong> some time standard. The response time<br />
is typically considered to beg<strong>in</strong> at <strong>the</strong> <strong>in</strong>stant <strong>the</strong> call was made and end when an ambulance<br />
reaches <strong>the</strong> call address. In North America, a typical target is to reach 90% <strong>of</strong> <strong>the</strong> most urgent<br />
calls with<strong>in</strong> 9 m<strong>in</strong>utes [2]. The measures <strong>of</strong> quality are not absolute. They differ among service<br />
system <strong>in</strong> accordance with <strong>the</strong> system’s goals, its environment and <strong>the</strong> services it <strong>of</strong>fers.<br />
The staff<strong>in</strong>g problem is key <strong>for</strong> provid<strong>in</strong>g satisfactory service. Managers <strong>of</strong> call centers must<br />
decide on how many agents to hire and get to work at any time <strong>in</strong> order to ensure satisfactory<br />
customer service. In emergency medical service and <strong>in</strong> hospitals <strong>the</strong> system is even more complicated.<br />
Staff<strong>in</strong>g consists <strong>of</strong> schedul<strong>in</strong>g decisions <strong>for</strong> ambulances and <strong>the</strong>ir crews, <strong>for</strong> doctors<br />
and nurses and it must also account <strong>for</strong> <strong>the</strong> number <strong>of</strong> <strong>in</strong>patient beds.
<strong>Service</strong> environments are typically very complex. One <strong>of</strong> <strong>the</strong> ma<strong>in</strong> complexity factor is <strong>the</strong><br />
uncerta<strong>in</strong>ty about <strong>the</strong> arrival rate: this uncerta<strong>in</strong>ty arises ei<strong>the</strong>r because <strong>the</strong> parameter value<br />
varies randomly over time or because it is unknown due to lack <strong>of</strong> <strong>in</strong><strong>for</strong>mation. Naturally,<br />
staff<strong>in</strong>g decisions must account <strong>for</strong> all this complexity, yet <strong>the</strong> challenge is to develop staff<strong>in</strong>g<br />
rules that are simple and <strong>in</strong>sightful enough <strong>for</strong> implementation. For example, <strong>the</strong> ”square-root<br />
staff<strong>in</strong>g” rule is such a rule, as will be surveyed below.<br />
Ma<strong>the</strong>matical models have been developed to model <strong>the</strong> complexity <strong>of</strong> <strong>the</strong> call centers environment.<br />
Their strength is <strong>the</strong>ir simplicity and <strong>the</strong> <strong>the</strong>oretical <strong>in</strong>sights <strong>the</strong>y provide. On <strong>the</strong><br />
o<strong>the</strong>r hand, <strong>the</strong>ir model<strong>in</strong>g scope is limited, and an analytical knowledge is needed <strong>in</strong> order to<br />
apply <strong>the</strong>m efficiently. These weaknesses could be <strong>the</strong> reason why <strong>the</strong>se models are not be<strong>in</strong>g<br />
used as <strong>of</strong>ten as expected. The most commonly-used models are <strong>the</strong> M/M/N queue (Erlang-C)<br />
and M/M/N+M queue (Erlang-A), which will be described <strong>in</strong> section 2.<br />
Computer simulation presents an alternative to ma<strong>the</strong>matical models. When created and used<br />
properly, simulation models can handle almost any model complexity and take <strong>in</strong>to account<br />
<strong>the</strong> very small details. There are limitations as well - <strong>the</strong> development and ma<strong>in</strong>tenance <strong>of</strong><br />
simulation models are expensive, and it can take hours to run a simulation even with today’s<br />
comput<strong>in</strong>g capabilities.<br />
A research trend <strong>in</strong> which ma<strong>the</strong>matical models and simulation have been comb<strong>in</strong>ed has recently<br />
emerged. This <strong>in</strong> order to overcome <strong>the</strong> weaknesses and utilize <strong>the</strong> advantages <strong>of</strong> <strong>the</strong> two<br />
methods. This is an approach adopted <strong>in</strong> this <strong>the</strong>sis.<br />
The research proposal is structured as follows. In section 2 we describe some basic models<br />
<strong>of</strong> service systems: (M/M/N and M/M/N+M ), and survey <strong>the</strong> work <strong>of</strong> [4]. In section 3 we<br />
discuss issues related to uncerta<strong>in</strong> arrival rates. A description <strong>of</strong> <strong>the</strong> research that we propose<br />
to undertake is presented <strong>in</strong> section 4.<br />
3
2 Some Basic Models with iid Customers and iid Servers<br />
In this section, <strong>the</strong> two most common models that are used <strong>for</strong> call centers model<strong>in</strong>g and staff<strong>in</strong>g<br />
are presented. The first model is Erlang-C: first developed around 1910 by Erlang [3], it has<br />
served until recently as <strong>the</strong> ”work<strong>in</strong>g-horse” <strong>of</strong> call center staff<strong>in</strong>g. Its ma<strong>in</strong> deficiency is that<br />
it ignores customers’ impatience, which is remedied by <strong>the</strong> second model, namely Erlang-A.<br />
Impatience leads to <strong>the</strong> phenomenon <strong>of</strong> customers’ abandonment, and, already around 1940,<br />
Palm [10] developed Erlang-A <strong>in</strong> order to capture it. We shall be us<strong>in</strong>g Erlang-A to motivate<br />
three operat<strong>in</strong>g regimes <strong>for</strong> medium-to-large call centers: one which emphasizes service quality,<br />
ano<strong>the</strong>r that focuses on operational efficiency, and <strong>the</strong> third carefully balances <strong>the</strong>se two goals<br />
<strong>of</strong> quality and efficiency.<br />
2.1 Erlang-C: The Square Root Safety Staff<strong>in</strong>g Rule<br />
The classical M/M/N (Erlang-C) queue<strong>in</strong>g model is characterized by Poisson arrivals at rate<br />
λ, iid exponential service times with an expected duration 1/µ, and N servers work<strong>in</strong>g <strong>in</strong>dependently<br />
<strong>in</strong> parallel. One can view this model as a simple Birth-Death process where λ is<br />
<strong>the</strong> (constant) birth rate and µ is <strong>the</strong> (constant) death rate. A Markovian-state description<br />
<strong>of</strong> <strong>the</strong> process is <strong>the</strong> total number <strong>of</strong> customers <strong>in</strong> <strong>the</strong> system, ei<strong>the</strong>r served or queued. The<br />
correspond<strong>in</strong>g transition rate diagram is <strong>the</strong>n <strong>the</strong> follow<strong>in</strong>g:<br />
<br />
. . .<br />
0 1 2 N-1 N N+1<br />
<br />
<br />
2 <br />
N <br />
N <br />
Figure 1: Erlang- C as a Birth-Death Process<br />
Erlang-C is ergodic if and only if its traffic <strong>in</strong>tensity ρ = λ<br />
µ < 1; ρ is <strong>the</strong>n <strong>the</strong> servers’ utilization,<br />
namely <strong>the</strong> long-run fraction <strong>of</strong> time that a server is busy.<br />
The stationary/limit distribution is def<strong>in</strong>ed as<br />
πj = lim<br />
t→∞ P {L(t) = j}, j ≥ 0,<br />
where L(t) is <strong>the</strong> system state at time t, namely, <strong>the</strong> total number <strong>of</strong> customers <strong>in</strong> <strong>the</strong> system.<br />
Solution <strong>of</strong> <strong>the</strong> follow<strong>in</strong>g steady-state equations yields <strong>the</strong> probabilities πj <strong>of</strong> be<strong>in</strong>g at any state<br />
j dur<strong>in</strong>g steady-state:<br />
<br />
λπj = (j + 1)µj+1 0 ≤ j ≤ N − 1<br />
(1)<br />
λπj = (Nµ)πj+1 j ≥ N<br />
The probability that <strong>in</strong> steady-state all <strong>the</strong> servers are busy is given by <br />
πi, <strong>the</strong> stationary<br />
probability <strong>of</strong> be<strong>in</strong>g <strong>in</strong> one <strong>of</strong> <strong>the</strong> states {N, N + 1, . . .}. This probability is sometimes referred<br />
j≥N<br />
N <br />
. . .<br />
4
to as <strong>the</strong> Erlang-C <strong>for</strong>mula. It is denoted E2,N and is given by<br />
E2,N = <br />
j≥N<br />
πN = (λ/µ)N<br />
<br />
N−1 (λ/µ)<br />
N!(1 − ρ)<br />
i=0<br />
i<br />
−1 (λ/µ)N<br />
+<br />
i! N!(1 − ρ)<br />
The Poisson distribution <strong>of</strong> arrivals has an important and useful consequence, known as PASTA<br />
(Poisson Arrivals See Time Averages): it implies that <strong>the</strong> probability E2,N is <strong>in</strong> fact also <strong>the</strong><br />
probability that a customer is delayed <strong>in</strong> <strong>the</strong> queue (as opposed to be<strong>in</strong>g served immediately<br />
upon arrival).<br />
Us<strong>in</strong>g <strong>for</strong>mula (2) and its relatives, one can calculate staff<strong>in</strong>g levels N <strong>for</strong> any desired service<br />
level, given <strong>the</strong> arrival rate and average service time. This can be easily done even with<br />
a spreadsheet. However, such a solution does not provide any <strong>in</strong>sight on <strong>the</strong> dependence <strong>of</strong><br />
N on model parameters, <strong>for</strong> example, how should N change if <strong>the</strong> load was doubled. Such<br />
<strong>in</strong>sight comes out <strong>of</strong> a staff<strong>in</strong>g rule that goes back to as early as Erlang [3], where he derived<br />
it via marg<strong>in</strong>al analysis <strong>of</strong> <strong>the</strong> benefit <strong>of</strong> add<strong>in</strong>g a server. (Erlang <strong>in</strong>dicated that <strong>the</strong> rule had<br />
been practiced actually s<strong>in</strong>ce 1913.) This is <strong>the</strong> square-root safety- staff<strong>in</strong>g rule, which we now<br />
describe.<br />
Let R = λ/µ denote <strong>the</strong> average <strong>of</strong>fered load. Then <strong>the</strong> square root safety-staff<strong>in</strong>g rule states<br />
<strong>the</strong> follow<strong>in</strong>g: <strong>for</strong> moderate to large values <strong>of</strong> R, <strong>the</strong> appropriate staff<strong>in</strong>g level is <strong>of</strong> <strong>the</strong> <strong>for</strong>m<br />
5<br />
(2)<br />
N = R + β √ R (3)<br />
where β is a positive constant that depends on <strong>the</strong> desired level <strong>of</strong> service; β will be refereed to<br />
as <strong>the</strong> Quality-<strong>of</strong>-<strong>Service</strong> (QOS) parameter: <strong>the</strong> larger <strong>the</strong> value <strong>of</strong> β, <strong>the</strong> higher is <strong>the</strong> service<br />
quality. The second term on <strong>the</strong> right side <strong>of</strong> (3) is <strong>the</strong> excess (safety) capacity, beyond <strong>the</strong><br />
nom<strong>in</strong>al requirement R, which is needed <strong>in</strong> order to achieve an accepted service level under<br />
stochastic uncerta<strong>in</strong>ty.<br />
The <strong>for</strong>m <strong>of</strong> (3) carries with it a very important <strong>in</strong>sight. Let ∆ = β √ R denote <strong>the</strong> safety<br />
staff<strong>in</strong>g level (above <strong>the</strong> m<strong>in</strong>imum R = λ/µ.) Then, if β is fixed, an n-fold <strong>in</strong>crease <strong>in</strong> <strong>the</strong><br />
<strong>of</strong>fered load R requires that <strong>the</strong> safety staff<strong>in</strong>g ∆ <strong>in</strong>creases by only √ n-fold, which constitutes<br />
significant economies <strong>of</strong> scale.<br />
What does (3) guarantee as far as QOS is concerned? For Erlang-C, this is <strong>the</strong> subject <strong>of</strong><br />
<strong>the</strong> sem<strong>in</strong>al paper by Half<strong>in</strong> and Whitt [7], where <strong>the</strong>y provided <strong>the</strong> follow<strong>in</strong>g answer:<br />
Theorem 1: Consider a sequence <strong>of</strong> M/M/N queues, <strong>in</strong>dexed by N=1,2. . . As <strong>the</strong> number <strong>of</strong><br />
servers N grows to <strong>in</strong>f<strong>in</strong>ity, <strong>the</strong> square-root safety-staff<strong>in</strong>g rule applies asymptotically if and only<br />
if <strong>the</strong> delay probability converges to a constant α (0 < α < 1), <strong>in</strong> which case <strong>the</strong> relation between<br />
α and β is given by <strong>the</strong> Half<strong>in</strong>-Whitt function<br />
α = [1 + β/h(−β)] −1<br />
here h(x) = φ(x)/(1 − Φ(x)) is <strong>the</strong> hazard rate <strong>of</strong> <strong>the</strong> standard normal distribution N(0,1).<br />
(4)
Note that (3) applies if and only if √ N(1 − ρN) converges to β (β>0). Indeed, <strong>for</strong>mally <strong>the</strong><br />
Theorem <strong>of</strong> Half<strong>in</strong>-Whitt reads:<br />
As N ↑ ∞, P (W ait > 0) = E2,N → α (0 < α < 1)<br />
iff √ N(1 − ρN) → β (0 < β < ∞)<br />
(equivalently N ≈ RN + β √ RN) .<br />
In practice, this rule makes <strong>the</strong> life <strong>of</strong> a call-center manager easier: he or she can actually<br />
specify <strong>the</strong> desired delay probability and achieve it by follow<strong>in</strong>g <strong>the</strong> square-root safety staff<strong>in</strong>g<br />
rule (3), simply choos<strong>in</strong>g <strong>the</strong> right β.<br />
2.2 Erlang-A: Summary <strong>of</strong> Some Results<br />
Try<strong>in</strong>g to make <strong>the</strong> M/M/N model more realistic and useful, <strong>the</strong> follow<strong>in</strong>g assumption is added:<br />
each customer has limited patience, that is, as <strong>the</strong> wait<strong>in</strong>g time <strong>in</strong> <strong>the</strong> queue grows <strong>the</strong> customer<br />
may abandon. We assume that patience is distributed exponentially with mean 1/θ. This<br />
model is referred to as Erlang-A (A <strong>for</strong> Abandonment). It is also a Birth-Death process, and its<br />
transition rate diagram is depicted below.<br />
<br />
<br />
<br />
. . .<br />
0 1 2 N-1 N N+1<br />
2 <br />
<br />
N<br />
N <br />
Figure 2: Erlang- A as a Birth-Death Process<br />
The steady-state distribution is found by solv<strong>in</strong>g <strong>of</strong> <strong>the</strong> follow<strong>in</strong>g equations:<br />
<br />
λπj = (j + 1)µπj+1<br />
0 ≤ j ≤ N − 1<br />
λπj = (Nµ + (j + 1 − N)θ)πj+1 j ≥ N<br />
The solution <strong>of</strong> <strong>the</strong> steady-state equations is given by:<br />
⎧<br />
⎪⎨<br />
πj =<br />
⎪⎩<br />
(λ/µ) j<br />
π0,<br />
j!<br />
j<br />
<br />
<br />
λ (λ/µ) N<br />
Nµ + (k − N)θ N!<br />
0 ≤ j ≤ N<br />
π0, j ≥ N + 1<br />
where<br />
π0 =<br />
n<br />
j=0<br />
k=n+1<br />
(λ/µ) j<br />
j! +<br />
∞<br />
j<br />
j=N+1 k=N+1<br />
<br />
λ<br />
<br />
(λ/µ) N<br />
Nµ + (k − N)θ N!<br />
N<br />
. . .<br />
2<br />
−1<br />
6<br />
(5)
Just as with Erlang-C, appropriate staff<strong>in</strong>g levels <strong>in</strong> Erlang-A can be found us<strong>in</strong>g <strong>the</strong> solution<br />
to (4), but aga<strong>in</strong>, <strong>the</strong> disadvantage is that this does not provide any <strong>in</strong>sights. To this end, <strong>the</strong><br />
Erlang -A analogue <strong>of</strong> Theorem 1 was proved <strong>in</strong> [5], and it is given as follows:<br />
Theorem 2: Consider a sequence <strong>of</strong> M/M/N+M queues, <strong>in</strong>dexed by N=1,2. . . . As <strong>the</strong> number<br />
<strong>of</strong> servers N grows to <strong>in</strong>f<strong>in</strong>ity, <strong>the</strong> square-root safety-staff<strong>in</strong>g rule (3) applies asymptotically if<br />
and only if <strong>the</strong> delay probability converges to a constant α (0 < α < 1), <strong>in</strong> which case <strong>the</strong> relation<br />
between α and β is given by <strong>the</strong> Garnett function<br />
α =<br />
<br />
1 + h(δ)/δ<br />
h(−β)/β<br />
−1<br />
, −∞ < β < ∞. (6)<br />
Moreover, <strong>the</strong> above conditions apply if and only if √ nP (Abandon) converges to some positive<br />
constant γ that is given by<br />
Formally, Theorem 2 reads:<br />
<br />
h(δ)<br />
γ = αβ − 1 , δ = β<br />
δ µ/θ.<br />
As N ↑ ∞, P (W ait > 0) → α (0 < α < 1)<br />
iff √ N(1 − ρN) → β (−∞ < β < ∞)<br />
(equivalently N ≈ RN + β √ RN)<br />
iff √ NP (Abandon) → γ (0 < γ < ∞).<br />
An important feature <strong>of</strong> Erlang-A is that, unlike Erlang-C, it is always stable whenever <strong>the</strong><br />
abandonment rate θ is positive.<br />
Theorem 2 demonstrates that <strong>the</strong> square-root safety-staff<strong>in</strong>g rule prevails <strong>for</strong> Erlang-A as well.<br />
The QOS parameter β now depends on both <strong>the</strong> abandonment rate θ and <strong>the</strong> delay probability<br />
α. It is significant that here β may take also negative values (s<strong>in</strong>ce Erlang-A is always stable).<br />
7
2.3 Erlang-A: Three Operational Regimes<br />
Each organization has its own preferences <strong>in</strong> everyday function<strong>in</strong>g. Some <strong>of</strong> <strong>the</strong>m try to get <strong>the</strong><br />
most from <strong>the</strong> available resources, while o<strong>the</strong>rs see customers’ satisfaction as <strong>the</strong> most important<br />
target. Depend<strong>in</strong>g on organizational preferences, three different operational regimes arise:<br />
• Efficiency driven (ED).<br />
• Quality driven (QD).<br />
• Quality-Efficiency driven (QED).<br />
As <strong>the</strong> number <strong>of</strong> servers <strong>in</strong>creases, which is relevant <strong>for</strong> moderate to large call centers, <strong>the</strong>se<br />
regimes can be <strong>for</strong>mally characterized by relat<strong>in</strong>g <strong>the</strong> number <strong>of</strong> servers to <strong>the</strong> <strong>of</strong>fered load.<br />
Efficiency Driven (ED) Regime: The efficiency driven regime is characterized by very high<br />
servers utilization (∼ 100%) and relatively high abandonment rate (around 10%). In <strong>the</strong> ED<br />
regime, <strong>the</strong> <strong>of</strong>fered load R = λ/µ is noticeably larger than <strong>the</strong> number <strong>of</strong> agents N. This means<br />
that <strong>the</strong> system would collapse unless abandonment take place. The <strong>for</strong>mal characterization <strong>of</strong><br />
<strong>the</strong> ED regime is <strong>in</strong> terms <strong>of</strong> <strong>the</strong> follow<strong>in</strong>g relationship between N and RED:<br />
N = RED(1 − ε)<br />
where ε > 0 is a QOS parameter: a larger value <strong>of</strong> ε implies longer wait<strong>in</strong>g times and more<br />
abandonment.<br />
Quality Driven (QD) Regime: In <strong>the</strong> quality driven regime <strong>the</strong> emphasis is given to customers’<br />
service quality. This regime can be characterized by relatively low servers utilizations<br />
(<strong>for</strong> large call centers below 90%, and <strong>for</strong> smaller ones around 80% and perhaps less) and very<br />
low abandonment rate. Formally, this regime is characterized by:<br />
N = RQD(1 + ε), ε > 0<br />
Quality and Efficiency Driven (QED) Regime: This regime is <strong>the</strong> most relevant <strong>for</strong> call<br />
centers operation, s<strong>in</strong>ce it comb<strong>in</strong>es a relatively high utilization <strong>of</strong> servers (around 95%) and low<br />
abandonment rate (1%-3%). As noted already, <strong>the</strong> square-root safety-staff<strong>in</strong>g rule (3) rema<strong>in</strong>s<br />
valid <strong>in</strong> <strong>the</strong> model with abandonment, although now β depends not only on <strong>the</strong> service level<br />
α = P {W > 0} but also on <strong>the</strong> abandonment rate θ. The number <strong>of</strong> servers <strong>in</strong> this regime is<br />
given by <strong>the</strong> square-root <strong>for</strong>mula<br />
N = RQED + β RQED, −∞ < β < ∞ (7)<br />
where β is, as usual, <strong>the</strong> QOS parameter; note that β can now take negative values, while<br />
<strong>in</strong> <strong>the</strong> case <strong>of</strong> Erlang-C it is restricted to be positive <strong>in</strong> order to ensure stability.<br />
8
2.4 Time-Vary<strong>in</strong>g Staff<strong>in</strong>g to Achieve Time-Stable Per<strong>for</strong>mance [4]<br />
In this section we extend our discussion to models which allow <strong>the</strong> arrival rates to vary with time.<br />
The Mt/GI/∞ queue<strong>in</strong>g model is characterized by Poisson arrivals at time-vary<strong>in</strong>g rate λ(t),<br />
iid service times with cdf G, and <strong>in</strong>f<strong>in</strong>itely-many iid servers work<strong>in</strong>g <strong>in</strong> parallel. The number <strong>of</strong><br />
busy servers at time t, L(t), has a Poisson distribution with a time-vary<strong>in</strong>g mean. The latter,<br />
denoted R(t), can be also <strong>in</strong>terpreted as <strong>the</strong> <strong>of</strong>fered load at time t, and is expressed as follows:<br />
t t<br />
R(t) = E[L(t)] = E[λ(t − Se)] · E[S] = E λ(u)du = [1 − G(t − u)]λ(u)du, (8)<br />
t−S<br />
−∞<br />
where<br />
S is a generic service time;<br />
Se is a random variable which describes <strong>the</strong> excess service time, with <strong>the</strong> follow<strong>in</strong>g cdf:<br />
P (Se ≤ t) = 1<br />
E(S)<br />
t<br />
0<br />
[1 − G(u)du], t ≥ 0.<br />
One can also view <strong>the</strong> time vary<strong>in</strong>g <strong>of</strong>fered load (8) <strong>of</strong> Mt/GI/∞ as <strong>the</strong> time-vary<strong>in</strong>g <strong>of</strong>fered<br />
load <strong>for</strong> <strong>the</strong> Mt/GI/Nt + GI model (with Nt iid servers work<strong>in</strong>g <strong>in</strong> parallel at time t and general<br />
patience times), and <strong>in</strong> particular <strong>for</strong> <strong>the</strong> Mt/M/Nt + M model, namely <strong>the</strong> time-vary<strong>in</strong>g<br />
Erlang-A model.<br />
The authors <strong>of</strong> [4] show that to achieve time stable per<strong>for</strong>mance <strong>in</strong> <strong>the</strong> face <strong>of</strong> general arriv<strong>in</strong>g<br />
rates it is enough to target a stable delay probability, which produces stable per<strong>for</strong>mance<br />
<strong>of</strong> several o<strong>the</strong>r operational measures. More specifically, it is shown <strong>in</strong> [4] that <strong>for</strong> <strong>the</strong> timevary<strong>in</strong>g<br />
Erlang-A model (and <strong>in</strong> fact more generally), it is actually possible to reduce <strong>the</strong> hard<br />
problem <strong>of</strong> time-vary<strong>in</strong>g staff<strong>in</strong>g to an associated stationary staff<strong>in</strong>g problem. Specifically, a<br />
time-vary<strong>in</strong>g square-root staff<strong>in</strong>g, i.e. N(t) = R(t) + β · R(t), applies (R(t) given <strong>in</strong> (8)) with<br />
its characteriz<strong>in</strong>g parameter that is still <strong>the</strong> QOS parameter β (which, notably, does not vary<br />
with time). This staff<strong>in</strong>g level gives rise to a remarkable time-stable per<strong>for</strong>mance <strong>in</strong> which <strong>the</strong><br />
delay probability is constantly α. The relation between α and β <strong>in</strong> <strong>the</strong> time-vary<strong>in</strong>g model is<br />
actually <strong>the</strong> Garnett function (6), derived <strong>for</strong> <strong>the</strong> stationary Erlang-A model.<br />
Abandonment plays a crucial role <strong>in</strong> a call center function<strong>in</strong>g: one <strong>of</strong> <strong>the</strong> surpris<strong>in</strong>g consequences<br />
<strong>of</strong> [4] is that staff<strong>in</strong>g by <strong>the</strong> <strong>of</strong>fered load itself is very effective <strong>in</strong> <strong>the</strong> QED regime. That<br />
is, a special case <strong>of</strong> <strong>the</strong> square-root safety staff<strong>in</strong>g rule (3), namely β = 0, actually reads<br />
N(t) = R(t), t ≥ 0.<br />
Of course, this would never work if no abandonment were allowed.<br />
9
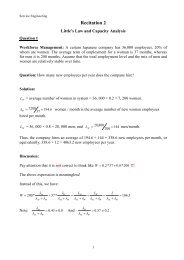
To show that <strong>the</strong> stationary Erlang-A model (M/M/N+N ) can <strong>in</strong>deed be used to predict <strong>the</strong><br />
per<strong>for</strong>mance <strong>of</strong> <strong>the</strong> time-vary<strong>in</strong>g Erlang-A model (Mt/M/Nt + N), <strong>the</strong> <strong>the</strong>oretical curve <strong>of</strong> <strong>the</strong><br />
expected wait<strong>in</strong>g time conditioned on wait was compared to <strong>the</strong> simulation values <strong>of</strong> <strong>the</strong> wait<strong>in</strong>g<br />
time conditioned on wait <strong>for</strong> <strong>the</strong> time vary<strong>in</strong>g model. In <strong>the</strong> simulation, <strong>the</strong> mean value <strong>of</strong> <strong>the</strong><br />
time-vary<strong>in</strong>g arrival rate equals to 100 and <strong>the</strong> maximum deviation from <strong>the</strong> mean equals to<br />
20. Figure 3 below, taken from [4], shows <strong>the</strong> comparison <strong>of</strong> <strong>the</strong>se distributions. The empirical<br />
results were obta<strong>in</strong>ed as an average <strong>of</strong> 5000 replications and show a remarkable fit to <strong>the</strong> <strong>the</strong>oretical<br />
curve.<br />
proportion<br />
proportion<br />
0.2<br />
0.18<br />
0.16<br />
0.14<br />
0.12<br />
0.1<br />
0.08<br />
0.06<br />
0.04<br />
0.02<br />
proportion<br />
0<br />
0 0.05 0.1 0.15 0.2 0.25 0.3 0.35 0.4 0.45 0.5<br />
0.1<br />
0.09<br />
0.08<br />
0.07<br />
0.06<br />
0.05<br />
0.04<br />
0.03<br />
0.02<br />
0.01<br />
0.045<br />
0.04<br />
0.035<br />
0.03<br />
0.025<br />
0.02<br />
0.015<br />
0.01<br />
0.005<br />
time<br />
Wait|Wait>0 Garnett Function<br />
0<br />
0 0.05 0.1 0.15 0.2 0.25 0.3 0.35 0.4 0.45 0.5<br />
time<br />
Wait|Wait>0 Garnett Function<br />
0<br />
0 0.1 0.2 0.3 0.4 0.5 0.6 0.7 0.8 0.9 1<br />
time<br />
Wait|Wait>0 Garnett Function<br />
Figure 3: The empirical and <strong>the</strong>oretical conditional wait<strong>in</strong>g time, given positive wait, <strong>for</strong> <strong>the</strong><br />
Mt/M/Nt + N model with three delay-probability targets: (1) α=0.1 (QD), (2) α=0.5 (QED),<br />
(3) α=0.9 (ED).<br />
10
3 Uncerta<strong>in</strong> Arrival Rate<br />
When design<strong>in</strong>g service systems, we usually use stochastic models such as Erlang models, which<br />
capture <strong>the</strong> uncerta<strong>in</strong>ty associated with <strong>the</strong> arrivals and service time. In addition, we assume<br />
that <strong>the</strong>se models’ parameters, such as <strong>the</strong> arrival rate and mean service time, are known. Then,<br />
we analyze our system, comput<strong>in</strong>g per<strong>for</strong>mance measures and mak<strong>in</strong>g staff<strong>in</strong>g decisions under<br />
<strong>the</strong>se assumptions. However, very <strong>of</strong>ten <strong>the</strong> parameters’ values are not known with certa<strong>in</strong>ty.<br />
This parameter uncerta<strong>in</strong>ty may lead to <strong>in</strong>correct decisions. If we underestimate <strong>the</strong> true arrival<br />
rate <strong>the</strong>n we will not staff enough servers, which may be critical <strong>in</strong> an emergency medical service,<br />
and if we overestimate <strong>the</strong> true arrival rate, we will provide better service than required, at <strong>the</strong><br />
cost <strong>of</strong> pay<strong>in</strong>g too many salaries.<br />
Henderson [8] and Steckley et al. [11] consider two legitimate <strong>in</strong>terpretations <strong>of</strong> <strong>the</strong> term ”uncerta<strong>in</strong>ty<br />
<strong>of</strong> <strong>the</strong> arrival rate”. The <strong>in</strong>terpretations differ <strong>in</strong> terms <strong>of</strong> whe<strong>the</strong>r <strong>the</strong> arrival rate<br />
is randomly vary<strong>in</strong>g, or simply unknown. Accord<strong>in</strong>g to <strong>the</strong> first <strong>in</strong>terpretation, on any given<br />
day, <strong>the</strong> arrival process is modeled as a Poisson process with a random time-dependent rate<br />
functions. The assumption <strong>of</strong> second <strong>in</strong>terpretation is that <strong>the</strong> arrival rate function does not<br />
vary from day to day, but it is not known with certa<strong>in</strong>ty. The ma<strong>in</strong> per<strong>for</strong>mance measure that<br />
<strong>the</strong> authors <strong>of</strong> [8] <strong>the</strong> and [11] consider is <strong>the</strong> fraction <strong>of</strong> customers that wait <strong>in</strong> queue at most<br />
τ seconds. They claim that <strong>the</strong> two systems can not be analyzed <strong>in</strong> <strong>the</strong> same way and show,<br />
<strong>for</strong> each case, how to approximate this per<strong>for</strong>mance measure us<strong>in</strong>g steady-state approximations<br />
and sketch how to estimate it us<strong>in</strong>g simulation .<br />
For data to be generated by a Poisson distribution, <strong>the</strong> mean and <strong>the</strong> variance should be approximately<br />
<strong>the</strong> same. However, <strong>in</strong> many practical cases, <strong>the</strong> data show a variance that significantly<br />
higher than <strong>the</strong> mean. In order to account <strong>for</strong> this overdispersion, Koole and Jongbloed [9]<br />
propose to model <strong>the</strong> arrival rate over [0,T ] by a Poisson mixture model <strong>in</strong> <strong>the</strong> <strong>for</strong>m<br />
λ(t) = λ0(t) · Z, 0 ≤ t ≤ T.<br />
This model takes <strong>in</strong>to consideration two sources <strong>of</strong> variability as follows. The scalar function<br />
λ0(t) is such that T<br />
0 λ0(u)du = 1. The value λ0(t) · ∆t is approximately <strong>the</strong> relative part <strong>of</strong><br />
expected arrivals dur<strong>in</strong>g (t, t + ∆t) out <strong>of</strong> all arrivals, and it captures <strong>the</strong> predictable variability<br />
<strong>in</strong> <strong>the</strong> arrival rate (time variations <strong>of</strong> expected arrival rate), e.g. peak demand <strong>of</strong> calls on<br />
Mondays between 10:00 to 11:00, on a regular basis. In o<strong>the</strong>r words, <strong>the</strong> predictable variability<br />
related to <strong>the</strong> shape <strong>of</strong> <strong>the</strong> arrival rate function. The second variable Z is a random variable that<br />
captures stochastic variability: it describes <strong>the</strong> total number <strong>of</strong> arrivals to <strong>the</strong> service system,<br />
i.e. describes <strong>the</strong> fluctuations around <strong>the</strong> time-dependent expected arrival rate. This model is<br />
an example <strong>for</strong> <strong>the</strong> first <strong>in</strong>terpretation <strong>of</strong> uncerta<strong>in</strong>ty, given by [8] and [11].<br />
Every service manager must also take <strong>in</strong>to consideration costs and how <strong>the</strong>y are affected by<br />
staff<strong>in</strong>g decisions. Whitt [12] proposes methods <strong>for</strong> staff<strong>in</strong>g a s<strong>in</strong>gle-class call center with uncerta<strong>in</strong><br />
arrival rate and uncerta<strong>in</strong> staff<strong>in</strong>g due to employee absenteeism while his goal is to maximize<br />
<strong>the</strong> expected net return. He uses a determ<strong>in</strong>istic fluid approximation and a numerical algorithm<br />
<strong>for</strong> <strong>the</strong> conditional per<strong>for</strong>mance measures <strong>of</strong> M/M/N+N queue, and shows that <strong>for</strong> large arrival<br />
rates <strong>the</strong> fluid model become very accurate and <strong>the</strong> exact numerical solution adds only little<br />
11
practical value <strong>in</strong> terms <strong>of</strong> accuracy. Moreover, he shows that <strong>the</strong> quality <strong>of</strong> <strong>the</strong> fluid approximation<br />
improves as variability <strong>of</strong> <strong>the</strong> arrival rate <strong>in</strong>creases.<br />
<strong>Uncerta<strong>in</strong>ty</strong> <strong>in</strong> future call volume complicates <strong>the</strong> process <strong>of</strong> determ<strong>in</strong><strong>in</strong>g staff<strong>in</strong>g levels. It<br />
is <strong>the</strong>n important to correctly model <strong>the</strong> stochastic nature <strong>of</strong> call arrivals, and <strong>in</strong> particular, to<br />
make corect predictions <strong>of</strong> call arrivals. Operation Researchers have been develop<strong>in</strong>g plann<strong>in</strong>g<br />
models <strong>for</strong> service systems <strong>for</strong> <strong>the</strong> last few decades. Channouf et al. [2] refers to <strong>the</strong> emergency<br />
medical system and survey <strong>the</strong> academic literature regard<strong>in</strong>g <strong>the</strong> plann<strong>in</strong>g models topic.<br />
Next, <strong>the</strong>y develop and evaluate time-series models <strong>for</strong> estimat<strong>in</strong>g and <strong>for</strong>ecast<strong>in</strong>g daily and<br />
hourly arrival rates, and <strong>the</strong>n compare <strong>the</strong> models <strong>in</strong> term <strong>of</strong> <strong>the</strong>ir quality <strong>of</strong> fit and <strong>for</strong>ecast<strong>in</strong>g<br />
per<strong>for</strong>mance us<strong>in</strong>g historical observations <strong>of</strong> a major Canadian city’s emergency medical service.<br />
Implement<strong>in</strong>g <strong>the</strong> QED’s ”square-root staff<strong>in</strong>g” rule (7) requires that <strong>for</strong>ecasted arrival and<br />
service rates adhere to a certa<strong>in</strong> level <strong>of</strong> precision. The requirements <strong>for</strong> prediction accuracy<br />
is that <strong>the</strong> estimated arrival rate must not exceed an order <strong>of</strong> square-root deviation from <strong>the</strong><br />
real arrival rate. O<strong>the</strong>rwise <strong>the</strong> QED rule will not be effective s<strong>in</strong>ce, with a larger error, it will<br />
ei<strong>the</strong>r grossly over- or under- estimate <strong>the</strong> staff<strong>in</strong>g level. Aldor [1] develops two variations <strong>of</strong><br />
Poisson process models, which are based on a mixed Poisson process approach, <strong>for</strong> predict<strong>in</strong>g<br />
<strong>the</strong> system loads, and <strong>the</strong>n develops different goodness-<strong>of</strong>-fit criteria that help determ<strong>in</strong>e <strong>the</strong><br />
model per<strong>for</strong>mance under <strong>the</strong> QED regime. Her results, <strong>of</strong> analyz<strong>in</strong>g an Israeli cellular phone<br />
company data, show that dur<strong>in</strong>g busy periods, when <strong>the</strong> QED regime ”square-root staff<strong>in</strong>g” rule<br />
is relevant, <strong>the</strong> system will be able to per<strong>for</strong>m at a desired level commensurate with <strong>the</strong> actual<br />
load. The results gives some evidence that one can ensure a pre-specified QED regime us<strong>in</strong>g<br />
load <strong>for</strong>ecasts that are sufficiently precise.<br />
12
4 Our Proposed Research<br />
In order to demonstrate how uncerta<strong>in</strong> arrival rate may <strong>in</strong>fluence staff<strong>in</strong>g decisions, we first<br />
consider an M/M/n+M queue with model-parameter uncerta<strong>in</strong>ty characterized by a random<br />
arrival rate Λ. We let <strong>the</strong> mean service time and <strong>the</strong> mean patience time be 1, i.e. µ = θ = 1,<br />
and we seek service level β which yields a time-stable delay probability α.<br />
Assume Λ is a discrete random variable with f<strong>in</strong>ite or countably <strong>in</strong>f<strong>in</strong>ite set <strong>of</strong> values KΛ, and a<br />
probability distribution pλi = P (Λ = λi). Let Ri = λi/µ denote <strong>the</strong> <strong>of</strong>fered load <strong>in</strong> case Λ = λi,<br />
and R <strong>the</strong> expected <strong>of</strong>fered load<br />
By <strong>the</strong> SLLN and <strong>the</strong> Garnett function (6):<br />
α = lim<br />
k→∞<br />
where,<br />
k<br />
j=1 Wj<br />
k<br />
j=1 Aj<br />
= lim<br />
k→∞<br />
1 k k j=1 Wj<br />
1 k k j=1 Aj<br />
R = <br />
pλi · Ri .<br />
KΛ<br />
= EW<br />
EA =<br />
<br />
KΛ pi · Ri · αi<br />
<br />
KΛ pi · Ri<br />
=<br />
<br />
KΛ pi · Ri · αi<br />
R<br />
Wj=Number <strong>of</strong> wait<strong>in</strong>g customers at day j;<br />
Aj=Number <strong>of</strong> arrivals at day j;<br />
<br />
N−Ri<br />
αi = P (W ait > 0|Λ = λi) = 1 − φ (s<strong>in</strong>ce µ = θ; o<strong>the</strong>rwise αi is <strong>the</strong> Garnett function<br />
(6)).<br />
√ Ri<br />
There<strong>for</strong>e, given α, we would like to f<strong>in</strong>d N. Then, assum<strong>in</strong>g a square-root staff<strong>in</strong>g rule, we<br />
calculate <strong>the</strong> QOS parameter β = N−R √ .<br />
R<br />
Because <strong>of</strong> <strong>the</strong> analytical tractability <strong>of</strong> <strong>the</strong> Erlang-A model, us<strong>in</strong>g R, one can calculate <strong>the</strong><br />
value <strong>of</strong> β <strong>for</strong> each α accord<strong>in</strong>g to (6). For analytically <strong>in</strong>tractable models, one can use <strong>the</strong> ISA<br />
simulation developed by [4] to obta<strong>in</strong> values <strong>of</strong> per<strong>for</strong>mance measures.<br />
13<br />
(8)
4.1 Examples<br />
By compar<strong>in</strong>g <strong>the</strong> model with and without <strong>the</strong> parameter uncerta<strong>in</strong>ty, we ga<strong>in</strong> <strong>in</strong>sight on <strong>the</strong><br />
effect <strong>of</strong> parameter uncerta<strong>in</strong>ty. The case <strong>of</strong> no parameter uncerta<strong>in</strong>ty arises when we replace <strong>the</strong><br />
random variable by its expected value. For example we let <strong>the</strong> arrival rate Λ have three possible<br />
values, each with probability 1/3. We take <strong>the</strong> value 100 to be one <strong>of</strong> <strong>the</strong> possible arrival rates<br />
as well as <strong>the</strong> expected <strong>of</strong>fered load. Hence we have symmetric discrete distribution around 100.<br />
Us<strong>in</strong>g R, we plot <strong>the</strong> probability <strong>of</strong> delay α as a function <strong>of</strong> <strong>the</strong> QOS parameter β (8) <strong>in</strong> Figure<br />
4 below.<br />
Alpha<br />
1<br />
0.9<br />
0.8<br />
0.7<br />
0.6<br />
0.5<br />
0.4<br />
0.3<br />
0.2<br />
0.1<br />
0<br />
−10 −8 −7 −6 −5 −4 −3 −2 −1 0 1 2 3 4 5 6 7 8 9 10 11<br />
Beta<br />
(10,100,190)<br />
(25,100,175)<br />
(40,100,160)<br />
(55,100,145)<br />
(70,100,130)<br />
(85,100,115)<br />
Garnett<br />
Figure 4: Probability <strong>of</strong> Delay vs. Beta. The arrival rate gets one <strong>of</strong> 3 possible values with<br />
equal probabilities, <strong>for</strong> example (85,100,115), (70,100,130) etc. as <strong>in</strong>dicated above.<br />
The first observation from Figure 4 is <strong>the</strong> grow<strong>in</strong>g deviation between <strong>the</strong> function <strong>of</strong> <strong>the</strong> random<br />
parameter case and <strong>the</strong> Garnett function, as <strong>the</strong> variation <strong>of</strong> <strong>the</strong> arrival rate grows, when β is<br />
positive. For negative values <strong>of</strong> β, <strong>the</strong> functions <strong>in</strong>tersect and <strong>the</strong> connection between <strong>the</strong> variation<br />
<strong>of</strong> <strong>the</strong> arrival rate and <strong>the</strong> function’s deviation from <strong>the</strong> Garnett function is unequivocal<br />
<strong>in</strong> <strong>the</strong> context mentioned <strong>for</strong> positive β . Moreover, one should mentions that low staff<strong>in</strong>g levels<br />
will be good if Λ is low, but <strong>the</strong>re will be a severe under-staff<strong>in</strong>g if Λ turns out to be high. On <strong>the</strong><br />
o<strong>the</strong>r hand, high staff<strong>in</strong>g level will be good if Λ is high, but <strong>the</strong>re will be severe over-staff<strong>in</strong>g if<br />
Λ turns out to be low. A service system’s managers must take all <strong>the</strong>se risks <strong>in</strong>to consideration.<br />
14
4.2 Future Work<br />
• Updat<strong>in</strong>g <strong>the</strong> exist<strong>in</strong>g simulation s<strong>of</strong>tware - our first step will be generaliz<strong>in</strong>g <strong>the</strong><br />
simulation code developed by Feldman [4] with <strong>the</strong> features <strong>of</strong> random arrival rate. We<br />
will first check <strong>the</strong> results <strong>of</strong> <strong>the</strong> basic stationary Erlang-A model, and after that, we will<br />
consider <strong>the</strong> expansion <strong>of</strong> <strong>the</strong> algorithm to <strong>the</strong> time vary<strong>in</strong>g Erlang-A model <strong>in</strong> <strong>the</strong> random<br />
arrival rate case.<br />
• Validate and understand <strong>the</strong>oretically Figure 4 - this step entails two th<strong>in</strong>gs :<br />
1. Establish <strong>the</strong> square-root staff<strong>in</strong>g rule by compar<strong>in</strong>g simulation results <strong>for</strong> random<br />
arrival rate with <strong>the</strong>oretical results as <strong>in</strong> Figure 4, which are based on <strong>the</strong> square-root<br />
staff<strong>in</strong>g rule (3).<br />
2. Understand <strong>the</strong>oretically <strong>the</strong> functions shape. Important and <strong>in</strong>terest<strong>in</strong>g th<strong>in</strong>gs to<br />
understand from <strong>the</strong> graphs are <strong>the</strong> <strong>in</strong>tersection po<strong>in</strong>ts <strong>of</strong> each function with <strong>the</strong> Y<br />
axis (<strong>the</strong> case <strong>of</strong> β = 0, namely N = R), with <strong>the</strong> Garnett function and with <strong>the</strong> o<strong>the</strong>r<br />
functions. In additional, we would like to understand <strong>the</strong> changes <strong>of</strong> <strong>the</strong> functions<br />
from convexity to concavity, and <strong>the</strong> values <strong>of</strong> β <strong>for</strong> which α is stabilized.<br />
• Arrival rate as a cont<strong>in</strong>uous random variable - we shall generalize our results to<br />
arrival rates with densities. For example, we may let <strong>the</strong> prior distribution <strong>of</strong> Λ be Gamma<br />
which is <strong>the</strong> conjugate distribution <strong>of</strong> <strong>the</strong> Poisson distribution. In o<strong>the</strong>r words, if we<br />
sample Λ we get a posterior distribution which is ano<strong>the</strong>r Gamma distribution with a<br />
simple change <strong>of</strong> <strong>the</strong> parameters. Ano<strong>the</strong>r cont<strong>in</strong>uous distribution which may be taken<br />
<strong>in</strong>to consideration is <strong>the</strong> Normal distribution, which is a natural choice when one has no<br />
detailed analysis <strong>of</strong> <strong>the</strong> distribution <strong>of</strong> Λ. In do<strong>in</strong>g so, we should assume that <strong>the</strong> standard<br />
deviation <strong>of</strong> Λ is relatively small compared to its mean, so that negative values would occur<br />
with only a negligible probability. However, <strong>the</strong> complexity <strong>of</strong> work<strong>in</strong>g with <strong>the</strong> normal<br />
distribution must be taken <strong>in</strong>to consideration.<br />
• Theoretical results - motivated by <strong>the</strong> work <strong>of</strong> Half<strong>in</strong> - Whitt [7] and Garnett [5], <strong>the</strong><br />
next step will <strong>in</strong>volve develop<strong>in</strong>g a parallel <strong>the</strong>orem to those which are described <strong>in</strong> Section<br />
2, <strong>in</strong> <strong>the</strong> case where <strong>the</strong> arrival rate is a random variable. For <strong>the</strong> M/G/N model (Poisson<br />
arrivals, general service time distribution and N servers) <strong>the</strong>re is, currently, no Half<strong>in</strong>-<br />
Whitt-like <strong>the</strong>orem. Hence, <strong>in</strong>stead <strong>of</strong> ma<strong>the</strong>matical analysis we shall use simulation, which<br />
is applied to this model, <strong>in</strong> order to obta<strong>in</strong> similar results to <strong>the</strong> ones <strong>of</strong> Half<strong>in</strong>-Whitt and<br />
Garnett. Moreover, we shall consider approximations <strong>of</strong> per<strong>for</strong>mance measures that yield<br />
<strong>in</strong>sight as to <strong>the</strong>ir dependence on <strong>the</strong> model’s parameters. Part <strong>of</strong> <strong>the</strong>se approximations are<br />
diffusion approximations <strong>for</strong> stochastic processes, such as <strong>the</strong> process Q = {Q(t), t ≥ 0},<br />
where Q(t) is <strong>the</strong> number <strong>of</strong> customer present <strong>in</strong> <strong>the</strong> system at time t. This k<strong>in</strong>d <strong>of</strong><br />
approximation enables one to analyze <strong>the</strong> processes beyond steady-state.<br />
• Consider<strong>in</strong>g o<strong>the</strong>r per<strong>for</strong>mance measures - we shall try to determ<strong>in</strong>e staff<strong>in</strong>g levels<br />
that will ensure time-stability <strong>of</strong> per<strong>for</strong>mance measures o<strong>the</strong>r than <strong>the</strong> delay probability,<br />
<strong>for</strong> example <strong>the</strong> expected wait<strong>in</strong>g time and <strong>the</strong> probability <strong>of</strong> abandonment.<br />
• Optimization problems - we shall try to f<strong>in</strong>d staff<strong>in</strong>g rules that, when applied, provide<br />
m<strong>in</strong>imum costs or maximum pr<strong>of</strong>it.<br />
15
References<br />
[1] Aldor S., Forecast<strong>in</strong>g <strong>Demand</strong>s <strong>for</strong> a Telephone Call Center: Analysis <strong>of</strong> Desired versus<br />
Atta<strong>in</strong>able Precision. M.Sc. Thesis, Technion, (2006).<br />
[2] Channouf N., L’Ecuyer P., Avramidis A. and Ingolfsson A., The Application <strong>of</strong> Forecast<strong>in</strong>g<br />
Techniques to Model<strong>in</strong>g Emergency Medical System Calls <strong>in</strong> Calgary, Alberta., Health Care<br />
Manegement Science, vol.10, No.1, pp. 25-45 , (2007).<br />
[3] Erlang, A.K., The Theory <strong>of</strong> Probabilities and Telephone Conversations. Nyt Tidsskrift Mat.<br />
D 20, pp. 33-39, (1909).<br />
[4] Feldman Z., Mandelbaum A., Massey W. A., Whitt W., Staff<strong>in</strong>g <strong>of</strong> Time-Vary<strong>in</strong>g Queues<br />
to Achieve Time-Stable Per<strong>for</strong>mance. To appear <strong>in</strong> Management Science. (2007).<br />
[5] Garnett O., Mandelbaum A. and Reiman M., Design<strong>in</strong>g a Call Center with Impatient Customers.,<br />
Manufactur<strong>in</strong>g and <strong>Service</strong> Operations Management, 4(3), pp. 208-227, (2002).<br />
[6] Green L., Capacity Plann<strong>in</strong>g and Management <strong>in</strong> Hospitals., Operations Research and Helth<br />
Care,(Brandwau et al editors), pp. 14-41, (2004).<br />
[7] Half<strong>in</strong> S., Whitt W., Heavy-traffic Limits <strong>for</strong> Queues with many Exponential Servers., Operations<br />
research 29, pp. 567-587, (1981).<br />
[8] Henderson S., Input Model <strong>Uncerta<strong>in</strong>ty</strong>: Why Do We Care and What Should We Do About<br />
It?., W<strong>in</strong>ter Simulation Conference, pp. 90-100, (2003).<br />
[9] Koole G. and Jongbloed G., Manag<strong>in</strong>g <strong>Uncerta<strong>in</strong>ty</strong> <strong>in</strong> Call Centers Us<strong>in</strong>g Poisson Mixtures.,<br />
Applied Stochastic Models <strong>in</strong> Bus<strong>in</strong>ess and Industry, vol.17, No.1, pp. 307-318 , (2001).<br />
[10] Palm C., Research on Telephone Traffic Carried by Full Availability Groups., Tele, vol.<br />
1, 107, (1957) (English translation <strong>of</strong> results first published <strong>in</strong> 1946 <strong>in</strong> Swedish <strong>in</strong> <strong>the</strong> same<br />
journal which was entitled Teknisska Meddelanden fran Kungl. Telegrafstyrelsen.).<br />
[11] Steckley S., Henderson S. and Mehrotra V., <strong>Service</strong> System Plann<strong>in</strong>g<br />
<strong>in</strong> <strong>the</strong> Presence <strong>of</strong> a Random Arrival Rate. (2004). Doawnloadble from:<br />
http://legacy.orie.cornell.edu/ shane/pubs.<br />
[12] Whitt W., Staff<strong>in</strong>g a Call Center with Uncerta<strong>in</strong> Arrival Rate and Absenteeism., Production<br />
and Operations Management, vol. 15, No.1, pp.88-102, (2006)<br />
16