GVRD Rainfall Update - Metro Vancouver
GVRD Rainfall Update - Metro Vancouver
GVRD Rainfall Update - Metro Vancouver

Create successful ePaper yourself
Turn your PDF publications into a flip-book with our unique Google optimized e-Paper software.
<strong>GVRD</strong> Historical and Future<br />
<strong>Rainfall</strong> Analysis <strong>Update</strong><br />
Trevor Q. Murdock, Katrina E. Bennett and Arelia T. Werner<br />
1 August 2007
(BLANK)
<strong>GVRD</strong> Historical and Future <strong>Rainfall</strong> Analysis <strong>Update</strong>: Final Report – PCIC – 1 August 2007<br />
Table of Contents<br />
List of tables .................................................................................................................................................. iii<br />
List of figures ................................................................................................................................................ iii<br />
Preface........................................................................................................................................................... iv<br />
Executive Summary........................................................................................................................................ v<br />
List of abbreviations..................................................................................................................................... vii<br />
1 Introduction ............................................................................................................................................ 1<br />
1.1 Background..................................................................................................................................... 1<br />
1.2 Study Area...................................................................................................................................... 1<br />
1.3 Project Purpose and Objectives ...................................................................................................... 4<br />
2 Data and Methods................................................................................................................................... 4<br />
2.1 Historical <strong>Rainfall</strong> Records ............................................................................................................ 4<br />
2.2 Data Derived from Historical <strong>Rainfall</strong> Records.............................................................................. 5<br />
2.3 ENSO and PDO Indices ................................................................................................................. 7<br />
2.4 Statistical Analysis ......................................................................................................................... 7<br />
2.5 Visual Analysis............................................................................................................................... 8<br />
2.6 Recent Extreme Events................................................................................................................... 9<br />
2.7 Removal of Outliers...................................................................................................................... 10<br />
3 Results and Discussion ......................................................................................................................... 11<br />
3.1 Historical <strong>Rainfall</strong> Intensity.......................................................................................................... 11<br />
3.1.1 Overview of <strong>Rainfall</strong> Intensity Trends ................................................................................. 11<br />
3.1.2 Detailed Analysis.................................................................................................................. 13<br />
3.1.3 Effect of 2002-2005 data update on Historical <strong>Rainfall</strong> Intensity trends.............................. 20<br />
3.2 Historical Threshold Exceedance Frequency................................................................................ 21<br />
3.2.1 Summary of Historical Threshold Exceedance Frequency Trends....................................... 21<br />
3.2.2 Detailed Results of Historical Threshold Exceedance Trends.............................................. 22<br />
3.3 Cycles of Historical Climate Variability ...................................................................................... 25<br />
3.4 Comparison of Results to Historical Total Precipitation .............................................................. 28<br />
3.4.1 Historical Trends and Cycles in Total Precipitation ............................................................. 28<br />
3.4.2 Synoptic Types and Total Precipitation................................................................................ 29<br />
3.4.3 Future Projections of Total Precipitation.............................................................................. 30<br />
4 Conclusions .......................................................................................................................................... 33<br />
Acknowledgements ...................................................................................................................................... 35<br />
References .................................................................................................................................................... 36<br />
Appendix A: Recommendations for further analysis ................................................................................... 40<br />
Appendix B: <strong>Rainfall</strong> catalogue, station records and notes .......................................................................... 45<br />
Appendix C: Data limitations....................................................................................................................... 51<br />
ii
<strong>GVRD</strong> Historical and Future <strong>Rainfall</strong> Analysis <strong>Update</strong>: Final Report – PCIC – 1 August 2007<br />
List of tables<br />
Table 1.1 Station location, elevation, and annual total rainfall ...................................................................... 3<br />
Table 2.1 Maximum rainfall intensity for hypothetical rain day .................................................................... 6<br />
Table 2.2 <strong>Rainfall</strong> exceedance thresholds from KWL-02 .............................................................................. 6<br />
Table 3.1 Summary table of AMRI, SMRI and SWRI trends...................................................................... 11<br />
Table 3.2 Summary of TSRI cumulative departures from the mean for all stations..................................... 12<br />
Table 3.3 AMRI trend (mm/hr per century) for all durations....................................................................... 14<br />
Table 3.4a-3.4l MMRI trend analysis for monthly values January – December. Values in bold are<br />
significant and trends are >= .10 mm/hr per year (10 mm/hr per century) over the period of record.<br />
Statistical significance is indicated in the column preceding the trend. ............................................... 16<br />
Table 3.5 AMRI trends 1950-2001. Bold values are >= 10 mm/hr per century........................................... 20<br />
Table 3.6 Summary of ATEC and STEC trends........................................................................................... 22<br />
Table 3.7 Years of extreme values of ATEC at selected stations................................................................. 22<br />
Table 3.8 ATEC trends (# of occurrences per year) ..................................................................................... 22<br />
Table 3.9 STEC trends (# of occurrences per year)...................................................................................... 24<br />
Table 3.10 Change in exceedance (TSEC) from pre-76/77 to post-76/77 period over all durations at<br />
individual stations and averages over all periods. ................................................................................ 26<br />
Table 3.11 Average exceedance (TSEC) from pre-76/77 and post-76/77. Standard deviations are shown in<br />
brackets, italicized post-76/77 values are greater than their corresponding pre-76/77 values. Bold<br />
values indicate post-76/77 populations are significantly different from the pre-76/77 population.<br />
Results are shown for 5 time periods only............................................................................................ 27<br />
Table 3.12 Climate model and emissions scenarios used for boxplots......................................................... 30<br />
Table 3.13 Precipitation projections (% anomaly from historical climatology) for 2020s, 2050s and 2080s<br />
for 25 th percentile, median, and 75 th percentile of emissions scenarios................................................ 32<br />
List of figures<br />
Figure 1.1 Map of rainfall station locations in the <strong>GVRD</strong> and annual mean rainfall amounts....................... 2<br />
Figure 1.2 Monthly total rainfall, October to September for the <strong>GVRD</strong> stations and MSC stations, 1976–<br />
2005........................................................................................................................................................ 3<br />
Figure 2.1 Plots of time periods used in the annual time series analysis. Gaps indicate missing or<br />
unavailable data...................................................................................................................................... 5<br />
Figure 3.1 Distribution of months with positive trends that are significant at the (a) 95%, and (b) 90% level<br />
for MMRI. Lines indicate seasonal groupings for winter, spring, summer and fall. ............................ 15<br />
Figure 3.2 AMRI trends (mm/hr per century) for (a) average of 9 stations (BU31, QT10, CW09, DN25,<br />
DN15/82, VA01, VA04, VA13, VW14) and (b) DN25. ...................................................................... 21<br />
Figure 3.3 ATEC trends (occurrences per year) for the 5-minute duration, pre-76/77 and post-76/77........ 28<br />
Figure 3.4 <strong>GVRD</strong> region (see black and red squares) and grid boxes selected from the Canadian Global<br />
Climate Model...................................................................................................................................... 31<br />
Figure 3.5 Box and whisker plot for the annual future precipitation projections for 2020s, 2050s and 2080s.<br />
See text for full explanation.................................................................................................................. 31<br />
iii
<strong>GVRD</strong> Historical and Future <strong>Rainfall</strong> Analysis <strong>Update</strong>: Final Report – PCIC – 1 August 2007<br />
Preface<br />
The management of municipal water supply and sewerage services is a responsibility of<br />
government. Many of the rules for stormwater management are empirical and well-established.<br />
These rules protect domestic and commercial infrastructure against flooding and extreme<br />
precipitation events.<br />
Within the context of global climate (temperature) change, what are the regional effects on<br />
precipitation? Are the design rules still valid? Even if the mean annual precipitation is<br />
unchanged, is the distribution of rainfall events; namely, the intensity and frequency increasing?<br />
These questions were answered affirmatively in an earlier report by Kerr Wood Liedal,<br />
Associates (2002). After 5 years, the Greater <strong>Vancouver</strong> Regional District (<strong>GVRD</strong>) has<br />
commissioned the Pacific Climate Impacts Consortium (PCIC) to update the analysis and focus<br />
on rainfall intensity and frequency of occurrence of large rainfall events in the <strong>Vancouver</strong> region.<br />
The audience for this report is stormwater engineers, managers, and planners for the <strong>GVRD</strong> and<br />
its members.<br />
This report and update was prepared by Pacific Climate Impacts Consortium (PCIC) staff with<br />
additional support from members of the consortium and with assistance of several reviewers<br />
identified in the Acknowledgements. PCIC is a multi-disciplinary consortium that includes<br />
researchers and collaborators who address climate variability and change, and extreme weather<br />
events and their impacts, especially on hydrology and water resources.<br />
This report affirms, but qualifies the patterns and trends found in the 2002 report. It also<br />
identifies several steps that could be taken to improve the ability to undertake stormwater<br />
management and other regional planning in the context of global climate change.<br />
Dave Rodenhuis, Acting Director<br />
Pacific Climate Impacts Consortium<br />
1 August 2007<br />
iv
(BLANK)
<strong>GVRD</strong> Historical and Future <strong>Rainfall</strong> Analysis <strong>Update</strong>: Final Report – PCIC – 1 August 2007<br />
Executive Summary<br />
The final report of a 2002 study (KWL-02) on rainfall extremes prepared by Kerr Wood<br />
Liedal Associates Ltd. and published by the Greater <strong>Vancouver</strong> Regional District<br />
(<strong>GVRD</strong>) recommended conducting updates to the report every five years. Since the time<br />
of the original report, the following have become available:<br />
• additional <strong>GVRD</strong> historical rainfall data (mainly 2002-2005 observations)<br />
• additional data and analysis of the state of the Pacific Decadal Oscillation (PDO)<br />
• regionally-averaged future climate model projections<br />
Furthermore, recent extreme weather events of the last five years provide added<br />
motivation to improve understanding of extreme rainfall in the <strong>GVRD</strong>.<br />
Making use of the new information, Pacific Climate Impacts Consortium staff repeated<br />
selected analysis from the original report. In some cases, slight modifications to the<br />
methodology were made although the scope of the work remained an update to the<br />
original report. In addition to presenting the results of the updated analysis, this report<br />
also includes a large amount of technical information regarding the analysis performed to<br />
facilitate comparison of methods for future updates. However, this document neither<br />
replaces the original report nor can it serve as a complete analysis of <strong>GVRD</strong> rainfall.<br />
The update considers extreme rainfall recorded at twelve precipitation gauges located<br />
throughout the <strong>GVRD</strong> for two measures: rate of rainfall (intensity) and how often large<br />
events occur (threshold exceedance). Firm conclusions about trends are not possible<br />
because records are too short and stations are located in disparate locations. In addition,<br />
there are large data gaps that may skew some results. A cautious consideration of<br />
uncertainty also guides interpretation of the results in sections that address effect on<br />
<strong>GVRD</strong> rainfall of climate variability and climate change. Despite the limitations, results<br />
provide an update for planning that depends on <strong>GVRD</strong> rainfall variability and change as<br />
well as a discussion of potential opportunities for future work. An overview of findings is<br />
as follows:<br />
Recent trends and patterns<br />
In general, patterns of increased rainfall, as noted in KWL-02, are still occurring and<br />
many have become more accentuated since 2001. Statistically significant trends were<br />
found at some stations, particularly in April to June, and to a lesser extent October to<br />
January. At the station where the most significant trends (DN25 North <strong>Vancouver</strong>) were<br />
found, the largest trends were those with shortest durations.<br />
Climate variability<br />
The potential relationship between known aspects of climate variability and <strong>GVRD</strong><br />
rainfall was investigated. Larger rainfall events appeared to occur during the positive<br />
(warm) phase of the PDO. However, separating this from the underlying long-term trend<br />
was beyond the scope of this analysis.<br />
v
<strong>GVRD</strong> Historical and Future <strong>Rainfall</strong> Analysis <strong>Update</strong>: Final Report – PCIC – 1 August 2007<br />
Climate change<br />
Future precipitation projections derived from 29 experiments with 7 global climate<br />
models show a considerable range in projections for the <strong>GVRD</strong> region. A large range<br />
indicates considerable uncertainty. However, models consistently project a 14% to 33%<br />
decrease in summer precipitation by the middle of the century. In addition, most models<br />
project small increases in precipitation during all other seasons, particularly in winter<br />
(4% to 14% increase by the middle of the century).<br />
The projected net annual increase in precipitation of 1% to 5% by the middle of the<br />
century is too small (and uncertain) to be used for planning purposes. The small range<br />
indicates that neither very large decreases nor increases in the annual average are to be<br />
expected. However, important seasonal changes are projected despite the small annual<br />
average change: large winter precipitation increases (4% to 14%) and summer decreases<br />
(-33% to -14%) by the middle of the century. Furthermore, consistent projections for<br />
warming in the region by mid-century (2.1°C to 2.6°C) will cause increased winter and<br />
spring rainfall due to a larger fraction of total precipitation falling as rain rather than<br />
snow.<br />
An overview of recommendations for future updates and further analysis is as follows:<br />
Data quality and local station limitations<br />
• continue using recently digitized data<br />
• fill missing values<br />
• use rehabilitated data<br />
• analyse regionally-averaged results beyond the <strong>GVRD</strong> to allow for identification of<br />
more climatologically robust regional trends (and to include a larger number of<br />
stations)<br />
Methods: beyond rainfall intensity and exceedance<br />
• assess vulnerability to rainfall changes, climate change and extreme events<br />
• conduct literature review prior to routine updating to ensure the study of most useful<br />
parameters, use of most appropriate research methods, and to understand the<br />
limitations<br />
• investigate changes to synoptic weather types 1<br />
• include snow and temperature trends and projections in addition to rainfall<br />
• event-based analysis as a foundation for examining rainfall and streamflow record<br />
• hydrologic modelling<br />
• apply trend analysis to seasonal results rather than grouping monthly trends by season<br />
• use consecutive water years rather than calendar years and a quantitative comparison<br />
of the wet and dry seasons<br />
• select exceedance thresholds using percentiles<br />
1 Synoptic weather type refers to classification of weather patterns into categories.<br />
vi
<strong>GVRD</strong> Historical and Future <strong>Rainfall</strong> Analysis <strong>Update</strong>: Final Report – PCIC – 1 August 2007<br />
List of abbreviations<br />
AHCCD Adjusted Historical Canadian Climate Data station record<br />
AMRI Annual maximum rainfall intensity<br />
ATEC Annual threshold exceedance frequency<br />
CGCM Canadian Global Climate Model<br />
ENSO El Niño Southern Oscillation (El Niño/La Niña)<br />
GCM Global Climate Model / Global Circulation Model<br />
<strong>GVRD</strong> Greater <strong>Vancouver</strong> Regional District<br />
IPCC Intergovernmental Panel on Climate Change<br />
KWL Kerr Wood Leidal Associates Ltd.<br />
KWL-02 Previous precipitation report completed by KWL in 2002<br />
MMRI Monthly maximum rainfall intensity<br />
MSC Meteorological Service of Canada<br />
MTEC Monthly threshold exceedance<br />
NSC Not significant change<br />
NSD Not sufficient data<br />
OOP Out-of-phase between winter and summer cumulative departures<br />
PCIC Pacific Climate Impacts Consortium www.pacificclimate.org<br />
PDO Pacific Decadal Oscillation<br />
SMMRI Seasonal monthly maximum grouping of rainfall intensity<br />
SMRI Seasonal maximum rainfall intensity<br />
SMTEC Seasonal monthly grouping of threshold exceedance frequency<br />
SRES Special report on emissions scenarios<br />
STEC Seasonal threshold exceedance frequency<br />
SWRI Summer/Winter rainfall intensity<br />
TSEC Time series, monthly threshold exceedance frequency<br />
TSRI Time series, monthly rainfall intensity<br />
vii
(BLANK)
<strong>GVRD</strong> Historical and Future <strong>Rainfall</strong> Analysis <strong>Update</strong>: Final Report – PCIC – 1 August 2007<br />
1 Introduction<br />
1.1 Background<br />
Increased extreme events including more frequent intense rainfall are a possible<br />
consequence of global climate change (Easterling et al. 2000). Examples of impacts of<br />
intense rainfall include flooding and landslides. Recent studies on the rate and occurrence<br />
of extreme rainfall events illustrate trends and patterns of increased rainfall across much<br />
of the globe (Trenberth 2005). In addition, it is important to extract as much information<br />
as possible from historical records for future planning purposes to avoid the<br />
underestimation of climate variability (see Hamlet 2003).<br />
In this context, the Greater <strong>Vancouver</strong> Regional District (<strong>GVRD</strong>) commissioned a study<br />
in 2002 by Kerr Wood Liedal Associates Ltd. (KWL) to examine historical trends in<br />
intensity and frequency of rainfall with duration from 5 minutes to 24 hours as recorded<br />
at selected rain gauges located throughout the <strong>GVRD</strong>. This report is hereafter referred to<br />
as ‘KWL-02’. The findings were also published in a peer-reviewed journal, the Canadian<br />
Water Resources Journal (Jakob et al. 2003).<br />
KWL-02 found that:<br />
• variability of rainfall events is driven in part by PDO and ENSO cycles<br />
• a cool phase of the PDO (a reversal of the warm phase that has been occurring since<br />
1977) may have started after ~1998 or ~1999<br />
• a PDO reversal could affect rainfall intensity<br />
• analysis of high intensity rainfall threshold exceedance showed increasing trends<br />
since the last cool phase (1947-1976) of the PDO<br />
• statistically significant upward trends in rainfall intensity were observed for April,<br />
May and June months, especially for shorter duration trends (up to 2 hours)<br />
Since the publication of the report, additional data has been collected by both the <strong>GVRD</strong><br />
and the Meteorological Service of Canada (MSC). Selected stations were updated with<br />
new information spanning the time period from 2002 to 2005. As well, additional<br />
historical data has become available in the required format. An outline of all data updated<br />
and analysed in this report is included in Appendix B.<br />
1.2 Study Area<br />
The study area comprises the <strong>GVRD</strong>. Figure 1.1 shows a map of the stations and their<br />
annual rainfall amounts. Table 1.1 provides additional details about the stations.<br />
Temperatures recorded at the <strong>Vancouver</strong> Airport average from 3.3°C in January to<br />
17.5°C in July, based on the 1971-2000 climate normal. Average rainfall differs across<br />
the <strong>GVRD</strong>, as shown in Table 1.1 and Figure 1.2. <strong>GVRD</strong> stations receive most of their<br />
precipitation during winter. Hence, in summer and early fall, when demand is at its<br />
greatest, the annual hydrograph is at its lowest point. Note also the correspondence<br />
between elevation and rainfall throughout the <strong>GVRD</strong>. For example, DN25 and DN15/82,<br />
at elevations of 132m and 156.5m, have the highest rainfall, while YVR, at 4m, receives<br />
the lowest amount of rainfall compared to the rest of the stations.<br />
1
<strong>GVRD</strong> Historical and Future <strong>Rainfall</strong> Analysis <strong>Update</strong>: Final Report – PCIC – 1 August 2007<br />
Figure 1.1 Map of rainfall station locations in the <strong>GVRD</strong> and annual mean rainfall amounts.<br />
2
Table 1.1 Station location, elevation, and annual total rainfall<br />
Station Station Location UTM<br />
Easting<br />
UTM<br />
Northing<br />
Elevation<br />
(m)<br />
Annual<br />
Total<br />
<strong>Rainfall</strong><br />
1950-2005<br />
(mm/year)<br />
Annual<br />
Total<br />
<strong>Rainfall</strong><br />
1976-2005<br />
(mm/year)<br />
Number of<br />
years<br />
available<br />
1976-2005<br />
BU31 Confederation<br />
Park<br />
500 161 5 458 953 101.0 1 350 1 520 16<br />
CW09 Westburnco<br />
Reservoir<br />
506 775 5 452 842 126.5 1 319 1 319 26<br />
DN25 District N. Van<br />
Municipal Hall<br />
494 420 5 464 630 132.0 1 757 1 755 30<br />
DN15/82 Cleveland Dam 492 360 5 467 280 156.5 1 847 1 847 13<br />
QT10 Coquitlam City<br />
Hall<br />
514 648 5 458 921 26.7 1 477 1 418 30<br />
VA01 Kitsilano High<br />
School<br />
488 177 5 456 650 63.0 1 255 1 222 28<br />
VA04 Renfrew<br />
Elementary<br />
497 695 5 455 372 88.4 1 366 1 321 30<br />
VA13 Stanley Park Yard 489 362 5 461 300 19.8 1 453 1 508 23<br />
VW14 West Van.<br />
Municipal Hall<br />
488 500 5 464 080 40.0 1 622 2 039 30<br />
PP Pitt Polder 520 811 5 454 862 5.0 2 140 1 433 29<br />
SK Surrey Kwantlen 510 193 5 440 366 78.0 1 430 1 141 29<br />
YVR <strong>Vancouver</strong><br />
International<br />
Airport<br />
4868 87 5 449 705 4.0 1 121 1 520 16<br />
Figure 1.2 Monthly total rainfall, October to September for the <strong>GVRD</strong> stations and MSC stations,<br />
1976–2005.<br />
Average Monthly Total <strong>Rainfall</strong> (mm/year) 1976 - 2005 Climatology<br />
350<br />
300<br />
250<br />
200<br />
150<br />
100<br />
50<br />
BU31<br />
VA01<br />
DN25<br />
DN15<br />
0<br />
Oct Nov Dec Jan Feb Mar April May June July Aug Sep<br />
Month<br />
BU31 CW09 DN25 DN15 QT10 VA01 VA04 VA13 VW14 YVR PP SK
<strong>GVRD</strong> Historical and Future <strong>Rainfall</strong> Analysis <strong>Update</strong>: Final Report – PCIC – 1 August 2007<br />
1.3 Project Purpose and Objectives<br />
Improved understanding of changes to rainfall patterns will assist <strong>GVRD</strong> staff in<br />
planning strategies to adapt to climate change and variability. The purpose of this work is<br />
primarily to update some of the KWL-02 rainfall analysis with additional data that was<br />
not available at the time of that report. Specifically, KWL-02 attempted to answer the<br />
following two questions:<br />
i) Are there trends in rainfall intensity in the <strong>GVRD</strong>?<br />
ii) Are there trends in rainfall threshold exceedance in the <strong>GVRD</strong>?<br />
In addition to updating some of the analysis, the methodology used has been documented<br />
to aid in further work. Recommendations have also been made about other techniques<br />
and tools that may guide future investigations.<br />
Note that this update:<br />
• is not intended to be a complete re-analysis of all of the data and methods used<br />
previously in KWL-02<br />
• is not an attempt at a comprehensive analysis of <strong>GVRD</strong> rainfall (such a study should<br />
begin with a literature review to consider other possible analysis methods)<br />
• is intended to address whether additional data, using a similar methodology to KWL-<br />
02, indicates trends consistent with the original report.<br />
2 Data and Methods<br />
2.1 Historical <strong>Rainfall</strong> Records<br />
In general, total rainfall, intensity durations, and exceedances were updated at <strong>GVRD</strong><br />
stations for 2002 to 2005, with some exceptions as listed in the Appendices. The MSC<br />
stations update included information on total rainfall amounts only, not intensities. Note<br />
that a detailed analysis of shifts in data that could be due to site-specific conditions (i.e.<br />
station movements or adjustments; see Appendix C) has not been made. Future work<br />
could include cumulative departure plots of data to nearby Adjusted Historical Canadian<br />
Climate Data station records (AHCCD, Mekis and Hogg 1999).<br />
Available data are shown schematically in Figure 2.1. A complete accounting of the<br />
original records used in the KWL-02 report and the updated station data is listed in Table<br />
B1 in Appendix B. Table B2 also includes additional details such as specific time periods<br />
and durations as well as notes regarding difficulties using records from certain stations,<br />
such as gaps in the record or short total record length.<br />
4
<strong>GVRD</strong> Historical and Future <strong>Rainfall</strong> Analysis <strong>Update</strong>: Final Report – PCIC – 1 August 2007<br />
Figure 2.1 Plots of time periods used in the annual time series analysis. Gaps indicate missing or<br />
unavailable data.<br />
2010<br />
2000<br />
1990<br />
1980<br />
1970<br />
1960<br />
1950<br />
BU31<br />
CW09<br />
DN25<br />
PP<br />
DN15/82<br />
SK<br />
2.2 Data Derived from Historical <strong>Rainfall</strong> Records<br />
Several time series were derived from the rainfall records. Amount of rainfall that<br />
occurred was analysed in terms of both rainfall intensity and rainfall threshold<br />
exceedance counts, each described in more detail below.<br />
The time series, consisting of one value for each station, were constructed from available<br />
data between 1950 and 2005, for each month independently. In other words, there is a<br />
data value for each year from 1950 to 2005 of the maximum rainfall intensity (mm/hr) of<br />
a given duration or count of exceedances of a certain threshold (#) that occurs in the<br />
given month. Data were also grouped into seasons, as described below.<br />
Historical <strong>Rainfall</strong> Intensity<br />
All rainfall intensities analysed in this report are maximum intensities. The durations<br />
used are 5, 10, 15, 30 minutes, 1, 2, 6, 12 and 24 hour. Note that not all durations were<br />
analysed in all cases and that intensities are reported in mm/hr regardless of duration.<br />
For an illustration of rainfall intensity by duration consider the following hypothetical<br />
day of rainfall: no rain until 09:03 am at which time the following rain falls, and no<br />
further rain falls during the rest of the day:<br />
09:03 – 09:07 6 mm<br />
09:08 – 09:12 5 mm<br />
09:13 – 09:17 2 mm<br />
VA01<br />
VA04<br />
VA13<br />
VW14<br />
YVR<br />
QT10<br />
5
<strong>GVRD</strong> Historical and Future <strong>Rainfall</strong> Analysis <strong>Update</strong>: Final Report – PCIC – 1 August 2007<br />
The maximum rainfall intensity for each duration of this day is calculated as follows.<br />
Table 2.1 Maximum rainfall intensity for hypothetical rain day<br />
Duration 5 10 15 30 1 2 6 12 24<br />
min min min min hr hr hr hr hr<br />
Maximum <strong>Rainfall</strong> (mm) 6 11 13 13 13 13 13 13 13<br />
Maximum <strong>Rainfall</strong><br />
Intensity (mm/hr)<br />
72 66 52 26 13 6.5 2.2 1.1 0.5<br />
Historical <strong>Rainfall</strong> Intensity Parameters<br />
• TSRI: time series of monthly maximum rainfall intensity (raw data)<br />
• MMRI: monthly maximum rainfall intensity that occurred in a given month<br />
• SMMRI: grouping of MMRI results by season (winter: Jan, Feb, Mar; spring: Apr,<br />
May, Jun; summer: Jul, Aug, Sept; fall: Oct, Nov, Dec). Note: in these cases, the<br />
seasonal maximum of the monthly maximums is not taken; the results for individual<br />
months are simply displayed together.<br />
• AMRI: annual maximum value of the rainfall intensities for the calendar year<br />
• SWRI: summer/winter difference between the sum of the monthly maximum rainfall<br />
intensities from April to September (dry season) and the sum of the monthly<br />
maximum intensities from January to March and October to December (wet season)<br />
of the calendar year. Note: this definition takes maximums from months that are not<br />
in consecutive wet seasons.<br />
Historical <strong>Rainfall</strong> Threshold Exceedance<br />
Exceedance calculations were run on 5-minute rainfall data and processed using the<br />
ExceedCount program, as outlined by KWL-02 and described in detail in a memo to<br />
<strong>GVRD</strong> (KWL 2006). ExceedCount will count each exceedance that occurs, including<br />
when a threshold value was exceeded more than once within one day. Thus threshold<br />
exceedance is a measure of the frequency of occurrence of large rainfall intensities. MSC<br />
stations and some <strong>GVRD</strong> stations (DN15/82) were not included in the update due to<br />
insufficient or unavailable data.<br />
Table 2.2 shows the rainfall intensity thresholds that were used to determine whether or<br />
not an exceedance occurred. Typically, a fixed percentile such as the 90 th or 95 th<br />
percentile would be used (Groisman et al. 2005), but these thresholds were determined<br />
empirically (KWL-02) in order to apply consistent thresholds across different stations<br />
and still capture enough data to observe a change in exceedance.<br />
Table 2.2 <strong>Rainfall</strong> exceedance thresholds from KWL-02<br />
Duration 5 min 10 min 15 min 30 min 1 hr 2 hr 6 hr 12 hr 24 hr<br />
Threshold<br />
(mm/hr)<br />
10 10 10 10 6 6 3 2 2<br />
The hypothetical rain day shown above (Table 2.1) would result in one exceedance count<br />
at each of the 5 min, 10 min, 15 min, 30 min, 1 hr, and 2 hr durations.<br />
Historical <strong>Rainfall</strong> Threshold Exceedance Count Parameters<br />
• TSEC: time series of monthly total threshold exceedance counts (raw data)<br />
6
<strong>GVRD</strong> Historical and Future <strong>Rainfall</strong> Analysis <strong>Update</strong>: Final Report – PCIC – 1 August 2007<br />
• MTEC: monthly threshold exceedance counts is the number of times per month that<br />
the threshold was exceeded<br />
• SMTEC: grouping of MTEC results by season (winter: January, February, March;<br />
spring: April, May, June; summer: July, August, September; fall: October, November,<br />
December). Note: in these cases, the seasonal total of the monthly exceedances is not<br />
taken; the results for individual months are simply displayed together.<br />
• STEC: seasonal threshold exceedance counts is the number of times per season the<br />
threshold was exceeded in winter (January, February, March), spring (April, May,<br />
June), summer (July, August, September), and fall (October, November, December)<br />
• ATEC: annual threshold exceedance counts is the number of times per year the<br />
threshold was exceeded<br />
Note that although monthly exceedance data was assembled, analysis was restricted to<br />
seasonal and annual trends due to insufficient occurrences in the monthly time series to<br />
compute trends.<br />
2.3 ENSO and PDO Indices<br />
Indices of the strength of ENSO and PDO were used to examine the influence of largescale<br />
oscillations on variability in rainfall threshold exceedance within the <strong>GVRD</strong>. El<br />
Niño/Southern Oscillation (ENSO) strength can be measured by the Southern Oscillation<br />
Index (SOI). In particular, the SOI dataset applied in this analysis was the same as that<br />
used in KWL-02 2 . Another common source of the SOI index is the Climate Prediction<br />
Centre 3 .<br />
The Pacific Decadal Oscillation (PDO) index data was obtained from the Joint Institute<br />
for the Study of Atmosphere and Ocean (JISAO) 4 . As was done in KWL-02, both PDO<br />
and SOI indices were averaged and standardized based on 1950 onward. A robust method<br />
of analysing ENSO and PDO variability has recently been developed for temperature,<br />
precipitation, and streamflow (Fleming et al. 2007). This method was not applied in this<br />
report, however may be a consideration for future work.<br />
2.4 Statistical Analysis<br />
Historical Linear Trends<br />
For this update, simple regression techniques were employed to analyze MMRI (also<br />
displayed as SMMRI), AMRI, MTEC (also displayed as SMTEC), STEC, and ATEC.<br />
The trend analysis applied uses a non-parametric Mann-Kendall test for trend and Sen's<br />
linear slope estimates (Gilbert 1987).<br />
Non-parametric measures assume a non-normal distribution, and therefore allows for<br />
statistical inference on these non-normal data sets. The MAKESENS EXCEL spreadsheet<br />
template 5 was applied to calculate trends for annual data in all periods, and monthly<br />
maximums for the 5 and 15 minute and the 1 and 6 hour durations.<br />
2 http://www.bom.gov.au/climate/current/soihtm1.shtml<br />
3 http://www.cpc.noaa.gov/data/indices/<br />
4 http://jisao.washington.edu/pdo/PDO.latest<br />
5 http://www.fmi.fi/organization/contacts_25.html<br />
7
<strong>GVRD</strong> Historical and Future <strong>Rainfall</strong> Analysis <strong>Update</strong>: Final Report – PCIC – 1 August 2007<br />
The Sen’s method uses a linear model to estimate the slope of the trend. Although not<br />
always true for the time series used in this analysis, the method assumes that variance of<br />
the residuals is constant in time. Missing values are allowed and the data need not<br />
conform to any particular distribution. As well, the Sen’s method is not greatly affected<br />
by single data errors or outliers.<br />
Statistical Significance of Historical Trends<br />
For a trend to be statistically significant, it must be greater than the year-to-year<br />
variability at the particular station. When the probability of a trend being at least correct<br />
in sign is less than 10% (or p-value
<strong>GVRD</strong> Historical and Future <strong>Rainfall</strong> Analysis <strong>Update</strong>: Final Report – PCIC – 1 August 2007<br />
AMRI figures show raw data, a linear trend line, smoothed data (5-year running average),<br />
and the cumulative departure. All durations are shown.<br />
SWRI figures show cumulative departures, offering a comparison of the difference in<br />
phases of the summer and winter seasonal maximums. All durations are shown.<br />
TSEC figures show smoothed data (12-month running average) for comparison to PDO<br />
and ENSO indices. TSEC and both indices are all standardized before smoothing. Four<br />
durations are shown.<br />
SMTEC figures show the month-by-month values in monthly triplets: January-February-<br />
March, April-May-June, July-August-September, October-November-December. Raw<br />
data and smoothed data (12-year running average) are shown for four durations.<br />
ATEC figures show raw data with a bar graph. All durations are shown.<br />
Linear trend for visual analysis<br />
The linear trends shown in all of the figures described above do not use the Sen’s method<br />
described in statistical analysis above. Thus, trend lines may not yield exactly the same<br />
result as those computed using the statistically robust analysis tools. For the purposes of<br />
the visual analysis, the simple linear trend line (included with EXCEL) is shown on the<br />
graphs.<br />
Smoothed data<br />
Smoothing was applied to the figures described above with either a 5-year, 12-year, or<br />
12-month moving average window.<br />
Cumulative Departure from the Mean<br />
Cumulative departure from the mean was used to determine monthly, annual, winter and<br />
summer deviations from the long term average (1950-2005).<br />
2.6 Recent Extreme Events<br />
The question of whether extreme events are possible indicators of climate change is<br />
beyond the scope of this report. However, a short list of notable recent weather events in<br />
the <strong>GVRD</strong> during the update period (2002-2005) includes:<br />
• May 2002: High snow-pack levels, rapid melting and heavy rainfall caused severe<br />
runoff and flooding in many areas of B.C. except <strong>Vancouver</strong> Island and the Central<br />
Coast. The spring freshet caused significant damage to private properties, public<br />
transportation corridors, and recreation facilities. (Source Provincial Emergency<br />
Program Canadian Disaster Database)<br />
• October 17 – 24 th , 2003: A storm system aided by a powerful Pacific jet stream<br />
brought heavy rains and flooding to areas of Washington and British Columbia during<br />
mid October. In British Columbia, rainfall was described as the heaviest in 100 years,<br />
with around 500 mm (16 inches) of rain falling over an eight-day period in the<br />
Pemberton and Squamish region 6 . Flooding took out the Rutherford Bridge and rail<br />
6 http://www.ncdc.noaa.gov/oa/climate/research/2003/oct/hazards.html<br />
9
<strong>GVRD</strong> Historical and Future <strong>Rainfall</strong> Analysis <strong>Update</strong>: Final Report – PCIC – 1 August 2007<br />
line, displaced hundreds of people from homes in Squamish, Pemberton and Whistler<br />
corridor region. Five people lost their lives.<br />
• January 2005: A warm, moist rainfall event known as a tropical punch, hit the<br />
southwestern part of BC on Sunday January 16th, 2005 (Wikinews 2005). In the 48<br />
hours leading up to Wednesday January 19, 2005 more than 320 mm of rain fell in<br />
the Mt Seymour area (NRCAN 2005). At 3:15 am on January 19, 2005 a landslide of<br />
mud, debris and snow destroyed two homes and killed one person near the Seymour<br />
River in North <strong>Vancouver</strong> (NRCAN 2005, Whyte 2006). The heavy rainfall<br />
continued over a five-day period from January 16th to 20 th , 2005 and temperatures<br />
warmed approximately 12°C, which melted existing snow and contributed to large<br />
runoff volumes (DPM 2005). Variation in rainfall over the <strong>GVRD</strong> area is evident<br />
from the reports of only 130 mm of rain falling in <strong>Vancouver</strong> proper in the three-day<br />
period preceding the landslide (NOAA 2005) and 240 mm of rain falling in Pitt<br />
Meadows over the whole five-day period (DPM 2005), versus the 320 mm measured<br />
on Mt Seymour over only two days.<br />
In addition, several records were broken in the period that occurred after 2005. For<br />
example, the record number of days of rain in one month was broken in January 2006,<br />
and several major rainfall and wind events battered the <strong>GVRD</strong> from November 2006<br />
through January 2007. In November, rainfall in excess of 150 mm occurred within a 15hour<br />
period; this triggered erosion in <strong>GVRD</strong> watersheds that caused temporarily elevated<br />
levels of turbidity, leading to a boil-water advisory that, at times, impacted the majority<br />
of the region’s residents.<br />
2.7 Removal of Outliers<br />
The January 2005 event was the largest of those listed above that occurred within the<br />
2002-2005 update period. Because outliers that fall at the end of a time series may skew<br />
results, further examination was undertaken to understand the amount of influence on<br />
trends. In order to test the effect of this event, it was excluded from trend analysis, and<br />
data was re-analysed (see Table 3.3).<br />
It should be noted, however, that the January 2005 event only appears extreme at one<br />
rainfall station (QT10) for rainfall intensities of 5 minutes to 2 hours, despite causing<br />
significant flooding in regions of the <strong>GVRD</strong>, particularly in North <strong>Vancouver</strong>. For<br />
threshold exceedance, on the other hand, the event appears extreme for BU31, CW09,<br />
and VA04, but none of these stations are located in North <strong>Vancouver</strong>.<br />
While rainfall intensity and threshold frequency are important features of rainfall leading<br />
up to flooding events, there are alternate factors that generate flooding. Examples include<br />
pre-event soil moisture, occurrence of rain-on-snow, number of consecutive days of rain,<br />
total amount of recent rainfall, runoff conditions, imperviousness, tidal conditions, storm<br />
surge, sea level and infrastructure engineering. The need to understand the spatial and<br />
meteorological context of events that cause flooding in the <strong>GVRD</strong> is discussed further in<br />
Section 5.<br />
10
<strong>GVRD</strong> Historical and Future <strong>Rainfall</strong> Analysis <strong>Update</strong>: Final Report – PCIC – 1 August 2007<br />
3 Results and Discussion<br />
In this section, results of linear trend analysis are shown and discussion is provided<br />
along with visual analysis (graphs). An overview is followed by detailed results. Note<br />
that trends are computed as a slope per year and have been converted, in some cases, to<br />
per century. However, the trend does not represent the change that has occurred over the<br />
entire 20 th century because all records used for this analysis begin in 1950 or later.<br />
Results reported in a less technical document should be expressed as per 50 years or per<br />
decade to avoid potential misinterpretation of the trend magnitude.<br />
3.1 Historical <strong>Rainfall</strong> Intensity<br />
3.1.1 Overview of <strong>Rainfall</strong> Intensity Trends<br />
On an annual basis, less than half of the rainfall intensity trends are statistically<br />
significant (Table 3.1) on average across all durations,. Trends that are significant are<br />
generally slight increases, and tend to occur for only a few durations for most stations.<br />
There are few negative trends, they tend to be smaller in magnitude, and none are<br />
statistically significant.<br />
Table 3.1 Summary table of AMRI, SMRI and SWRI trends<br />
Stations Annual (AMRI) Seasonal (SMRI)<br />
Out of Phase<br />
(SWRI)<br />
5, 10, 15 0.5, 1, 2 6, 12, Fall Winter Spring Summer Fall-Winter/<br />
min hr 24<br />
hr<br />
Summer-Spring<br />
BU31 P P P P, P, P P, nt p , P nt p , P, p nt p , nt, P None<br />
CW09 nt p p nt p nt n , nt, N nt p , N, nt p nt p , p, nt p nt p , n, N 5-15min, 2-24hr<br />
DN25 P P p nt p , P, P P, n, P p, P, P nt p , nt p , nt p None<br />
DN15/82 nt p nt n nt n nt n , nt, p nt p , n, nt p n, n, P N, nt n , nt n None<br />
QT10 P p nt p nt p , nt p , n nt p , N, P nt, P, nt p nt p , nt p , nt n 6-24hr<br />
VA01 nt p p p nt p , nt p , nt p , N, P p, p, nt p p, n, nt p 24hr<br />
nt p<br />
VA04 nt p nt p nt p nt p , p, nt p n, N, nt p nt, P, nt p nt p , nt p , nt p 15-30 min,<br />
12-24 hr<br />
VA13 nt p P p P, P, p P, nt, nt p P, P, P P, nt p , nt p 5min-2hr<br />
VW14 nt p P nt p nt n , nt n , P nt p , N, P nt p , nt p , P N, N, nt None<br />
PP nt p nt p nt n P, p, nt n nt p , n, nt p nt p , p, P nt p , p, nt n 5-15min<br />
SK nt p nt p nt P, nt p , p nt n , n, n P, P, P nt p , nt p , nt n 12hr<br />
YVR P P nt p nt p , P, P nt p , nt p , nt p P, p, P nt p , p, nt 2-24hr<br />
DN25 a P P nt p n/c n/c n/c n/c n/c<br />
QT10 a P nt p nt p n/c n/c n/c n/c n/c<br />
Fall = October, November, December<br />
Winter = January, February, March<br />
Spring = April, May, June<br />
Summer = July, August, September<br />
a Alternate years used (see Section 3.1.2)<br />
P = Positive and > 95%<br />
p = Positive and > 90%<br />
nt p = Positive trend < 90%<br />
nt n = Negative trend < 90%<br />
nt = No trend neutral, or<br />
opposing signs < 90%<br />
n = Negative and > 90%<br />
N = Negative and > 95%<br />
n/c = Not calculated<br />
Seasonally, a greater number of significant trends are found with some tendency towards<br />
negative trends. Trends are generally positive in fall and spring, with the greatest number<br />
11
<strong>GVRD</strong> Historical and Future <strong>Rainfall</strong> Analysis <strong>Update</strong>: Final Report – PCIC – 1 August 2007<br />
of positive trends found in the spring months (April, May and June). Summer months<br />
have few significant trends. In winter both positive and negative significant trends occur<br />
– in some cases the same station has trends of opposite sign in different months of the<br />
winter. Detailed monthly trends are shown in Table 3.4.<br />
Visual analysis of SWRI (not shown) indicates that wet (October – March) and dry<br />
season (April – September) cumulative departures are out of phase at 8 of the 12 stations<br />
for at least one duration (although no particular duration is out of phase at more than a<br />
small number of stations). This result occurs even in cases with few significant trends in<br />
the individual months. Thus, a trend towards increasing rainfall intensities for the dry<br />
season is accompanied by a decrease during the wet season and vice versa for those cases<br />
(KWL-02). Further analysis of SWRI should consider consecutive wet years rather than<br />
calendar years and a quantitative comparison of the wet and dry seasons.<br />
Table 3.2 Summary of TSRI cumulative departures from the mean for all stations<br />
Stations Monthly Direction Annual Direction<br />
BU31 NSD NSD NSD NSD<br />
CW09 1992-1995<br />
1996-1998<br />
2004-2005<br />
DN25 1964-1977<br />
1977-1983<br />
1994-2005<br />
-<br />
+<br />
+<br />
-<br />
+<br />
+<br />
1969-1982<br />
1982-1992<br />
2003-2005<br />
1964-1977<br />
1994-2005 -<br />
DN15/82 NSD NSD NSD NSD<br />
QT10 1966-1983 - 1965-1990 -<br />
1994-2005 +<br />
VA01 1964-1977 - 1962-1974 -<br />
1993-2005 + 1992-2005 +<br />
VA04 1972-1980 - 1971-1979 -<br />
1987-1995 - 1987-1995 -<br />
1995-2001 +<br />
2001-2005 -<br />
VA13 1995 -<br />
2002 + NSC<br />
VW14 1964-1972 - 1960-1972 -<br />
1993-1998 + 1982-1998 +<br />
1998-2004 -<br />
PP * 1995-1999 + 1992-1999 +<br />
SK * 1962-1972 -<br />
1978-1984 +<br />
1993-1997 +<br />
YVR * 1964-1977 - 1962-1990 -<br />
1995-1999 + 1995-1999 +<br />
NSD: Insufficient data to determine a trend<br />
NSC: No systematic changes in the data record<br />
* Data to 2000 only<br />
<strong>Rainfall</strong> intensity cumulative departures from the mean (TSRI) are summarized in Table<br />
3.2. In this analysis, sequences of years above or below the long-term average are<br />
indicated in the table. In general, periods of below average rainfall intensity are observed<br />
during the 1960s to the mid-1970s, while periods of above average rainfall intensity are<br />
+<br />
-<br />
+<br />
-<br />
12
<strong>GVRD</strong> Historical and Future <strong>Rainfall</strong> Analysis <strong>Update</strong>: Final Report – PCIC – 1 August 2007<br />
observed for the mid-1990s to present. At VA01 and VW14, this situation reverses to a<br />
negative departure until 2005. However, at most (four) of the stations, the period of<br />
above average intensity continues into 2005.<br />
In summary, there is some weak, statistically significant evidence for increasing rainfall<br />
intensity over time found in AMRI, primarily in the 5-minute to 2-hour periods at 8 out<br />
of 12 stations. Statistically significant trends in MMRI are found at more stations during<br />
the winter and spring, while summer trends occur only at a few stations. However, trends<br />
are relatively weak: statistically significant increases of 10 mm/hr per century or higher<br />
are shown in bold in the tables but occur in only 10% of the cases examined.<br />
Note: this threshold is meant as a qualitative aid to interpreting magnitude of change<br />
only; since each station has a different climatology and variability the best guide to the<br />
relative importance of a trend is its level of statistical significance. Cumulative departures<br />
from the normal indicate that periods of lower intensity occurred generally in the early<br />
1960s to the mid-1970s, with mainly above average intensity from the mid-1990s to<br />
present. In order to better understand the mechanisms behind the observed changes in<br />
rainfall intensity, more in-depth analysis is required.<br />
3.1.2 Detailed Analysis<br />
<strong>Rainfall</strong> trend analysis (annual) results are given below (Table 3.3) and summarized in<br />
Table 3.1. Significant positive trends (increasing intensity) are observed at 8 of the 12<br />
stations examined. Most trends are weak but stations with the largest trends include:<br />
BU31, DN25, QT10 and YVR. Most often, the significant trends that are larger than 10<br />
mm/hr per century occur within the 5-30 minute duration rainfall records. The 2 hour<br />
duration has significant, although weak, increasing rainfall intensities at six out of 12<br />
stations.<br />
Both DN25 and QT10 were tested using alternative time periods to determine the impact<br />
of specific events. At DN25, the installation of a cooling tower in 1994 (discussed and<br />
analysed in KWL-02) necessitated checking of rainfall intensity records from the period<br />
of record prior to installation of the cooling tower. Prior to 1994, increases in rainfall<br />
intensity remain significant and strong in comparison to other findings (20 to 60 mm/hr<br />
per century increases for 5 minutes to 30 minute durations, respectively). Even with the<br />
installation of the cooling tower, increases to rainfall intensity are occurring at DN25.<br />
However, the impact of the cooling tower installation on rainfall intensity cannot be fully<br />
understood without undertaking additional work, as outlined in KWL-02.<br />
In the case of QT10, a large rainfall event that occurred at the end of the record (2005)<br />
may have skewed records towards an artificially high rainfall intensity trend. However,<br />
even with the removal of 2005, the 10-minute rainfall duration events are significant and<br />
still 27 mm/hr per century as compared with 31 mm/hr per century with the 2005 record<br />
included.<br />
Results of MMRI trend analysis are given in Table 3.4 for four durations: 5 minute, 15<br />
minute, 1 hour and 6 hour (Table 3.1). The monthly trends for all stations and each month<br />
13
<strong>GVRD</strong> Historical and Future <strong>Rainfall</strong> Analysis <strong>Update</strong>: Final Report – PCIC – 1 August 2007<br />
are given, including their significance level. The overall count of significant trends (at<br />
both the 95 and 90% confidence intervals) is shown in Figure 3.1. The highest number of<br />
significant rainfall events occurs in May and June at the 95% level. The month of May<br />
had a slightly greater number of significant rainfall events. This result holds at the 90%<br />
confidence level as well (Figure 3.1b). If the counts are totaled for each season, the spring<br />
season shows the greatest number of significant, positive rainfall events occurring (see<br />
lines indicating seasonal totals in Figure 3.1a).<br />
Table 3.3 AMRI trend (mm/hr per century) for all durations<br />
Stations 5min 10min 15min 30min 1hr 2hr 6hr 12hr 24hr<br />
BU31 34 17 14<br />
7 6 3 2 2<br />
* × × 8 ** ** * * ×<br />
CW09<br />
4<br />
18 20 12 9 × 2 1 0 -1<br />
DN25 64 44 36 19 10 6 3 3<br />
** *** *** ** *** **<br />
× 1<br />
DN15/82 -8 10 0 -4 -3 0 -1 0 -2<br />
QT10<br />
31<br />
5<br />
19 * 15 8 × 2 1 0 0<br />
VA01<br />
4 3<br />
22 7 5 6 2 * * 0 0<br />
VA04 0 4 0 2 2 3 2 1 0<br />
VA13<br />
4 3<br />
15 0 8 3 3 * × 2 1<br />
VW14<br />
5 5 5<br />
12 -95 9 × × * 2 0 0<br />
PP 48 22 21 11 3 0 -4 -4 NA<br />
SK 7 5 7 6 2 -1 0 -1 NA<br />
YVR 40<br />
6<br />
* 22 10 9 5 ** 1 0 0<br />
DN25a 61 46 38 20 9 7<br />
* * * * * × 0 0 -2<br />
QT10a<br />
27<br />
14 × 11 6 4 1 1 0 0<br />
*** Significant at 99.9%<br />
** Significant at 99%<br />
* Significant at 95%<br />
× Significant at 90%<br />
Bold >= 10 mm/hr per century and significant<br />
NA Not available<br />
DN25a/QT10a Alternate years used (see Section 3.1.2)<br />
The numbers of significant rainfall trends stronger than 10 mm/hr per century are<br />
indicated with bold (Table 3.4). These relatively large trends occur most frequently in 5minute<br />
and 15-minute durations and in the spring months of April, May and June. The<br />
strongest of these are occurring in the 5-minute duration during June. Also of note are the<br />
5-minute rainfall trends occurring in October at PP and SK. MMRI decreased in<br />
February, with negative trends for the 1 and 6 hour durations.<br />
14
<strong>GVRD</strong> Historical and Future <strong>Rainfall</strong> Analysis <strong>Update</strong>: Final Report – PCIC – 1 August 2007<br />
Figure 3.1 Distribution of months with positive trends that are significant at the (a) 95%, and (b)<br />
90% level for MMRI. Lines indicate seasonal groupings for winter, spring, summer and fall.<br />
Count of Significant Trends<br />
Count of Significant Trends<br />
35<br />
30<br />
25<br />
20<br />
15<br />
10<br />
5<br />
0<br />
60<br />
50<br />
40<br />
30<br />
20<br />
10<br />
0<br />
8<br />
9<br />
13<br />
0<br />
13<br />
0<br />
5<br />
4<br />
6<br />
10<br />
32<br />
14<br />
52<br />
24<br />
12<br />
18<br />
0 0<br />
4<br />
2 2<br />
Jan Feb Mar April May June July Aug Sept Oct Nov Dec<br />
8<br />
1<br />
6 6<br />
Jan Feb Mar April May June July Aug Sept Oct Nov Dec<br />
1<br />
8<br />
19<br />
31<br />
11<br />
a.<br />
7<br />
12<br />
b.<br />
15
<strong>GVRD</strong> Historical and Future <strong>Rainfall</strong> Analysis <strong>Update</strong>: Final Report – PCIC – 1 August 2007<br />
Table 3.4a-3.4l MMRI trend analysis for monthly values January – December. Values in bold are<br />
significant and trends are >= .10 mm/hr per year (10 mm/hr per century) over the period of record.<br />
Statistical significance is indicated in the column preceding the trend.<br />
a. January<br />
5 min 15 min 1 hr 6 hr<br />
<strong>GVRD</strong> BU31 ** 0.13 ** 0.08 ** 0.05 ** 0.04<br />
CW09 0.00 0.00 0.00 -0.01<br />
DN25 0.06 0.07 * 0.06 0.04<br />
DN1582 0.00 0.03 0.04 0.02<br />
QT10 0.00 0.00 0.00 -0.09<br />
VA01 0.00 0.01 0.00 -0.02<br />
VA04 0.00 × -0.07 -0.04 -0.08<br />
VA13 × 0.03 ** 0.05 ** 0.04 * 0.02<br />
VW14 0.00 0.00 0.00 0.00<br />
MSC PP 0.00 0.00 0.00 0.00<br />
SK 0.10 0.00 0.01 0.01<br />
YVR 0.00 0.00 0.00 -0.01<br />
b. February<br />
5 min 15 min 1 hr 6 hr<br />
<strong>GVRD</strong> BU31 0.00 0.00 0.00 0.00<br />
CW09 0.00 -0.03 -0.02 ** -0.03<br />
DN25 0.00 0.00 -0.04 × -0.04<br />
DN1582 -0.02 -0.04 × -0.06 -0.03<br />
QT10 0.00 0.00 -0.02 ** -0.03<br />
VA01 0.00 * -0.05 * -0.04 × -0.02<br />
VA04 0.00 * -0.05 ** -0.04 ** -0.03<br />
VA13 0.00 0.00 -0.01 -0.01<br />
VW14 ** -0.11 *** -0.10 *** -0.07 *** -0.05<br />
MSC PP 0.13 0.02 -0.04 × -0.04<br />
SK 0.05 0.01 0.00 × -0.03<br />
c. March<br />
YVR 0.00 0.02 0.00 -0.01<br />
5 min 15 min 1 hr 6 hr<br />
<strong>GVRD</strong> BU31 ** 0.11 ** 0.08 * 0.04 0.01<br />
CW09 0.00 0.01 0.01 0.00<br />
DN25 0.00 0.02 × 0.03 × 0.02<br />
DN1582 0.02 0.03 0.02 0.01<br />
QT10 0.00 0.02 * 0.04 0.02<br />
VA01 0.00 0.00 0.02 × 0.02<br />
VA04 0.00 0.00 0.00 0.00<br />
VA13 0.00 0.01 0.00 0.00<br />
VW14 0.05 × 0.05 * 0.03 -0.01<br />
MSC PP 0.10 0.04 0.05 0.00<br />
SK 0.00 -0.04 0.00 × -0.03<br />
YVR 0.08 0.07 0.02 0.00<br />
*** Significant at 99.9%<br />
** Significant at 99%<br />
* Significant at 95%<br />
× Significant at 0.10 or 90%<br />
Bold >= .10 mm/hr per year and significant<br />
16
<strong>GVRD</strong> Historical and Future <strong>Rainfall</strong> Analysis <strong>Update</strong>: Final Report – PCIC – 1 August 2007<br />
d. April<br />
5 min 15 min 1 hr 6 hr<br />
<strong>GVRD</strong> BU31 0.02 0.03 0.02 0.01<br />
CW09 0.02 0.04 0.01 -0.03<br />
DN25 × 0.16 0.05 0.03 0.01<br />
DN1582 -0.04 -0.03 -0.02 × -0.03<br />
QT10 0.00 0.00 -0.01 -0.00<br />
VA01 0.10 × 0.05 0.02 0.01<br />
VA04 0.01 0.03 -0.01 -0.01<br />
VA13 ** 0.11 ** 0.08 * 0.03 0.01<br />
VW14 0.08 0.06 0.00 -0.02<br />
MSC PP 0.15 0.00 -0.04 0.00<br />
SK * 0.20 * 0.14 × 0.05 0.00<br />
e. May<br />
YVR × 0.20 0.06 * 0.06 0.02<br />
5 min 15 min 1 hr 6 hr<br />
<strong>GVRD</strong> BU31 × 0.15 × 0.10 ** 0.06 * 0.02<br />
CW09 × 0.15 × 0.08 × 0.04 -0.01<br />
DN25 × 0.18 0.13 * 0.07 0.00<br />
DN1582 0.05 0.05 0.05 × -0.04<br />
QT10 ** 0.23 ** 0.15 ** 0.06 0.01<br />
VA01 × 0.10 × 0.065 0.03 0.00<br />
VA04 ** 0.23 * 0.12 *** 0.07 × 0.02<br />
VA13 ** 0.18 *** 0.13 ** 0.06 0.01<br />
VW14 0.08 0.06 * 0.05 -0.00<br />
MSC PP 0.24 0.17 × 0.12 0.03<br />
SK 0.08 0.08 * 0.07 0.08<br />
f. June<br />
YVR × 0.26 0.11 × 0.04 -0.00<br />
5 min 15 min 1 hr 6 hr<br />
<strong>GVRD</strong> BU31 × 0.23 0.10 0.04 0.01<br />
CW09 0.03 0.06 0.00 -0.02<br />
DN25 ** 0.42 * 0.20 * 0.10 0.01<br />
DN1582 * 0.25 × 0.14 0.04 -0.01<br />
QT10 0.00 0.06 0.01 0.01<br />
VA01 0.11 0.08 0.04 0.01<br />
VA04 0.00 0.01 0.07 0.01<br />
VA13 * 0.15 × 0.07 0.03 0.01<br />
VW14 * 0.37 * 0.27 0.05 × -0.03<br />
MSC PP ** 0.71 * 0.32 0.08 -0.01<br />
SK ** 0.40 × 0.20 0.07 × 0.03<br />
YVR × 0.26 * 0.17 * 0.08 0.02<br />
*** Significant at 99.9%<br />
** Significant at 99%<br />
* Significant at 95%<br />
× Significant at 90%<br />
Bold >= .10 mm/hr per year and significant<br />
17
<strong>GVRD</strong> Historical and Future <strong>Rainfall</strong> Analysis <strong>Update</strong>: Final Report – PCIC – 1 August 2007<br />
g. July<br />
5 min 15 min 1 hr 6 hr<br />
<strong>GVRD</strong> BU31 0.00 0.00 0.03 0.02<br />
CW09 0.00 0.00 0.02 -0.03<br />
DN25 0.00 0.00 -0.01 0.01<br />
DN1582 -0.07 -0.02 -0.01 * -0.04<br />
QT10 0.05 0.04 0.01 0.01<br />
VA01 × 0.15 0.08 0.04 0.01<br />
VA04 0.00 0.00 0.01 0.00<br />
VA13 × 0.17 0.08 × 0.06 × 0.02<br />
VW14 -0.14 -0.06 0.00 * -0.06<br />
MSC PP 0.00 0.00 0.00 -0.02<br />
SK 0.00 0.05 0.02 -0.01<br />
h. August<br />
YVR 0.17 0.10 0.04 0.01<br />
5 min 15 min 1 hr 6 hr<br />
<strong>GVRD</strong> BU31 0.00 0.00 -0.02 0.00<br />
CW09 -0.16 -0.10 -0.05 × -0.04<br />
DN25 0.00 0.00 0.00 0.00<br />
DN1582 -0.30 -0.13 -0.03 -0.03<br />
QT10 -0.01 0.00 0.00 0.00<br />
VA01 × -0.09 × -0.06 -0.03 -0.01<br />
VA04 0.08 0.01 0.01 0.00<br />
VA13 0.00 -0.02 -0.01 -0.01<br />
VW14 × -0.23 × -0.13 -0.04 ** -0.05<br />
MSC PP × 0.39 0.27 0.08 0.03<br />
SK 0.17 0.03 0.00 -0.01<br />
YVR 0.13 0.08 × 0.07 0.02<br />
i. September<br />
5 min 15 min 1 hr 6 hr<br />
<strong>GVRD</strong> BU31 * 0.19 × 0.11 0.03 0.00<br />
CW09 -0.15 -0.10 -0.05 * -0.05<br />
DN25 0.08 0.00 0.00 -0.01<br />
DN1582 -0.04 -0.08 -0.05 -0.04<br />
QT10 -0.09 -0.02 -0.02 -0.02<br />
VA01 0.02 0.04 0.02 -0.01<br />
VA04 0.16 0.10 0.03 -0.01<br />
VA13 0.09 0.08 0.04 0.02<br />
VW14 -0.02 -0.02 0.00 -0.03<br />
MSC PP 0.23 -0.01 -0.03 -0.03<br />
SK 0.00 -0.11 -0.03 -0.02<br />
YVR 0.11 0.03 -0.01 -0.02<br />
*** Significant at 99.9%<br />
** Significant at 99%<br />
* Significant at 95%<br />
× Significant at 90%<br />
Bold >= .10 mm/hr per year and significant<br />
18
<strong>GVRD</strong> Historical and Future <strong>Rainfall</strong> Analysis <strong>Update</strong>: Final Report – PCIC – 1 August 2007<br />
j. October<br />
5 min 15 min 1 hr 6 hr<br />
<strong>GVRD</strong> BU31 × 0.13 * 0.11 × 0.04 0.02<br />
CW09 -0.04 -0.06 -0.02 0.00<br />
DN25 0.12 0.06 0.03 0.00<br />
DN1582 -0.11 -0.02 -0.02 -0.03<br />
QT10 0.00 0.00 0.00 0.00<br />
VA01 0.00 0.00 -0.00 0.01<br />
VA04 0.00 0.05 0.02 -0.00<br />
VA13 0.00 0.05 0.04 * 0.03<br />
VW14 -0.00 -0.00 0.01 -0.01<br />
MSC PP ** 0.45 * 0.19 0.06 0.01<br />
SK * 0.34 * 0.20 0.03 -0.01<br />
YVR 0.00 0.05 0.02 0.01<br />
k. November<br />
5 min 15 min 1 hr 6 hr<br />
<strong>GVRD</strong> BU31 × 0.08 × 0.06 *** 0.08 ** 0.05<br />
CW09 -0.01 -0.01 0.00 0.00<br />
DN25 0.05 0.04 * 0.06 ** 0.05<br />
DN1582 -0.04 -0.04 0.00 0.01<br />
QT10 0.00 0.00 0.01 0.01<br />
VA01 0.00 0.03 0.02 0.01<br />
VA04 0.00 0.00 0.03 × 0.03<br />
VA13 0.04 0.00 × 0.03 * 0.02<br />
VW14 -0.07 -0.03 -0.01 0.00<br />
MSC PP 0.09 × 0.13 0.03 0.01<br />
SK 0.06 0.00 0.01 0.02<br />
YVR 0.06 0.04 * 0.06 0.01<br />
l. December<br />
5 min 15 min 1 hr 6 hr<br />
<strong>GVRD</strong> BU31 ** 0.13 * 0.08 × 0.04 0.01<br />
CW09 0.06 × 0.06 0.01 * -0.05<br />
DN25 ** 0.21 *** 0.17 ** 0.08 0.03<br />
DN1582 0.10 × 0.10 0.03 0.02<br />
QT10 0.00 0.00 -0.01 × -0.03<br />
VA01 0.07 0.05 0.00 -0.01<br />
VA04 0.00 0.00 0.00 -0.01<br />
VA13 0.00 × 0.05 0.01 0.01<br />
VW14 0.02 * 0.05 0.00 -0.01<br />
MSC PP 0.00 -0.07 -0.04 -0.04<br />
SK × 0.13 0.03 0.03 0.01<br />
YVR * 0.12 0.03 0.02 0.00<br />
*** Significant at 99.9%<br />
** Significant at 99%<br />
* Significant at 95%<br />
× Significant at 90%<br />
Bold >= .10 mm/hr per year and significant<br />
19
<strong>GVRD</strong> Historical and Future <strong>Rainfall</strong> Analysis <strong>Update</strong>: Final Report – PCIC – 1 August 2007<br />
3.1.3 Effect of 2002-2005 data update on Historical <strong>Rainfall</strong> Intensity trends<br />
The effect of data from 2002 to 2005 on rainfall intensity trends was examined. Results<br />
are shown in Table 3.5, which may be compared to Table 3.3 (AMRI up to 2005). In<br />
general, rainfall trends as observed in KWL-02 are still occurring, and most relationships<br />
have become more accentuated since 2001. BU31 and QT10 have stronger trends in<br />
rainfall intensity in their 5- and 10-minute rainfall records with the inclusion of the 2005<br />
data. However, VW14’s trend to 2001 of 18 mm/hr per century is significant at the 90%<br />
confidence interval for the 15-minute duration but the trend is smaller (9 mm/hr per<br />
century) and no longer significant with data up to 2005 included. The trend at DN25 is<br />
also weaker with data up to 2005.<br />
Table 3.5 AMRI trends 1950-2001. Bold values are >= 10 mm/hr per century.<br />
Stations 5min 10min 15min 30min 1hr 2hr 6hr 12hr 24hr<br />
BU31<br />
7 6 3<br />
9 4 8 8 * ** × 2 1<br />
CW09<br />
6<br />
0 28 13 10 × 1 1 -2 -1<br />
DN25 68 54 46 24 13 8 4 3<br />
** ** *** *** *** ** × × 0<br />
DN15/82 -30 -8 0 -3 0 0 1 1 -2<br />
QT10<br />
5<br />
16 20 15 8 × 1 1 -1 -1<br />
VA01<br />
5 2<br />
19 8 7 8 4 * × 0 -1<br />
VA04 -8 2 0 0 2 3 2 0 0<br />
VA13<br />
5 3<br />
17 0 15 8 6 * * 1 0<br />
VW14<br />
18 7 7 5<br />
20 0 × * * * 3 0 -1<br />
***<br />
**<br />
*<br />
×<br />
Bold<br />
Significant at 99.9%<br />
Significant at 99%<br />
Significant at 95%<br />
Significant at 90%<br />
>= 10 mm/hr per century and significant<br />
Figure 3.2a shows the trends of average rainfall intensities for all stations, based on the<br />
data from 1950 to 2001 versus the data from 1950 to 2005. Trends have been calculated<br />
as a per century value to allow for comparison between the two data periods. The 5minute<br />
duration contains the greatest average change between the two data sets. Figure<br />
3.2b shows differences in rainfall intensities at station DN25 over the two periods. In<br />
almost all durations, with the exception of the 24-hour duration, DN25 trends are lower<br />
(less rainfall intensity) with the additional data up to 2005.<br />
20
<strong>GVRD</strong> Historical and Future <strong>Rainfall</strong> Analysis <strong>Update</strong>: Final Report – PCIC – 1 August 2007<br />
Figure 3.2 AMRI trends (mm/hr per century) for (a) average of 9 stations (BU31, QT10, CW09,<br />
DN25, DN15/82, VA01, VA04, VA13, VW14) and (b) DN25.<br />
Duration of <strong>Rainfall</strong><br />
24 hr<br />
12 hr<br />
6 hr<br />
2 hr<br />
1 hr<br />
30 min<br />
15 min<br />
10 min<br />
5 min<br />
Duration of <strong>Rainfall</strong><br />
24 hr<br />
12 hr<br />
6 hr<br />
2 hr<br />
1 hr<br />
30 min<br />
15 min<br />
10 min<br />
5 min<br />
0.0 5.0 10.0 15.0 20.0 25.0<br />
AMRI Trends for Nine Stations (mm/hr per century)<br />
1950 to 2005<br />
1950 to 2001<br />
0 10 20 30 40 50 60 70 80<br />
AMRI for DN25 (mm/hr per century)<br />
3.2 Historical Threshold Exceedance Frequency<br />
b.<br />
a.<br />
1950 to 2005<br />
1950 to 2001<br />
3.2.1 Summary of Historical Threshold Exceedance Frequency Trends<br />
In addition to rainfall intensity, analysis of the frequency of events exceeding a specific<br />
threshold allows for consideration of not only of the maximum rainfall intensity<br />
occurring over time, but also the second, third and n th most intense rainfalls as well.<br />
Threshold exceedances analysis counts the number of times a certain rainfall threshold is<br />
exceeded over time (see Table 2.1).<br />
Table 3.6 provides an overall summary of the trends in exceedance thresholds. Only<br />
stations with available data were analyzed (see Appendix B). Short duration (
<strong>GVRD</strong> Historical and Future <strong>Rainfall</strong> Analysis <strong>Update</strong>: Final Report – PCIC – 1 August 2007<br />
Table 3.6 Summary of ATEC and STEC trends<br />
Stations Annual Seasonal<br />
5, 10, 15 30, 1, 2 6, 12, 24 Winter Spring Summer Fall<br />
min hr hr<br />
BU31 Positive Positive Positive No trend Positive No trend Positive<br />
CW09 Negative No trend No trend Negative No trend Negative Negative<br />
DN25 Positive Positive No trend No trend Positive No trend Positive<br />
QT10 Negative Positive No trend No trend Positive No trend Negative<br />
VA01 Positive Positive No trend Negative Positive No trend No trend<br />
VA04 No trend No trend Negative Negative Positive No trend No trend<br />
VA13 Positive Positive Positive No trend Positive Positive Positive<br />
VW14 Negative Negative Negative No trend No trend Negative Negative<br />
Visual inspection of rainfall intensity and threshold exceedance time series (not shown)<br />
shows peaks of ATEC in the late 1960s, the mid 1970s, the early-1980s, 1991/92, the mid<br />
to late 1990s (1996 and 1997/98), and in 2003/2005.<br />
Table 3.7 Years of extreme values of ATEC at selected stations.<br />
Stations 5min 10min 15min 30min 1hr 2hr 6hr 12hr 24hr<br />
BU31 97, 05 97, 95 97, 95 05, 97 95, 05 95, 95 90, 95 90, 95 96, 92<br />
CW09<br />
86,<br />
86, 80 81, 80 86, 81 96, 97 80, 86 80, 05 97, 84 80, 84 98-96<br />
DN25 81, 97 81, 97 81, 97 97, 81 97, 99 97, 99 95 80 97/95<br />
QT10 91 91 81 03 84 03, 86 75, 84 67, 74 98, 59<br />
VA01 96 96 96 96, 04 96 99 71, 96 75, 96 98<br />
VA04<br />
05/60/ 00, 96,<br />
97, 98 97, 01 97, 60 60 61/68 05/68 59/61 90, 98 96<br />
VA13<br />
88,<br />
96 96 96 96, 91 96, 98 91/96 90 90 90<br />
VW14 91 91 91 91 91 91 92 91 91<br />
Two years are shown for most stations, however in some cases only one year stood out. A slash between<br />
years indicates the same extreme threshold exceedance value was found in both or multiple years.<br />
3.2.2 Detailed Results of Historical Threshold Exceedance Trends<br />
Table 3.8 and 3.9 show the ATEC and STEC trends. At CW09 and VW14, shorter<br />
records (
<strong>GVRD</strong> Historical and Future <strong>Rainfall</strong> Analysis <strong>Update</strong>: Final Report – PCIC – 1 August 2007<br />
Stations 5min 10min 15min 30min 1hr 2hr 6hr 12hr 24hr<br />
BU31 52 39 28 14 32 13 25 21 8<br />
*** *** *** *** *** *** *** *** **<br />
CW09 & -175 -75<br />
** * -22 0 -14 0 -10 -14 0<br />
QT10 -24<br />
6<br />
× -15 -4 * 0 0 -6 -7 0<br />
VA01 13 11 7 7 11 5<br />
× * × ** ** * 0 283 0<br />
VA04<br />
-8<br />
12 4 3 3 -3 3 × - 7 0<br />
VA13 40 26 18 9 21 6 17 9 3<br />
*** *** *** *** *** ** *** × *<br />
VW14 & -229 -156 -122 -50 -78 -38 -64 -57<br />
* * ** * * * × × -31<br />
***<br />
**<br />
Significant at 99.9%<br />
Significant at 99%<br />
* Significant at 95%<br />
× Significant at 90%<br />
& < 30 years of data available<br />
Seasonal summaries are given below in Table 3.9. Positive, statistically significant<br />
increases in the spring months (April, May and June) indicate rainfall threshold<br />
exceedance frequency is rising during these months. Note, however, that statistical<br />
significance in Table 3.9 does not necessarily indicate the presence of a robust trend, as it<br />
does for ATEC and rainfall intensity trends due to the presence in some cases of several<br />
years with no exceedances. Further work should consider the use of trend analysis<br />
specifically for discrete variables in order to properly investigate trends in STEC (and<br />
possibly MTEC).<br />
23
<strong>GVRD</strong> Historical and Future <strong>Rainfall</strong> Analysis <strong>Update</strong>: Final Report – PCIC – 1 August 2007<br />
Table 3.9 STEC trends (# of occurrences per year)<br />
a. Winter<br />
5 min 15 min 1 hr 6 hr<br />
<strong>GVRD</strong> BU31 0.00 0.00 0.00 0.00<br />
CW09 & * -0.25 * -0.25 0.00 0.00<br />
DN25 0.00 0.00 0.00 0.04<br />
QT10 -0.04 0.00 0.00 × -0.04<br />
VA01 0.00 0.00 * -0.04 0.00<br />
VA04 0.00 -0.03 * -0.04 ** -0.06<br />
VA13 0.03 × 0.00 0.00 0.00<br />
VW14 & b. Spring<br />
-0.36 0.00 0.00 -0.10<br />
5 min 15 min 1 hr 6 hr<br />
<strong>GVRD</strong> BU31 ** 0.21 0.06 × 0.00 0.00<br />
CW09 & -0.31 -0.31 0.00 0.00<br />
DN25 ** 0.21 * 0.09 *** 0.12 0.00<br />
QT10 0.05 × 0.03 × 0.00 * 0.00<br />
VA01 * 0.05 0.00 0.00 * 0.03<br />
VA04 * 0.05 0.05 0.00 0.00<br />
VA13 *** 0.14 *** 0.06 *** 0.05 × 0.00<br />
VW14 & c. Summer<br />
-0.50 -0.25 -0.25 * -0.14<br />
5 min 15 min 1 hr 6 hr<br />
<strong>GVRD</strong> BU31 0.00 0.00 0.00 0.00<br />
CW09 & * -0.40 * -0.40 -0.06 -0.06<br />
DN25 0.00 0.00 0.00 0.00<br />
QT10 -0.03 0.00 0.00 0.00<br />
VA01 0.03 0.03 0.00 0.00<br />
VA04 0.03 0.00 0.00 0.00<br />
VA13 * 0.07 × 0.02 0.00 * 0.00<br />
VW14 & d. Fall<br />
* -0.86 × -0.25 × -0.25 0.00<br />
5 min 15 min 1 hr 6 hr<br />
<strong>GVRD</strong> BU31 0.08 + 0.14 * 0.08 * 0.09<br />
CW09 & ** -0.80 ** -0.80 -0.13 -0.13<br />
DN25 0.08 0.00 + 0.11 0.00<br />
QT10 * -0.17 -0.04 0.00 0.00<br />
VA01 0.03 0.00 0.00 0.03<br />
VA04 0.03 0.00 0.00 0.00<br />
VA13 * 0.12 0.02 * 0.08 ** 0.10<br />
VW14 & * -0.88 ** -0.50 ** -0.50 -0.33<br />
*** Significant at 99.9%<br />
** Significant at 99%<br />
* Significant at 95%<br />
× Significant at 90%<br />
& < 30 years of data available<br />
24
<strong>GVRD</strong> Historical and Future <strong>Rainfall</strong> Analysis <strong>Update</strong>: Final Report – PCIC – 1 August 2007<br />
3.3 Cycles of Historical Climate Variability<br />
Climate variability in BC is particularly influenced by two key factors: i) the El Niño<br />
Southern Oscillation (ENSO) and ii) the Pacific Decadal Oscillation (PDO). The effects<br />
of PDO and ENSO in Western North America are well documented (Fleming 2006,<br />
Wang et al. 2006, Stahl et al. 2006).<br />
ENSO is a tropical Pacific phenomenon that influences weather around the world and<br />
across Canada. There is evidence that ENSO has occurred for millennia (Sandweiss et al.<br />
1996) with cycles lasting 2 to 7 years and events persisting for 6 to 18 months. On<br />
average, warm “El Niño” events bring warmer temperatures and less precipitation to BC,<br />
while cool “La Niña” events bring cooler and wetter conditions.<br />
The PDO is a pattern of mid-latitude climate variability with a much longer time scale<br />
than ENSO (~20-30 year cycles, Mantua et al. 1997). The most recent PDO shift<br />
occurred in 1976, resulting in a positive (warm) phase that dominated from 1977 to (at<br />
least) the mid-1990s (Hare and Mantua 2000). Chen et al. (1996) compared the winters<br />
from 1950-59 to those from 1985-90 and found a decreasing trend in precipitation north<br />
of 36 º N.<br />
There is a strong link between ENSO and PDO in that the phase of PDO amplifies or<br />
dampens effects of ENSO events (Gershonov and Barnett 1998, Hamlet and Lettenmaier<br />
1999, Snover et al. 2003). Note also that the relative frequency and intensity of ENSO<br />
and PDO are changing in response to global climate change (Trenberth and Hurrell 1994,<br />
Timmermann 1999). In other words, ENSO and PDO may begin to impact local climate<br />
in a way that has not been observed thus far. Trenberth et al. (2005) discusses the<br />
changing character of precipitation that may occur as a result of climate change.<br />
KWL-02 reports that the two most significant periods of threshold exceedances coincide<br />
with the two most intense El Niño events of the 20 th century for rainfall intensity<br />
durations up to 1 hour. Visual comparison of PDO and SOI (an ENSO index – see<br />
Section 2) to exceedance threshold time series (not shown) shows a subjective, weak<br />
coincidence of high exceedances with positive SOI (La Niña events) prior to 1976/77 and<br />
with positive PDO afterwards. Higher variability in the exceedances records also appears<br />
post-76/77. This interpretation lends support to the need for further (quantitative)<br />
investigation of this possible result. However, visual inspection of highly variable data is<br />
not suitable for determination of a cause and effect relationship, and results report in this<br />
manner must be treated with caution.<br />
There is evidence that following the strong 1997/98 El Niño, a major transition in the<br />
North Pacific occurred (Rodionov et al. 2004). The PDO index switched signs to<br />
negative and remained so through the summer of 2002. During the winter of 2002/2003,<br />
however, the PDO index was positive (Peterson and Schwing 2003). Note, however that<br />
the annual PDO index can be misleading since the PDO tends to stay in each phase on a<br />
much longer time scale (~20-30 years) and short term anomalies in the index can occur<br />
within a phase. Thus, a consensus on whether we are now in a negative PDO has not been<br />
reached within the scientific community.<br />
25
<strong>GVRD</strong> Historical and Future <strong>Rainfall</strong> Analysis <strong>Update</strong>: Final Report – PCIC – 1 August 2007<br />
Some research suggests that conditions in the North Pacific may have moved out of<br />
oscillating between positive and negative PDO and infers that different spatial patterns in<br />
sea level pressure (SLP) and sea surface temperature (SST) are to be expected (Bond et<br />
al. 2003). For example, observations over four years (1999-2002) showed SLP and SST<br />
anomalies that did not resemble those before or after the shift of ~1976. This suggests<br />
that a new combination of these anomalies is persisting post-1998 that does not fit the<br />
original anomalies that were used to define positive and negative PDO (Bond et al. 2003,<br />
Minobe 2002).<br />
Comparison of percent change difference in threshold exceedance between post- and pre-<br />
76/77 is used to investigate the effect of PDO (KWL-02). Results are shown in Table<br />
3.10 and include data up to end of 2005. Further work might attempt to consider effects<br />
of possible changes to PDO in 1989 and 1998.<br />
Results are consistent with a relationship between positive PDO phase and generally<br />
increased <strong>GVRD</strong> rainfall threshold exceedance, particularly at the 30-minute duration.<br />
This result is fairly coherent across the <strong>GVRD</strong> with the exception of QT10, which has<br />
large decreases in exceedances at longer durations in the positive PDO period (post-<br />
76/77). Note also that the strength of a relationship would be expected to be modest due<br />
to the large number of other factors that influence rainfall (Mote 2003).<br />
Table 3.10 Change in exceedance (TSEC) from pre-76/77 to post-76/77 period over all durations at<br />
individual stations and averages over all periods.<br />
Stations 5 10 15 30 1 2 6 12 24 Mean*<br />
min<br />
min<br />
min<br />
min<br />
BU31 76% 87% 86% 117% 86% 109% 79% 66% 99% 89%<br />
DN25 39% 40% 48% 78% 38% 28% 9% 6% 19% 34%<br />
QT10 -4% 3% 13% 65% 14% 26% -20% -20% -22% 6%<br />
VA01 37% 39% 47% 82% 42% 54% -9% -8% -5% 33%<br />
VA04 26% 23% 25% 35% 4% 14% -6% 2% 32% 17%<br />
VA13 55% 61% 58% 77% 61% 61% 45% 40% 52% 57%<br />
Mean 38% 42% 46% 76% 41% 49% 19% 15% 29%<br />
*This column is the most analogous to KWL-02 Table 6-8.<br />
hr<br />
The comparison above does not indicate whether or not the differences between the two<br />
cases are statistically significant. To do so, a t-test was conducted. Table 3.11 shows<br />
higher averages and standard deviations in the post-76/77 data for almost all cases<br />
(italicized in Table 3.11 below). This result supports the visual analysis in terms of a shift<br />
that occurred in the records and greater variance post-76/77. In Table 3.11, bold indicates<br />
that post-76/77 data are statistically significant from pre-76/77. All stations have at least<br />
one period that is significantly different from the pre-76/77 population.<br />
hr<br />
hr<br />
hr<br />
hr<br />
26
<strong>GVRD</strong> Historical and Future <strong>Rainfall</strong> Analysis <strong>Update</strong>: Final Report – PCIC – 1 August 2007<br />
Table 3.11 Average exceedance (TSEC) from pre-76/77 and post-76/77. Standard deviations are<br />
shown in brackets, italicized post-76/77 values are greater than their corresponding pre-76/77 values.<br />
Bold values indicate post-76/77 populations are significantly different from the pre-76/77 population.<br />
Results are shown for 5 time periods only.<br />
Stations Period and n 5 15 1 6 24<br />
Analysis<br />
min min hr hr hr<br />
BU31 Pre-76 276 1.34 0.59 0.63 0.60 0.16<br />
(1.85) (1.07) (1.15) (1.04) (0.47)<br />
Post-76 177 2.98 1.49 1.59 1.37 0.46<br />
(3.68) (1.90) (1.99) (1.94) (0.99)<br />
DN25 Pre-76 156 2.26 0.99 1.27 1.38 0.40<br />
(2.64) (1.42) (1.84) (1.77) (0.72)<br />
Post-76 324 3.35 1.62 1.87 1.51 0.49<br />
(4.41) (2.42) (2.37) (1.82) 0.89)<br />
QT10 Pre-76 216 2.85 0.95 0.97 1.13 0.30<br />
(3.41) (1.43) (1.55) (1.71) (0.71)<br />
Post-76 348 2.74 1.09 1.11 0.92 0.24<br />
(3.51) (1.63) (1.78) (1.44) (0.62)<br />
VA01 Pre-76 216 1.18 0.51 0.58 0.69 0.20<br />
(1.61) (0.88) (1.01) (1.14) (0.49)<br />
Post-76 216 1.71 0.82 0.88 0.75 0.19<br />
(2.23) (1.28) (1.43) (1.34) (0.55)<br />
VA04 Pre-76 180 1.51 0.78 0.95 0.87 0.23<br />
(1.90) (1.27) (1.40) (1.33) (0.55)<br />
Post-76 204 1.97 1.00 0.99 0.82 0.32<br />
(2.56) (1.48) (1.52) (1.33) (0.92)<br />
VA13 Pre-76 288 1.42 0.68 0.69 0.71 0.19<br />
(2.11) (1.23) (1.36) (1.17) (0.53)<br />
Post-76 216 2.50 1.23 1.30 1.12 0.32<br />
(3.34) (1.71) (2.06) (1.50) (0.74)<br />
The analysis above suggests that the pre-76/77 and post-76/77 records are different from<br />
each other at most durations. Furthermore, at shorter durations in particular, positive<br />
PDO is associated with increased exceedance and increased variability (as above; Table<br />
3.10). In addition to comparing the means of two periods, it is instructive to consider the<br />
trend before and after the PDO shift.<br />
Trend analysis was completed for 5-minute duration threshold exceedances (see Figure<br />
3.3) and shows that trends were negative during pre-76/77 and positive at all stations but<br />
QT10 afterwards. Together, the results in this section suggest that a return to a negative<br />
PDO phase could reduce exceedances whereas the presence of a recent underlying trend<br />
towards increasing exceedances could also exist.<br />
27
<strong>GVRD</strong> Historical and Future <strong>Rainfall</strong> Analysis <strong>Update</strong>: Final Report – PCIC – 1 August 2007<br />
-1.500<br />
Post-1976/77<br />
-0.692<br />
Pre-1976/77<br />
-1.125<br />
-0.333<br />
-0.333<br />
-0.111<br />
0.077<br />
0.200<br />
0.107<br />
0.400<br />
0.575<br />
1.600<br />
-2.0 -1.5 -1.0 -0.5 0.0 0.5 1.0 1.5 2.0<br />
BU31 DN25 QT10 VA01 VA04 VA13<br />
Figure 3.3 ATEC trends (occurrences per year) for the 5-minute duration, pre-76/77 and post-76/77.<br />
A recently developed robust statistical methodology to determine effects of ENSO and<br />
PDO on temperature, precipitation, and streamflow (Fleming et al. 2007) indicates two<br />
results of importance to the analysis in section 3.3. First, the effects of ENSO and PDO<br />
on precipitation for the Georgia Basin are broadly consistent with those presented here.<br />
Secondly, however, effects of ENSO and PDO are not statistically significant from each<br />
other. In other words, the variability is larger than the signal: all El Niño years are on<br />
average drier than non-El Niño years but the variability is so large that many individual<br />
El Niño years deviate from this average.<br />
3.4 Comparison of Results to Historical Total Precipitation<br />
Despite limitations of short record lengths, rainfall intensity (section 3.1) and threshold<br />
exceedance (section 3.2) have generally been increasing in the <strong>GVRD</strong>: at some locations<br />
more than others, more for the shorter durations, and mostly in spring and winter.<br />
However, this analysis does not determine the degree to which these changes are due to<br />
underlying increases in annual precipitation itself or to systematic changes in how rainfall<br />
in the <strong>GVRD</strong> has been occurring (rainfall type and systematic changes to type of weather<br />
systems). It is thus important to compare results to trends in annual and seasonal<br />
precipitation, and to consider how changes to typical weather systems, i.e. synoptic<br />
climatology, may be related to these changes.<br />
3.4.1 Historical Trends and Cycles in Total Precipitation<br />
In addition to precipitation intensity and threshold exceedance, other aspects of<br />
precipitation have been studied because they are important to stormwater management<br />
28
<strong>GVRD</strong> Historical and Future <strong>Rainfall</strong> Analysis <strong>Update</strong>: Final Report – PCIC – 1 August 2007<br />
and may affect other hydrologic variables such as soil moisture which can affect soil<br />
erosion (Palecki et al. 2005). Most studies indicate increases in total precipitation for<br />
Pacific North America, with magnitude depending on the period of record, type of data<br />
(annual or seasonal), and location (Zhang et al. 2000, Karl and Knight 1998, Groisman et<br />
al. 1994, Kunkel et al. 1999, Kharin and Zwiers 2000).<br />
Recent research into spatial precipitation trends by Mote (2003) using adjusted datasets<br />
found a precipitation increase greater than 60% per century (1930-1995) for south central<br />
BC. Seasonally, precipitation trends in spring and early summer (April – July) increased<br />
the most (Mote 2003). South of 55°N, precipitation increased during the period of record<br />
(1910-2001), and there was a double-digit increase in the frequency of heavy and very<br />
heavy precipitation over this time period (Groisman et al. 2005).<br />
Thus, future projections of total precipitation trends may also be indicative of future<br />
rainfall intensity and frequency of threshold exceedance, since trends in total<br />
precipitation trends are increasing during similar times of the year as trends in rainfall<br />
intensity and frequency of threshold exceedances. Total precipitation also exhibits similar<br />
patterns in response to the PDO and ENSO as intensity and exceedances (Gan et al.<br />
2007). However, a trend toward decreasing storm total precipitation and storm duration<br />
in most seasons was found in the Western United States while storm intensity increased<br />
(Palecki et al. 2005).<br />
3.4.2 Synoptic Types and Total Precipitation<br />
Synoptic typing may be used to provide additional context for the underlying rainfall<br />
variability occurring in the <strong>GVRD</strong>. Stahl et al. (2006) analysed a set of thirteen synoptic<br />
patterns that describe the most common weather systems affecting BC. If this set is<br />
constant in time, as suggested by the very small change in frequency of occurrence<br />
between the 1961-1989 and 1948-2003 time periods (McKendry et al. 2006), then it may<br />
be worthwhile to investigate whether the trends in occurrence of synoptic types are<br />
consistent with changes in rainfall intensity and frequency.<br />
For example, synoptic types (see Stahl et al. 2006) 7, 10, 12 and 13 occur more<br />
commonly during positive PDO phase while types 2 and 3 occur less commonly. The<br />
wettest synoptic types at YVR are (in order) 10, 3, 12, 4, 9, 6, and 13 (Stahl et al. 2006),<br />
although some of the patterns themselves are associated with wetter or drier conditions<br />
depending on the phase of ENSO and PDO in which they occur.<br />
Thus, synoptic types 10 and 12 occur more often during positive PDO and are among the<br />
wettest types, but they do not occur in spring and summer. The modest increase in<br />
rainfall intensity (October through January) and exceedance trends found here could be<br />
attributable, in part, to an increase in the occurrence of these types. These changes in<br />
synoptic types are consistent with a tendency towards increased frontal systems (in<br />
winter) during the positive phase of the PDO and due to global warming.<br />
Note that the preceding discussion assumes that intensity and exceedance are related to<br />
overall precipitation amount. Further analysis of the relationship between rainfall and<br />
29
<strong>GVRD</strong> Historical and Future <strong>Rainfall</strong> Analysis <strong>Update</strong>: Final Report – PCIC – 1 August 2007<br />
synoptic type would be most valuable if frequency of synoptic types were compared with<br />
rainfall intensity and threshold exceedance results directly, rather than total precipitation.<br />
3.4.3 Future Projections of Total Precipitation<br />
Although trends towards increased occurrence of intense rainfall could be part of a body<br />
of evidence indicating a discernable human effect on the climate (Easterling et al. 2000),<br />
the analysis presented here is not directly applicable to climate change detection and<br />
attribution. However, 50%-85% of the 1925-1999 global (from 40°N to 70°N) pattern of<br />
precipitation trend has been attributed to the human influence on climate (Zhang et al.<br />
2007).<br />
A continued increase in annual precipitation at mid-latitudes is projected by Global<br />
Climate Models, or GCMs (Christensen et al. 2007, Trenberth 1999). Climate projections<br />
specifically for the <strong>GVRD</strong> were also compiled for this update. These projections are<br />
based on results from several GCMs following different global greenhouse gas emissions<br />
scenarios (IPCC Special Report on Emissions Scenarios, Table 3.12). The analysis was<br />
conducted for a regional average of several grid boxes centered on the <strong>GVRD</strong>. Figure 3.4<br />
shows results from the Canadian Global Climate Model, where the <strong>GVRD</strong> region used<br />
includes three grid boxes.<br />
Projections are also presented as “box and whisker plots” (Figure 3.5) that show the<br />
median value within the box, the upper 75 th and the lower 25 th percentile of the<br />
projections as the upper and lower boundaries of the box - thus the box represents the<br />
middle 50% of the range of projections. The full range of projections, or 1.5 standard<br />
deviations, whichever is less, are shown as the upper and lower ‘whisker’ marks at the<br />
end of the lines above and below the box. Each plot shows the projected difference over<br />
the 21 st century from the historical baseline.<br />
Table 3.12 Climate model and emissions scenarios used for boxplots<br />
Model Abbreviation Emissions scenarios<br />
(number of experiments)<br />
Canadian Global Climate Model version 2 cgcm2<br />
A2 (3), B2 (3)<br />
Geophysical Fluid Dynamics Laboratory R30 gfdlr30 A2 (1), B2 (1)<br />
European Centre/Hamburg Model 4 echam4 A2 (1), B2 (1)<br />
Commonwealth Scientific Industrial Research csiromk2b<br />
Organization Mk2b<br />
A1 (1), A2 (1), B1 (1), B2 (1)<br />
Center for Climate Research - National Institute for ccsrnies A1FI (1), A1T (1), A1 (1), B1 (1),<br />
Environmental Studies (Japan)<br />
A2 (1), B2 (1)<br />
Hadley Centre Coupled Model version 3 hadcm3 A2 (3), B2 (2), B1 (1), A1FI (1)<br />
National Center for Atmospheric Research Parallel ncarpcm<br />
Climate Model<br />
A2 (1), B2 (1)<br />
30
<strong>GVRD</strong> Historical and Future <strong>Rainfall</strong> Analysis <strong>Update</strong>: Final Report – PCIC – 1 August 2007<br />
Figure 3.4 <strong>GVRD</strong> region (see black and red squares) and grid boxes selected from the Canadian<br />
Global Climate Model.<br />
Figure 3.5 Box and whisker plot for the annual future precipitation projections for 2020s, 2050s and<br />
2080s. See text for full explanation.<br />
Individual model results, regional statistics, plots and additional seasonal output are also<br />
available online 7 . In addition, the geographical region under consideration may be<br />
modified.<br />
7 http://www.PacificClimate.org/scenarios/<br />
31
<strong>GVRD</strong> Historical and Future <strong>Rainfall</strong> Analysis <strong>Update</strong>: Final Report – PCIC – 1 August 2007<br />
The median precipitation projection is shown along with the 25 th and 75 th percentiles of<br />
results (Table 3.13). The annual and seasonal median projection results over the 21 st<br />
century are as follows. For the 2020s, the annual, winter, spring and fall periods show a<br />
small increase. Summer precipitation is projected to decrease by 16%. This pattern of<br />
projected decreases in summer and increases in all other seasons continues through the<br />
2050s and 2080s. Winter precipitation is anticipated to rise 6% by the 2020s, 9% by the<br />
2050s and 12% by the 2080s.<br />
This median projection would be broadly consistent with a continuation of precipitation<br />
increases that have been occurring in historical precipitation for Canada and North<br />
America (section 3.4.1). However, there is a great amount of variation in regional<br />
averages and in the probability of increasing extreme values in precipitation studies<br />
(Trenberth et al. 2005, Whilby et al. 2002).<br />
Finally, the projections for the 2020s, 2050s, and 2080s shown in Figure 3.5 and Table<br />
3.13 are each averaged over 30-year periods and expressed as the difference from the<br />
1961-1990 baseline. Therefore, decadal variability is suppressed in these estimates.<br />
However, future precipitation in BC will continue to be strongly influenced by PDO<br />
cycles and ENSO events (section 3.3), with effects superimposed on the projections<br />
below. A switch to the negative phase of the PDO is possible and would tend to moderate<br />
patterns of increased rainfall intensity and threshold exceedance. It is possible that a<br />
continuation of PDO conditions of the past five years, the initiation of negative PDO, or<br />
even a return to positive PDO, could occur<br />
Table 3.13 Precipitation projections (% anomaly from historical climatology) for 2020s, 2050s and<br />
2080s for 25 th percentile, median, and 75 th percentile of emissions scenarios.<br />
Projection Time Period 25th Percentile Median 75 th Percentile<br />
2020s<br />
Annual -1 1 3<br />
Winter 1 6 9<br />
Spring 0 2 7<br />
Summer -19 -16 -5<br />
Fall -3 0 3<br />
2050s<br />
Annual 1 2 5<br />
Winter 4 9 14<br />
Spring -2 2 8<br />
Summer -33 -25 -14<br />
Fall 0 2 6<br />
2080s<br />
Annual 2 4 7<br />
Winter 8 12 19<br />
Spring -1 5 9<br />
Summer -36 -28 -11<br />
Fall 1 4 9<br />
32
<strong>GVRD</strong> Historical and Future <strong>Rainfall</strong> Analysis <strong>Update</strong>: Final Report – PCIC – 1 August 2007<br />
4 Conclusions<br />
This report provides an update to KWL-02 with additional data (to 2005). The update<br />
focuses mainly on observed trends in rainfall intensity and threshold exceedance,<br />
including a discussion of the influence of climate oscillations (ENSO and PDO). Results<br />
are compared to trends in total precipitation, and future projections of total precipitation<br />
from Global Climate Models are presented. Overall, findings that annual and seasonal<br />
trends in rainfall intensity and threshold exceedance frequency have increased during the<br />
1950-2005 period generally reinforce conclusions from KWL-02. However, the trends do<br />
not occur uniformly across durations, seasons, or spatially. Thus, while an overall pattern<br />
of increasing rainfall is apparent, the short record lengths and gaps in records remain a<br />
considerable technical limitation.<br />
Some of the highlights of the discussion and results (section 3) include:<br />
<strong>Rainfall</strong> intensity:<br />
• Positive, statistically significant weak trends were found on an annual basis at<br />
more than half of the stations<br />
• There does not appear to be a consistent relationship between presence or<br />
magnitude of trends and elevation or spatial distribution<br />
• Most of the statistically significant positive trends occur within the 5min to 2hr<br />
durations<br />
• Relatively strong (>10mm/hr per century) statistically significant increases in<br />
monthly trends are occurring during April, May and June within the shortest<br />
durations (particularly 5 and 15 minutes)<br />
• June has the strongest trend in rainfall intensity, in the 5-minute duration<br />
• May and June have the highest total number of significant (>95%) monthly<br />
rainfall trends from all stations<br />
• March, April, and October through January also have several significant (>95%)<br />
seasonal rainfall trends<br />
Threshold exceedance:<br />
• Some positive trends are found in the annual records at most stations<br />
• Positive seasonal trends are strongest for the spring (Apr-May-June) months<br />
• Positive annual and monthly trends occur mainly in the short durations (up to 2<br />
hours)<br />
Climate Variability:<br />
• Trends in rainfall intensity and threshold exceedance include the combined effects<br />
of natural variability, including influence of ENSO and PDO, as well as climate<br />
change<br />
• Impacts of ENSO and PDO themselves may be affected by climate change<br />
• <strong>Rainfall</strong> exceedance prior to 1976/77 is statistically distinct from the post-76/77<br />
record which suggests an influence of PDO on rainfall exceedance, although the<br />
presence of underlying trends towards increased exceedance complicates this<br />
interpretation<br />
33
<strong>GVRD</strong> Historical and Future <strong>Rainfall</strong> Analysis <strong>Update</strong>: Final Report – PCIC – 1 August 2007<br />
• Although the status of PDO remains uncertain, trends have continued to increase<br />
at several stations, and there is some evidence that the observed shifts in PDO of<br />
the last century may not continue in the same way in future<br />
Climate Change:<br />
• Decreased summer precipitation is projected over the next century<br />
• Increased precipitation is projected in all other seasons, particularly winter over<br />
the next century<br />
• A slight net annual increase in precipitation is projected over the next century<br />
• Patterns of increased rainfall intensity and threshold exceedance are consistent<br />
with a tendency towards increased frontal systems (winter and spring) and<br />
convection (spring) during the positive phase of the Pacific Decadal Oscillation<br />
and due to global warming.<br />
Note that the records used in this study are of various lengths and contain numerous data<br />
gaps, which create difficulties when attempting to interpret results. Stations with different<br />
record lengths, or data gaps cannot be readily compared. Changes in gauge location or<br />
environmental effects, such as the installation of the cooling tower at DN25, also create<br />
difficulty when attempting to resolve or understand long-term changes (Groisman and<br />
Easterling 1993). Thus, the application of methods such as data infilling, or the use of<br />
adjusted climate records may be one means of improving estimates of trends in<br />
precipitation intensity and frequency. These methods and other recommendations for<br />
further analysis are discussed in Appendix A.<br />
34
<strong>GVRD</strong> Historical and Future <strong>Rainfall</strong> Analysis <strong>Update</strong>: Final Report – PCIC – 1 August 2007<br />
Acknowledgements<br />
This update was made possible by financial support from the Greater <strong>Vancouver</strong><br />
Regional District. The Pacific Climate Impacts Consortium has also been supported<br />
during the preparation of this analysis by its two funding partners, BC Ministry of<br />
Environment and BC Hydro.<br />
The authors wish to thank Brent Burton and Mark Wellman for initiating the project and<br />
Paul Whitfield, Rick Lee, Kerr-Wood Liedal, Ed Wiebe, and Dave Rodenhuis for<br />
valuable advice in preparation of the report.<br />
35
<strong>GVRD</strong> Historical and Future <strong>Rainfall</strong> Analysis <strong>Update</strong>: Final Report – PCIC – 1 August 2007<br />
References<br />
Andreadis, K.M., and Lettenmaier, D.P. 2006. Trends in 20th century drought over the continental United<br />
States. Geophysical Research Letters, 33: L10403.<br />
AQUARIUS Time-Series 2006. http://www.aquaticinformatics.com/main/?aquarius<br />
Bond, N.A., Overland, J.E., Spillane, M., and Stabeno, P. 2003. Recent shifts in the state of the North Pacific.<br />
Geophysical Research Letters: 30(23), 2183.<br />
Chen, T.C., Chen, J.-M., and Wikle, C.K. 1996. Interdecadal variation in U.S. Pacific Coast precipitation<br />
over the past four decades. Bulletin of the American Meteorological Society: 77, 1197–1205.<br />
Christensen, J.H. et al., 2007. Regional Climate Projections. In: S. Solomon et al. (Editors), Climate Change<br />
2007: The Physical Science Basis. Contribution of Working Group I to the Fourth Assessment Report of<br />
the Intergovernmental Panel on Climate Change. Cambridge University Press, Cambridge United Kingdom<br />
and New York, NY, USA.<br />
Dai, A., 2001. Global precipitation and thunderstorm frequencies. Part II: Diurnal variations. Journal of<br />
Climate: 14, 1112–1128.<br />
DPM. 2005. Regular Council Meeting Feature Story 2005/February: January 2005 Heavy <strong>Rainfall</strong> Event. The<br />
District Of Pitt Meadows Council ed. Drainage <strong>Update</strong>. January 25, 2005. The District Of Pitt Meadows<br />
Council. Director of Operations and Development Services, http://pittmeadows.bc.ca/site-gen/fs-arch/sfs-<br />
128.htm<br />
Easterling, D.R., Evans, J.R., Groisman, P.Y., Karl, T.R., Kunkel, K.E., and Ambenje, P. 2000a. Observed<br />
variability and trends in extreme climate events: a brief review. Bulletin of the American Meterlogical<br />
Society: 81(3), 417-425.<br />
Easterling, D.R., Meehl, G.A., Parmesan, C., Changnon, S., Karl, T.R., and Mearns, L.O. 2000b. Climate<br />
extremes: observations, modeling and impacts. Science: 289, 2068-2073.<br />
Fleming, S.W. 2006. Average historical impacts of Pacific ocean-atmosphere circulation modes on British<br />
Columbia and Yukon annual temperature and precipitation cycles. Report prepared for the Meteorological<br />
Service of Canada. Aquatic Informatics Inc. <strong>Vancouver</strong>, 65 pp.<br />
Fleming, S.W., Whitfield, P.H., Moore, R.D. and Quilty, E.J., 2007. Regime-dependent streamflow<br />
sensitivities to Pacific climate modes cross the Georgia–Puget transboundary ecoregion. Hydrological<br />
Processes.<br />
Gan, T.Y., Gobena, A.K., and Wang. Q. 2007. Precipitation of southwestern of Canada: Wavelet, scaling,<br />
multifractal analysis, and teleconnection to climate anomalies. Journal of Geophysical Research: 112,<br />
D10110.<br />
Gershonov, A., and Barnett, T.P. 1998. Inter-decadal modulation of ENSO teleconnections. Bulletin of the<br />
American Meterological Society: 79, 2715–2725.<br />
Gilbert, R.O. 1987. Statistical Methods for Environmental Pollution Monitoring. New York, Van Nostrand<br />
Reinhold Company. 320 pp.<br />
Groisman, P.Y. 2002. Homogeneity issues in the global daily climatology network: Precipitation in cold<br />
climate regions. Extended Abstracts, WCRP Workshop on Determination of Solid Precipitation in Cold<br />
Climate Regions, Fairbanks, AK, World Climate Research Programme, CD-ROM.<br />
36
<strong>GVRD</strong> Historical and Future <strong>Rainfall</strong> Analysis <strong>Update</strong>: Final Report – PCIC – 1 August 2007<br />
Groisman, P.Y. and Easterling, D.R. 1993. Variability and trends of total precipitation and snowfall over the<br />
United States and Canada. Journal of Climate: 7, 184-205.<br />
Groisman, P.Y., Knight, R.W., Easterling, D.R., Karl, T.R., Hegrel, G.C., and Razuvaev, V.N. 2005. Trends<br />
in Intense Precipitation in the Climate Record. Journal of Climate: 18, 1326-1350.<br />
Groisman, P.Y. and Legates, D.R. 1994. The accuracy of United States Precipitation Data. Bulletin of the<br />
American Meteorological Society: 75(2).<br />
Groisman, P.Y., Karl, T. R., Easterling, D.R., Knight, R.W., Jamason, P.F., Hennessy, K.J., Suppiah, R.,<br />
Page, C. M., Wibig, J., Fortuniak, K., Razuvaev, V.N., Douglas, A.D., Førland, E. and Zhai , P-M. 1999.<br />
Changes in the probability of heavy precipitation: Important indicators of climatic change. Climatic<br />
Change: 42, 243–283.<br />
Groisman, P.Y. and Rankova, E. Ya. 2001. Precipitation trends over the Russian permafrost-free zone:<br />
Removing the artifacts of preprocessing. International Journal of Climatololgy: 21, 657–678.<br />
Hamlet, A.F. 2003. The role of transboundary agreements in the Columbia River Basin: An integrated<br />
assessment in the context of historical development, climate, and evolving water policy. In Diaz, H. and<br />
Morehouse, B. eds. Climate, Water and Transboundary Challenges in the Americas. Boston: Kluwer Press,<br />
263-289.<br />
Hamlet, A.F., and Lettenmaier, D.P. 1999. Effects of climate change on hydrology and water resources in the<br />
Columbia River Basin. Journal of the American Water Resource Association: 35(6), 1597-1623.<br />
Hegerl, G.C., Karl, T.R., Allen, M., Bindoff, N.L., Gillett, N., Karoly, D., Zhang, X., and Zwiers, F. 2006.<br />
Climate change detection and attribution: beyond mean temperature signals. Journal of Climate: 19, 5058-<br />
5077.<br />
Hirsch, R.M., and Slack, J.R. 1982. Techniques for trend analysis for monthly water quality data. Water<br />
Resources Research: 18, 107-121.<br />
Hirsch, R.M., and Slack, J.R. 1984. A nonparametric trend test for seasonal data with serial dependence.<br />
Water Resources Research: 20, 727-732.<br />
Hosking, J.R.M. 1991. FORTRAN routines for using the method of L-moments. IBM Research Division<br />
Research Report RC17097. 177 pp.<br />
Jakob, M., McKendry,I., and Lee, R. 2003. Long-term changes in rainfall intensity in <strong>Vancouver</strong>, British<br />
Columbia. Canadian Water Resources Journal: 28(4), 587-604.<br />
Karl, T.R., and Knight, R.W. 1998. Secular trends of precipitation amount, frequency and intensity in the<br />
United States. Bulletin of the American Meteorological Society: 79(2), 231-241.<br />
Kharin, V.A., and Zwiers, F.W. 2000. Changes in the Extremes in an Ensemble of Transient Climate<br />
Simulations with a Coupled Atmosphere–Ocean GCM. Journal of Climate: 13, 3760-3788.<br />
Kiffney, P.M., Bull, J.P., and Feller, M.C. 2002. Climatic and hydrologic variability in a coastal watershed of<br />
southwestern British Columbia. Journal of the American Water Resource Association: 38(5), 1437-1451.<br />
Kunkel, K.E., Andsager, K., and Easterling, D.R. 1999. Long-term trends in extreme precipitation events<br />
over conterminous United States and Canada. Journal of Climate: 12, 2515-2527.<br />
KWL. 2002. Development of <strong>GVRD</strong> Precipitation Scenarios. <strong>Vancouver</strong>: Greater <strong>Vancouver</strong> Regional<br />
District. http://www.gvrd.bc.ca/air/pdfs/ClimateChangePrecipitationAnalysis2002.pdf<br />
37
<strong>GVRD</strong> Historical and Future <strong>Rainfall</strong> Analysis <strong>Update</strong>: Final Report – PCIC – 1 August 2007<br />
KWL. 2006. Development of <strong>GVRD</strong> Precipitaiton Scenarios: Threshold Exceedance Counts. Memo to<br />
Greater <strong>Vancouver</strong> Regional District.<br />
Libiseller, C. 2002. MULTMK/PartMK – A Program for the Computation of Multivariate and Partial Mann-<br />
Kendall Test. http://www.mai.liu.se/%7Ecllib/welcome/PMKtest.html<br />
Loukas, A., and Quick, M. 1995. A 24-hour design storm for coastal British Columbia. Journal of Hydraulic<br />
Engineering: 121(12), 889-899.<br />
McKendry, I.G., Stahl, K. and Moore, R.D. 2006. Short communication: synoptic sea-level pressure patterns<br />
generated by a general circulation model: comparison with types derived from NCEP/NCAR reanalysis and<br />
implications for downscaling. International Journal of Climatology: 26, 1727-1736.<br />
Mann, H.B. 1945. Nonparametric Tests against Trend. Econometrica: 13, 245-259.<br />
Mantua, N.J., and Hare, S.R. 2000. Empirical evidence for North Pacific regime shifts in 1977 and 1989.<br />
Progress in Oceanography: 47, 103–145.<br />
Mantua, N.J., Hare, S.R., Zhang, Y., Wallace, J.M., and Francis, R.C. 1997. A Pacific interdecadal climate<br />
oscillation with impacts on salmon production. Bulletin of the American Meteorological Society: 78, 1069–<br />
1079.<br />
Mearns, L.O., Katz, R.W., and Schneider, S.H. 1984. Extreme High-Temperature Events: Changes in their<br />
Probabilities with Changes in Mean Temperature. Journal of Climate and Applied Meteorology: 23, 1601-<br />
1613.<br />
Meehl, G.A., Karl, T.R., Easterling, D.R., Changnon, S., Pielke, R.J., Changnon, D., Evans, J.R., Groisman,<br />
P.Y., Knutson, T.R., Kunkel, K.E., Mearns, L.O., Parmesan, C., Pulwarty, R., Root, T., Sylves, R.T.,<br />
Whetton, P., and Zwiers, F. 2000. An introductions to trends in extreme weather and climate events:<br />
observations, socioeconomic impacts, terrestrial ecological impacts, and model projections. Bulletin of the<br />
American Meterlogical Society: 81(3), 414-416.<br />
Mekis, E., and Hogg, W.D. 1999. Rehabilitation and analysis of Canadian daily precipitation time series.<br />
Atmos.-Ocean: 37, 53-85.<br />
Mote, P.W. 2003. Trends in temperature and precipitation in the Pacific Northwest during the twentieth<br />
century. Northwest Science: 77(4), 271-282.<br />
National Resource Canada. 2005. Landslides - North <strong>Vancouver</strong> Landslide.<br />
http://gsc.nrcan.gc.ca/landslides/clp/nvancouver_e.php<br />
NOAA. 2005. Hazards/Climate Extremes Special Focus, Global Hazards and Significant Events: January<br />
2005, Flooding. http://www.ncdc.noaa.gov/oa/climate/research/2005/jan/hazards.html<br />
Palecki, M.A., Angel, J.R., and Hollinger, S.E. 2005. Storm Precipitation in the United States. Part I:<br />
Meteorological Characteristics. Journal of Applied Meteorology: 44(6), 933-946.<br />
Peterson, W.T., and Schwing, F.B. 2003. A new climate regimes in northeast pacific ecosystems.<br />
Geophysical Research Letters: 30(17), 1986.<br />
Rodionov, S.N., 2004: A sequential algorithm for testing climate regime shifts. Geophysical Research<br />
Letters: 31, doi:10.1029/2004GL019448.<br />
Sandweiss, D.H., Richardson, J.B.I., Reitz, E.J., Rollins, H.B., and Maasch, K.A. 1996. Geoarchaeological<br />
Evidence from Peru for a 5000 Years B.P. Onset of El Niño. Science: 273(5281), 1531 - 1533.<br />
38
<strong>GVRD</strong> Historical and Future <strong>Rainfall</strong> Analysis <strong>Update</strong>: Final Report – PCIC – 1 August 2007<br />
Snover, A.K., Hamlet, A.F., and Lettenmaier, D.P. 2003. Climate Change Scenarios for Water Planning<br />
Studies. Bulletin of the American Meteorological Society: 84, 1513-1518.<br />
Stahl, K., Moore, R.D. and McKendry, I.G., 2006. The Role of Synoptic-Scale Circulation in the Linkage<br />
Between Large-Scale Ocean-Atmosphere Indices and Winter Surface Climate in British Columbia, Canada.<br />
International Journal of Climatology, 26(4): 541-560.<br />
Timmermann, A. 1999. Detecting the Nonstationary Response of ENSO to Greenhouse Warming. Journal of<br />
Atmospheric Sciences: 56(14), 2313-2325.<br />
Trenberth, K.E. 1999. Conceptual framework for changes of extremes of the hydrological cycle with climate<br />
change. Climate Change: 42, 327-339.<br />
Trenberth, K.E., Dai, A., Rasmussen, R.M., and Parsons, D.B. 2005. The changing character of precipitation.<br />
Bulletin of the American Meterlogical Society: September, 1205-1217.<br />
Trenberth, K.E., and Hurrell, J.W. 1994. Decadal atmosphere-ocean variations in the Pacific. Climate<br />
Dynamics: 9(6).<br />
Wang, J.Y., Whitfield, P.H., and Cannon, A.J. 2006. Influence of Pacific Climate Patterns on Low-Flows in<br />
British Columbia and Yukon, Canada. Canadian Water Resources Journal: 31(1), 1-16.<br />
Whilby, R.L., and Wigley, T.M.L. 2002. Future changes in the distribution of daily precipitation totals across<br />
North America. Geophysical Research Letters: 29(7), 1135.<br />
Whyte, J. 2006. Extreme Weather, Impacts on PEP and Public Safety. CWRA Conference Feb. 10, 2006.<br />
Victoria, BC.<br />
Wikinews. 2005. Pacific Northwest Soaked with "Tropical Punch".<br />
http://en.wikinews.org/wiki/2005/01/19_Pacific_Northwest_soaked_with_%22Tropical_Punch%22<br />
Zhang, X., Vincent, L.A., Hogg, W.D., and Niitsoo, A. 2000. Temperature and Precipitation Trends in<br />
Canada during the 20th Century. Atmosphere-Ocean: 38(3), 395–429.<br />
Zhang, X., Zwiers, F.W., Hegerl, G.C., Lambert, F.H., Gillett, N.P., Solomon, S., Stott, P.A, and Nozawa, T.<br />
2007. Detection of human influence on twentieth-century precipitation trends. Nature: 06025,<br />
DOI:10.1038, 1-5.<br />
39
<strong>GVRD</strong> Historical and Future <strong>Rainfall</strong> Analysis <strong>Update</strong>: Final Report – PCIC – 1 August 2007<br />
Appendix A: Recommendations for further analysis<br />
40
<strong>GVRD</strong> Historical and Future <strong>Rainfall</strong> Analysis <strong>Update</strong>: Final Report – PCIC – 1 August 2007<br />
Data quality and local station limitations<br />
1. Missing values:<br />
Several stations have multiple years of missing data. This presents a challenge when<br />
comparing the results from stations within the network to each other and when attempting<br />
to look for regional trends. Regional averaging (below) would reduce the impact of<br />
missing values and stations could be compared to each other using only common years.<br />
Data gaps could also be in-filled. For example, AQUARIUS Time-Series software can<br />
use data from nearby MSC stations to in-fill missing records. Probability density<br />
functions (PDFs) can be applied to define relationships between the 24-hour period and<br />
shorter duration records and then these relationships can be used to in-fill shorter<br />
durations.<br />
2. Use of recently digitized data:<br />
Continuing to decrease the length of missing periods of data by digitizing records is far<br />
preferred to filling missing values. New updates should continue to take advantage of<br />
additional observations that occur as well as additional historical data as it becomes<br />
digitized (such as daily rainfall at the three MSC stations for 2001-2005 which was not<br />
used during preparation of the report but is now available).<br />
3. Data evaluation:<br />
The <strong>GVRD</strong> could undertake a review of the gauges used to collect data in order to<br />
evaluate their relative strengths and weaknesses in terms of inclusion in the study, or<br />
expansion of the network used (see 4 below). For example, are the gauges heated tipping<br />
buckets and if so, what is their accuracy? If they are not winterized it is possible that<br />
there is gauge under-catch during winter which would affect some of the storm<br />
precipitation characteristics (Groisman and Legates 1994).<br />
Preprocessing may also be an important consideration for future analysis of <strong>GVRD</strong><br />
rainfall. Groisman et al. (2005) discusses preprocessing of daily precipitation data for<br />
Canada to restore the homogeneity of the time series before trends in intensity were<br />
tested. Groisman et al. (2005) suggests that preprocessing is necessary because the<br />
original data was affected by changes in observational practices and instruments.<br />
Additionally, alternate research has outlined techniques for removing the artifacts of<br />
preprocessing (Groisman and Rankova 2001; Groisman et al. 1999; Groisman 2002).<br />
The Adjusted Historical Canadian Climate Data (AHCCD) provides rehabilitated<br />
precipitation and homogenized temperature data sets for Canada, which can be used for<br />
climate research. These data incorporate a number of statistical adjustments to the<br />
original station data. The AHCCD station data could be utilized by generating a double<br />
mass curve of a <strong>GVRD</strong> station to a nearby AHCCD station to reveal inconsistencies in<br />
measuring techniques at the <strong>GVRD</strong> stations. Adjusting the data would give greater<br />
confidence in the trends and would also make the results more directly comparable to<br />
those from other studies.<br />
41
<strong>GVRD</strong> Historical and Future <strong>Rainfall</strong> Analysis <strong>Update</strong>: Final Report – PCIC – 1 August 2007<br />
4. Spatial analysis:<br />
Station (point) examination of precipitation events, such as undertaken in this report, can<br />
generate an understanding of rainfall at that specific location. Owing to the highly<br />
variable nature of rainfall (Dai 2001), point analysis can sometimes be misleading or less<br />
valuable than spatially broad analyses.<br />
Mote (2003) examined regional averages that include the <strong>GVRD</strong>. Inclusion of stations<br />
from outside of the region will improve the relative strength of climate variability and<br />
trends as compared to local effects. The importance of examining rainfall patterns over an<br />
appropriately area allows for consideration of a large number of stations while smoothing<br />
out effects of localized topography and other non-climatic factors in favour of a more<br />
regionally coherent climate record (Mote 2003).<br />
In addition to simply regionally averaging the results, gridded data could be used.<br />
Blending station and gridded data as well as interpolating point observations onto a grid<br />
is becoming increasingly important for comparing observational data with climate model<br />
simulations (Hegerl et al. 2006). Finally, a comparison of trend results at individual<br />
stations to regional synoptic types (Stahl et al. 2006) should be conducted in order to<br />
make a connection between trends and underlying changes in meteorological conditions.<br />
5. Length of record:<br />
Analysis over a larger region will allow not only a higher number of stations in the later<br />
part of the record, but also extension of analysis into earlier parts of the record. The<br />
inclusion of the earlier part of the 20 th century would allow for better estimation of<br />
variability as additional cycles of ENSO and PDO could then be analysed. Additionally,<br />
trend analysis would be improved as longer records may provide more statistically robust<br />
estimates. One possibility for extending the period of analysis includes using data from<br />
GVWD watersheds, which can extend back as far as 1914. Investigation of the effect of<br />
start date on trends also allows for a better understanding of regional climate variability.<br />
Methods: broadening analysis beyond rainfall intensity and exceedance<br />
6. Additional parameters:<br />
Consideration of rainfall trends in the <strong>GVRD</strong> in isolation of temperature and snowfall<br />
leaves a major gap for interpretation of results. If increases in rainfall are occurring in<br />
winter and spring, it is not clear how much is due to an overall increase in precipitation,<br />
and how much is due to increase in temperature.<br />
7. Hydrological and regional climate modeling:<br />
Distributed hydrological models, Energy-Moisture balance hydrological models such as<br />
the Variable Infiltration Capacity Model used at the University of Washington, and<br />
Regional Climate Models such as the CRCM operated by Ouranos may be used to<br />
diagnose results at high spatial and temporal resolution, with the added advantage that<br />
other relevant aspects of the hydrological cycle (such as streamflow) may also be<br />
42
<strong>GVRD</strong> Historical and Future <strong>Rainfall</strong> Analysis <strong>Update</strong>: Final Report – PCIC – 1 August 2007<br />
available. In the absence of regional modeling, the GCM projections should be updated<br />
using AR4 projections.<br />
8. Literature review:<br />
To date, much of the analysis has been performed in order to make the most of the data<br />
available while keeping analysis simple enough to interpret results. In the time since<br />
KWL-02, several other studies have used alternate statistical methods, which may yield<br />
richer results for investigation of trends as well as variability.<br />
9. Seasonal climate predictions:<br />
KWL-02 suggested that low skill for seasonal climate predictions of rainfall intensity and<br />
exceedance based on multiple linear regression analysis. However, experimental<br />
predictions of streamflow, such as those produced at the University of Washington 8 , may<br />
yield a useful level of skill.<br />
10. Event-based enquiry:<br />
Cumulative effects of storm segments are important as they work in combination on the<br />
natural and human environments to create runoff, soil erosion, and flooding. Palecki et al.<br />
(2005) analysed annual and seasonal trends in mean storm characteristics such as total<br />
storm precipitation, storm duration, storm intensity, and 15-minute maximum intensity<br />
using a linear regression and a Student’s t-test of the slope to determine the significance<br />
of the trend in the United States. All of these components contribute to the impact of a<br />
given storm.<br />
An accurate evaluation of the threat of changes in precipitation should reflect not only<br />
these but also antecedent moisture conditions and snow pack leading up to the event.<br />
Defining storm characteristics leading to events such as seasonal water availability from<br />
the source regions, atmospheric water vapor capacity, and the storm precipitation<br />
mechanism helps to predict high impact events (Palecki et al. 2005). The seasonality,<br />
frequency, severity and geographic extent of an event or events of similar magnitudes can<br />
be considered (i.e. aggregate all events to form a sample over a given threshold, apply<br />
cluster analysis and use extreme probability statistics). Examining trends and their<br />
relationship to climate change may help the <strong>GVRD</strong> to plan and mitigate for such<br />
occurrences.<br />
11. Probability density functions (PDFs):<br />
PDFs are used for hydrologic and erosion modeling and are formed by fitting analytical<br />
curves to empirical storm characteristic probabilities (Palecki et al. 2005). L-moments<br />
software can be used by the <strong>GVRD</strong> to examine the 100-yr return interval estimates for<br />
each variable and season to examine extremes for each station by fitting the twoparameter<br />
Gumbel distribution to the annual extreme series using (Hosking 1991).<br />
12. Seasonal trends:<br />
The Mann-Kendall (MK) test is one of the most widely applied statistical tests for trends<br />
in climate time series (Mann 1945). A modified version of the MK test was proposed by<br />
8 http://www.cses.washington.edu/cig/res/hwr/muniwaterfc.shtml<br />
43
<strong>GVRD</strong> Historical and Future <strong>Rainfall</strong> Analysis <strong>Update</strong>: Final Report – PCIC – 1 August 2007<br />
Hirsch et al. (1982). This version is more appropriate for seasonal data, and is referred to<br />
as the Seasonal MK test. In this version trends in seasons with small values are not<br />
dominated by larger values in other seasons (Lettenmaier et al. 1994) and serial<br />
dependence, such as correlation between months, is accounted for by inflating the<br />
variance of the test statistic (Hirsch and Slack 1984). A version of Mann-Kendall that<br />
includes seasonal Mann-Kendall tests is available for download online 9 . This could be<br />
applied by the <strong>GVRD</strong> to test for seasonal trends in rainfall intensity.<br />
13. Choice of seasons:<br />
The more common breakdown into seasons of DJF, MAM, JJA, SON rather than JFM,<br />
AMJ, JAS, OND for winter, spring, summer and spring respectively (where DJF equals<br />
December-January-February and so on) would facilitate comparison to other studies. In<br />
addition, for computations of wet seasons, months from consecutive water years would<br />
yield more robust results than JFMOND by calendar year.<br />
14. Selection of thresholds:<br />
Instead of defining rainfall exceedance thresholds based on millimeters of rain, event<br />
frequency thresholds could be based on percentiles. This would make trends comparable<br />
to other studies and would allow for relevant comparison of trends from one station to<br />
another.<br />
Groisman et al. (2005) defined a daily precipitation event as heavy when it fell into the<br />
upper 10% and/or 5% of all precipitation events; as very heavy when it fell into the upper<br />
1% and/or 0.3% of precipitation events; and extreme when it falls into the upper 0.1% of<br />
all precipitation events. These percentiles can be equated to return periods (at each station<br />
individually). The 0.3% return period corresponds roughly to one daily event in 3 to 5<br />
years for annual precipitation and approximately 10 to 20 years for seasonal precipitation,<br />
depending on the probability of daily rain events for a given location.<br />
15. Further analysis of climate variability:<br />
The preliminary comparison of rainfall during pre- and post-76/77 PDO phase shift may<br />
be expanded upon by considering longer-term records at a smaller number of stations,<br />
and by considering a possible phase shift in 1989 or 1998. In addition to PDO, the user of<br />
longer-term records would allow for investigation of effect of state of ENSO or other<br />
teleconnection patterns as well as in Gan et al. (2007).<br />
9 http://www.mai.liu.se/~cllib/welcome/PMKtest.html<br />
44
<strong>GVRD</strong> Historical and Future <strong>Rainfall</strong> Analysis <strong>Update</strong>: Final Report – PCIC – 1 August 2007<br />
Appendix B: <strong>Rainfall</strong> catalogue, station records and notes<br />
45
AppendixB_TableB1-Final 7/27/2007<br />
STN ID Start date End Date 1949 50 51 52 53 54 55 56 57 58 59 60 61 62 63 64 65 66 67 68 69 70 71 72 73 74 75 76 77 78 79 80 81 82 83 84 85 86 87 88 89 90 91 92 93 94 95 96 97 98 99 2000 01 02 03 04 05<br />
VA 1 Mar-57 Present D< D< D< D< D< D< D< D< D< D< D< N N N N<br />
VA 4 May-58 Present D< D< D< D< D< D< D< D< D< D< D< D< D< D< D< D< D< D< D< N N N N<br />
CW 9 1947* Present P< P< P< P< P< P< P< P< P< P< P< P< P< P< P< P< P< P< D< D< D< D< D< D< D< N N N N<br />
QT 10 Jan-59 Present D< N N N N<br />
VA 13 Jul-49 Present D< D< D< D< D< D< D< D< D< D< D< D< D< D< D< D< D< D< D< D< N N N N<br />
VW 14 1959 Present D< D< D< D< D< D< D< D< D< D< D< D< D< D< D< D< D< D< D< D< D< D< D< D< D< D< D< D< D< D< D< D< D< D< N N N N<br />
DN 15 Mar-64 Present P< P< P< P< P< P< P< P< P< D< P< P< P< P< P< P< D< D< D< D< D< D< D< D< D< D< D< D< D< D< D< D< N N N N<br />
DN 25 Jul-64 Present D< D< D< D< D< N N N* N*<br />
BU 31 Sep-50 Present D< D< D< D< D< D< D< D< D< D< D< D< D< D< D< D< D< D< D< D< N< N N N<br />
Legend<br />
Data continuous and complete in record N< New but some months missing<br />
D< Daily totals and Peak Intensities but only partial for year (some months missing) N* Rain gauge relocated<br />
P< Peak Intensities but only partial for year (some months missing)<br />
N New Data updated in this assessment, all stations stopped recorded 10min durations in August 2005<br />
Where years start previous to 1950, this data is not used for analysis No data available<br />
Table B1: Summary of <strong>GVRD</strong> stations, available data and updated data (2001 - 2005)
<strong>GVRD</strong> Historical and Future <strong>Rainfall</strong> Analysis <strong>Update</strong>: Final Report – PCIC – 1 August 2007<br />
Table B2: <strong>Rainfall</strong> intensity and frequency: stations, record availability, durations and notes<br />
regarding any missing data or information<br />
<strong>GVRD</strong> Stations<br />
Stations Record Availability <strong>Rainfall</strong><br />
BU31:<br />
Confederation<br />
Park<br />
CW09<br />
Westburnco<br />
Reservoir<br />
DN25:<br />
Dist. N. Van.<br />
Municipal<br />
Hall<br />
Intensities<br />
1950-1973 † NA: Jan-50 to<br />
Aug-50, Oct-<br />
64<br />
1988-1997 † NA: Apr-90,<br />
Jun-99 to<br />
Dec-99<br />
2002 – 2005* Complete*;<br />
NA: Jan-02 to<br />
Apr-02<br />
1959-1976 † * NA: Daily<br />
totals, 10<br />
minute<br />
durations and<br />
sporadic<br />
months;<br />
totals,<br />
5, 15, 30, 1hr,<br />
2hr, 6hr, 12hr<br />
and 24 hrs<br />
updated<br />
1980 - 2001 † NA: Jul-85,<br />
Feb-89, Sep-<br />
89, Jan-90 to<br />
Mar-90, Jul-<br />
95<br />
2002 - 2005* Total, 5, 10,<br />
15, 30<br />
minute, 1, 2,<br />
6, 12 and 24<br />
hours updated<br />
1964 - 2001 † NA: Jan-64 to<br />
Jun-64, Jul-90<br />
to Jun-91,<br />
Apr-92, Oct-<br />
93 to Dec-93<br />
<strong>Rainfall</strong> Threshold Notes<br />
Exceedance<br />
NA: 1950 Oct-64 cont. 0’s for<br />
exceedance<br />
NA: 1999 Apr-90 cont. 0’s for<br />
exceedance<br />
NA: Jan-02 to Apr-02 In August 2005,<br />
collection of 10minute<br />
rainfall<br />
intensity ceased.<br />
No exceedance available<br />
Complete* ul-85, Feb-89, Sep-<br />
89, Jan-90 to Mar-<br />
90, Jul-95 cont. 0’s<br />
for exceedance<br />
Complete* In August 2005,<br />
collection of 10minute<br />
rainfall<br />
intensity ceased.<br />
NA: 1990, 1991 Jan-64 to Jun-64 is<br />
available for<br />
exceedance.<br />
2002 – 2005* Complete* Complete* In August 2005,<br />
calculation of 10minute<br />
rainfall<br />
intensity ceased.<br />
47
DN15/82:<br />
Cleveland<br />
Dam<br />
QT10:<br />
Coquitlam<br />
City Hall<br />
<strong>GVRD</strong> Historical and Future <strong>Rainfall</strong> Analysis <strong>Update</strong>: Final Report – PCIC – 1 August 2007<br />
VA01<br />
Kitsilano High<br />
School<br />
1964-1983 † NA: Jan-64 to<br />
Feb-64, Daily<br />
totals, 10<br />
minute<br />
durations and<br />
sporadic<br />
months, 1973<br />
1992-2001 † NA: Oct-93<br />
to Jan-94,<br />
Feb-00 to<br />
Mar-00<br />
Mar-64 to Dec-72* 5, 15, 30, 1hr,<br />
2hr, 6hr, 12hr<br />
and 24 hrs<br />
additional<br />
data updated<br />
1974 – 1979* 5, 15, 30, 1hr,<br />
2hr, 6hr, 12hr<br />
and 24 hrs<br />
additional<br />
data updated<br />
No exceedance available<br />
No exceedance available<br />
No exceedance available<br />
No exceedance available 10 minutes and<br />
totals were not<br />
updated<br />
2002 – 2005* Complete* Complete* Nov-04 station<br />
switched from<br />
DN15 to DN82<br />
(Appendix C). In<br />
August 2005,<br />
calculation of 10minute<br />
rainfall<br />
1959-2001 † NA: Aug-98<br />
to Oct-98<br />
intensity ceased.<br />
Complete* Aug-98 to Oct-98<br />
cont. 0’s for<br />
exceedance<br />
2002 - 2005* Complete* Complete* In August 2005,<br />
calculation of 10minute<br />
rainfall<br />
1958-1975 † NA: Jan-57 to<br />
Feb-57<br />
1976-1984 † NA: 10<br />
minute<br />
durations and<br />
sporadic<br />
months; 5, 15,<br />
30, 1hr, 2hr,<br />
6hr, 12hr and<br />
24 hrs<br />
updated<br />
1987-2001 † NA: Jan-87 to<br />
Feb-87<br />
Complete*<br />
NA: 1976 to 1984<br />
NA: 1987.<br />
intensity ceased.<br />
2002 - 2005* Complete* Complete* In August 2005,<br />
calculation of 10minute<br />
rainfall<br />
intensity ceased.<br />
48
VA04<br />
Renfrew<br />
Elementary<br />
<strong>GVRD</strong> Historical and Future <strong>Rainfall</strong> Analysis <strong>Update</strong>: Final Report – PCIC – 1 August 2007<br />
VA13<br />
Stanley Park<br />
Yard<br />
VW14<br />
West Van.<br />
Municipal<br />
Hall<br />
1958-1973 † NA: Jan-58 to<br />
Apr-58<br />
1974 - 1987* NA: Some<br />
totals, 10<br />
minute<br />
durations and<br />
sporadic<br />
months<br />
1988 - 2001 NA: Oct-95,<br />
Mar-97 to<br />
Jun-97, Jun-<br />
99 to Feb-00<br />
NA: 1958<br />
No exceedance available<br />
NA: 1999<br />
2002 - 2005* Complete* Complete* In August 2005,<br />
calculation of 10minute<br />
rainfall<br />
intensity ceased.<br />
1950-1974 † Complete* Complete*<br />
1974 – 1982* NA: 10<br />
minute<br />
durations and<br />
sporadic<br />
months, 1980,<br />
1981; 6hr,<br />
12hr and 24<br />
hrs updated<br />
1988-2001 † NA: Oct-89,<br />
Jan-92 to Jun-<br />
92, Feb-96 to<br />
Mar-96, Jul-<br />
97, Aug-99 to<br />
Sep-99, Jul-<br />
00<br />
No exceedance available<br />
Complete*<br />
2002 - 2005* Complete* Complete* In August 2005,<br />
calculation of 10minute<br />
rainfall<br />
1959-1990* NA: 10<br />
minute<br />
durations and<br />
sporadic<br />
months ; 6hr,<br />
12hr and 24<br />
hrs updated,<br />
1980, 1981<br />
1991-2001 † NA: Jul-91,<br />
Jan-94<br />
No exceedance available<br />
Complete*<br />
intensity ceased.<br />
2002 - 2005* Complete* Complete* In August 2005,<br />
calculation of 10minute<br />
rainfall<br />
intensity ceased.<br />
49
<strong>GVRD</strong> Historical and Future <strong>Rainfall</strong> Analysis <strong>Update</strong>: Final Report – PCIC – 1 August 2007<br />
MSC Stations<br />
MSC Pitt<br />
Polder<br />
MSC Surrey -<br />
Kwantlen<br />
MSC YVR<br />
<strong>Vancouver</strong><br />
Int’l Airport<br />
1960-1964 NA:<br />
Intensities<br />
1965-1999 † NA: 24 hr,<br />
Mar-75 to<br />
May-75<br />
durations,<br />
Oct-79, Aug-<br />
91 to Jul-92,<br />
Jun-96 to<br />
Sep-96, Dec-<br />
96, Mar-99 to<br />
Jun-99, Sep-<br />
99 to Dec-99<br />
2000-2005 † * NA:<br />
Intensities,<br />
Oct -04<br />
1960-1997 † NA: 24 hr,<br />
Jan-60 total,<br />
Mar-73 to<br />
May-73, Aug-<br />
80, Dec-80,<br />
Feb 81 total,<br />
Jan-89, Aug-<br />
89, Dec-89 to<br />
Mar-90, Jul-<br />
90, Feb-91 to<br />
May-91, Mar-<br />
92, Jun-96,<br />
Jul-96, Sept-<br />
96, April-<br />
Dec97<br />
1998-2005 † * NA: all<br />
durations,<br />
Sept-98 to<br />
May-99,<br />
2001, Oct-04<br />
to Jan-05<br />
1960-1999 † NA: Jan-60 to<br />
Mar-60, Jul-<br />
60 5 min,<br />
Mar-75 to<br />
May-75, Jan-<br />
76 to Mar-76<br />
6 hr, Feb-78,<br />
Jul-84, Aug-<br />
92, Apr-99 to<br />
May-99, Aug-<br />
99 to Dec-99<br />
2000-2001 † NA: all<br />
durations,<br />
Nov-00 to<br />
Dec-01<br />
No exceedance available<br />
No exceedance available<br />
No exceedance available<br />
No exceedance available<br />
No exceedance available<br />
No exceedance available<br />
No exceedance available<br />
† KWL-02 report<br />
*Completed this update for 2001 - 2005: includes total, 5, 10, 15, 30 minute, 1, 2, 6, 12 and 24 hours updated for rainfall intensity,<br />
exceedance counts include 5, 10, 15, 30 minute, 1, 2, 6, 12 and 24 hours (August 2005 onward for 10 minutes is not available)<br />
50
<strong>GVRD</strong> Historical and Future <strong>Rainfall</strong> Analysis <strong>Update</strong>: Final Report – PCIC – 1 August 2007<br />
Appendix C: Data limitations<br />
51
<strong>GVRD</strong> Historical and Future <strong>Rainfall</strong> Analysis <strong>Update</strong>: Final Report – PCIC – 1 August 2007<br />
Several limitations to rainfall records were determined from the outset of the project.<br />
These were noted, and in some cases required that data not be processed owing to a lack<br />
of complete information. These cases are listed in Appendix B.<br />
<strong>GVRD</strong> Stations<br />
BU31: This station was decommissioned in 1999 and replaced with station BU80. The<br />
new station location is located approximately 1km away from the old station. There was<br />
no overlap of data collection during the time that BU31 was decommissioned and BU80<br />
was set up. Due to known differences between proximal sites in rainfall there is a concern<br />
that shifts in location of this rainfall gauge may significantly alter rainfall collection. The<br />
data has been processed but requires further analysis and examination before it can be<br />
determined if significant shifts have occurred since the installation of BU80, and whether<br />
this is impacting the trend statistics.<br />
DN15: This station was used in the KWL-02 report as a comparison for DN25 (see<br />
original report for a detailed information regarding this comparison). DN15 was<br />
decommissioned in 2004 and replaced by DN82. The new station is located proximal to<br />
its old location and therefore only very minor shifts are anticipated, which are not<br />
expected to significantly impact the rainfall records.<br />
MSC Stations<br />
As MSC rainfall intensity data was only available up to 1999 during preparation of the<br />
update, daily totals were used for 2000-2005, where possible. The MSC rainfall intensity<br />
data should be incorporated into the next update as soon as it becomes available.<br />
52


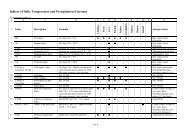
![final_program_abstracts[1]](https://img.yumpu.com/19102520/1/174x260/final-program-abstracts1.jpg?quality=85)