Optical characterization of Er3+and Yb3+ co-doped barium ...
Optical characterization of Er3+and Yb3+ co-doped barium ...
Optical characterization of Er3+and Yb3+ co-doped barium ...

You also want an ePaper? Increase the reach of your titles
YUMPU automatically turns print PDFs into web optimized ePapers that Google loves.
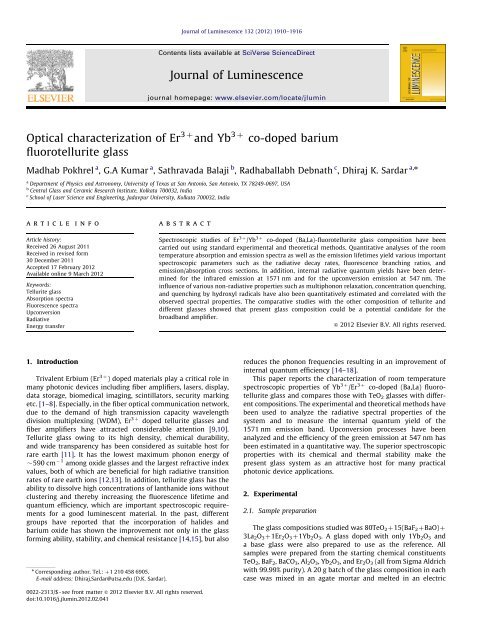
<strong>Optical</strong> <strong>characterization</strong> <strong>of</strong> Er 3 þ and Yb 3 þ <strong>co</strong>-<strong>doped</strong> <strong>barium</strong><br />
fluorotellurite glass<br />
Madhab Pokhrel a , G.A Kumar a , Sathravada Balaji b , Radhaballabh Debnath c , Dhiraj K. Sardar a,n<br />
a<br />
Department <strong>of</strong> Physics and Astronomy, University <strong>of</strong> Texas at San Antonio, San Antonio, TX 78249-0697, USA<br />
b<br />
Central Glass and Ceramic Research Institute, Kolkata 700032, India<br />
c<br />
School <strong>of</strong> Laser Science and Engineering, Jadavpur University, Kolkata 700032, India<br />
article info<br />
Article history:<br />
Received 26 August 2011<br />
Received in revised form<br />
30 December 2011<br />
Accepted 17 February 2012<br />
Available online 9 March 2012<br />
Keywords:<br />
Tellurite glass<br />
Absorption spectra<br />
Fluorescence spectra<br />
Up<strong>co</strong>nversion<br />
Radiative<br />
Energy transfer<br />
1. Introduction<br />
abstract<br />
Trivalent Erbium (Er 3 þ ) <strong>doped</strong> materials play a critical role in<br />
many photonic devices including fiber amplifiers, lasers, display,<br />
data storage, biomedical imaging, scintillators, security marking<br />
etc. [1–8]. Especially, in the fiber optical <strong>co</strong>mmunication network,<br />
due to the demand <strong>of</strong> high transmission capacity wavelength<br />
division multiplexing (WDM), Er 3 þ <strong>doped</strong> tellurite glasses and<br />
fiber amplifiers have attracted <strong>co</strong>nsiderable attention [9,10].<br />
Tellurite glass owing to its high density, chemical durability,<br />
and wide transparency has been <strong>co</strong>nsidered as suitable host for<br />
rare earth [11]. It has the lowest maximum phonon energy <strong>of</strong><br />
590 cm 1 among oxide glasses and the largest refractive index<br />
values, both <strong>of</strong> which are beneficial for high radiative transition<br />
rates <strong>of</strong> rare earth ions [12,13]. In addition, tellurite glass has the<br />
ability to dissolve high <strong>co</strong>ncentrations <strong>of</strong> lanthanide ions without<br />
clustering and thereby increasing the fluorescence lifetime and<br />
quantum efficiency, which are important spectros<strong>co</strong>pic requirements<br />
for a good luminescent material. In the past, different<br />
groups have reported that the in<strong>co</strong>rporation <strong>of</strong> halides and<br />
<strong>barium</strong> oxide has shown the improvement not only in the glass<br />
forming ability, stability, and chemical resistance [14,15], but also<br />
n Corresponding author. Tel.: þ1 210 458 6905.<br />
E-mail address: Dhiraj.Sardar@utsa.edu (D.K. Sardar).<br />
0022-2313/$ - see front matter & 2012 Elsevier B.V. All rights reserved.<br />
doi:10.1016/j.jlumin.2012.02.041<br />
Journal <strong>of</strong> Luminescence 132 (2012) 1910–1916<br />
Contents lists available at SciVerse ScienceDirect<br />
Journal <strong>of</strong> Luminescence<br />
journal homepage: www.elsevier.<strong>co</strong>m/locate/jlumin<br />
Spectros<strong>co</strong>pic studies <strong>of</strong> Er 3 þ /Yb 3 þ <strong>co</strong>-<strong>doped</strong> (Ba,La)-fluorotellurite glass <strong>co</strong>mposition have been<br />
carried out using standard experimental and theoretical methods. Quantitative analyses <strong>of</strong> the room<br />
temperature absorption and emission spectra as well as the emission lifetimes yield various important<br />
spectros<strong>co</strong>pic parameters such as the radiative decay rates, fluorescence branching ratios, and<br />
emission/absorption cross sections. In addition, internal radiative quantum yields have been determined<br />
for the infrared emission at 1571 nm and for the up<strong>co</strong>nversion emission at 547 nm. The<br />
influence <strong>of</strong> various non-radiative properties such as multiphonon relaxation, <strong>co</strong>ncentration quenching,<br />
and quenching by hydroxyl radicals have also been quantitatively estimated and <strong>co</strong>rrelated with the<br />
observed spectral properties. The <strong>co</strong>mparative studies with the other <strong>co</strong>mposition <strong>of</strong> tellurite and<br />
different glasses showed that present glass <strong>co</strong>mposition <strong>co</strong>uld be a potential candidate for the<br />
broadband amplifier.<br />
& 2012 Elsevier B.V. All rights reserved.<br />
reduces the phonon frequencies resulting in an improvement <strong>of</strong><br />
internal quantum efficiency [14–18].<br />
This paper reports the <strong>characterization</strong> <strong>of</strong> room temperature<br />
spectros<strong>co</strong>pic properties <strong>of</strong> Yb 3 þ /Er 3 þ <strong>co</strong>-<strong>doped</strong> (Ba,La) fluorotellurite<br />
glass and <strong>co</strong>mpares those with TeO 2 glasses with different<br />
<strong>co</strong>mpositions. The experimental and theoretical methods have<br />
been used to analyze the radiative spectral properties <strong>of</strong> the<br />
system and to measure the internal quantum yield <strong>of</strong> the<br />
1571 nm emission band. Up<strong>co</strong>nversion processes have been<br />
analyzed and the efficiency <strong>of</strong> the green emission at 547 nm has<br />
been estimated in a quantitative way. The superior spectros<strong>co</strong>pic<br />
properties with its chemical and thermal stability make the<br />
present glass system as an attractive host for many practical<br />
photonic device applications.<br />
2. Experimental<br />
2.1. Sample preparation<br />
The glass <strong>co</strong>mpositions studied was 80TeO 2þ15(BaF 2þBaO)þ<br />
3La2O3þ1Er2O3þ1Yb2O3. A glass <strong>doped</strong> with only 1Yb2O3 and<br />
a base glass were also prepared to use as the reference. All<br />
samples were prepared from the starting chemical <strong>co</strong>nstituents<br />
TeO 2, BaF 2, BaCO 3,Al 2O 3,Yb 2O 3, and Er 2O 3 (all from Sigma Aldrich<br />
with 99.99% purity). A 20 g batch <strong>of</strong> the glass <strong>co</strong>mposition in each<br />
case was mixed in an agate mortar and melted in an electric
furnace at 750 1C for 2 h in platinum crucible and the molten glass<br />
was stirred intermittently to achieve homogeneity. The melt was<br />
then cast onto a preheated (250 1C) carbon mold. The glass disks<br />
thus obtained were annealed at 250 1C for 12 h to avoid undesirable<br />
thermal stresses. The samples were then polished to optical<br />
quality and only bubble and streak free samples <strong>of</strong> thickness<br />
0.2 cm were taken for optical measurements.<br />
The density <strong>of</strong> the sample was measured by Archimedes’s<br />
principle and found to be 5.679 g/cm 3 and the calculated number<br />
density <strong>of</strong> the Er 3 þ ion in the glass were found to be 4.02<br />
10 20 ions/cm 3 .<br />
2.2. <strong>Optical</strong> measurements<br />
The refractive index were measured at five different wavelengths<br />
(473 nm, 532 nm, 632.8 nm, 1060 nm and 1552 nm) on<br />
Metri<strong>co</strong>n M2010 Prism Coupler equipped with respective laser<br />
sources and the obtained values were fitted to Sellmeier’s<br />
dispersion equation to obtain wavelength dependent refractive<br />
index. The absorption spectra were measured in the 300–1700 nm<br />
range using a spectrophotometer (Cary, Model 14R) in the<br />
transmission mode. The NIR emission spectra and fluorescence<br />
decay kinetics <strong>of</strong> the samples were re<strong>co</strong>rded on spectr<strong>of</strong>luorimeter<br />
(Model: Quantum Master enhanced NIR, PTI, USA) fitted<br />
with double monochromators on both excitation and emission<br />
channels. The instrument was equipped with liquid N 2 <strong>co</strong>oled<br />
gated NIR photo-multiplier tube (Model: NIR-PMT-R 1.7, Hamamatsu)<br />
as detector for acquiring both steady state spectra and<br />
phosphorescence decay. For decay measurements, a 60 W Xenon<br />
flash lamp was employed as an excitation source. The up<strong>co</strong>nversion<br />
luminescence spectra <strong>of</strong> the glass were re<strong>co</strong>rded in the above<br />
mentioned spectr<strong>of</strong>luorimeter using a 980 nm fiber pig-tailed<br />
diode laser with variable output power up to a maximum <strong>of</strong><br />
200 mW (Thorlab, USA) as an excitation source. For quantum<br />
yield measurements, the emission spectra <strong>of</strong> the samples were<br />
re<strong>co</strong>rded by exciting the sample with 980 nm band <strong>of</strong> a Ti–S laser<br />
(Spectra Physics, Model 3900S) pumped by an Nd:YAG laser<br />
(Spectra Physics, Model Millennia) and 488 nm band <strong>of</strong> an<br />
Ar-ion laser (Spectra Physics, Model 2500). The up<strong>co</strong>nversion<br />
and the visible emission from the sample were focused onto a<br />
photo multiplier tube (Model 1911, Horiba) and scanned using a<br />
1200 grooves/mm diffraction grating blazed at 0.5 mm, with a<br />
spectral resolution <strong>of</strong> 0.01 nm. The detector signal was processed<br />
in a PC <strong>co</strong>upled to the data acquisition system through a lock in<br />
amplifier (Stanford Research System, Model SR510). The entire<br />
system was <strong>co</strong>ntrolled through the data acquisition s<strong>of</strong>tware<br />
Snerjy (Origin Lab, and Jobin Yvon). All the emissions and decay<br />
time measurements were performed at room temperature. The<br />
FTIR vibrational spectrum was measured on the solid sample in<br />
the transmission mode using the FTIR spectrometer (Bruker,<br />
Model vector 22).<br />
3. Results<br />
3.1. Judd–Ofelt (JO) parameters<br />
The room temperature UV–vis–NIR absorption spectra <strong>of</strong> the<br />
sample are shown in Fig. 1(a) and (b) with their spectral band<br />
assignments. In calculating the absorption <strong>co</strong>efficients, the scattering<br />
losses have been subtracted in all absorption measurements.<br />
The broadening <strong>of</strong> the absorption bands is a <strong>co</strong>nsequence<br />
<strong>of</strong> the absence <strong>of</strong> long range order in the host producing changes<br />
in the micro-symmetry around the Er 3 þ ion. It was found that<br />
all absorption bands <strong>of</strong> Er 3 þ in fluorotellurite glass is similar<br />
to those <strong>of</strong> previously reported tellurite glass hosts [19–21].<br />
M. Pokhrel et al. / Journal <strong>of</strong> Luminescence 132 (2012) 1910–1916 1911<br />
Abs. Coeff. (cm -1 )<br />
Abs. Coeff. (cm -1 )<br />
6<br />
3<br />
0<br />
3.0<br />
1.5<br />
0.0<br />
4 G9/2+ 4 G 11/2<br />
4 F5/2<br />
4 F3/2<br />
2 G9/2<br />
4 F7/2<br />
2 H11/2<br />
4 S3/2<br />
4 F9/2<br />
400 450 500 550 600 650 700<br />
Wavelength (nm)<br />
4 I9/2<br />
4 I11/2 (Er 3+ )+ 2 F 5/2 (Yb 3+ )<br />
800 1000 1200 1400 1600<br />
Wavelength(nm)<br />
4 I13/2<br />
Fig. 1. Room temperature absorption spectra <strong>of</strong> Er 3þ in Er 3þ /Yb 3þ <strong>co</strong>-<strong>doped</strong><br />
glass, 1(a) ranging from 350 to 700 nm, 1(b) ranging from 700 to 1650 nm<br />
including Yb 3þ ( 2 F7/2- 2 F5/2) transition at 980 nm.<br />
Table 1<br />
Measured and calculated absorption line strengths <strong>of</strong> Er 3þ in Er 3 þ /Yb 3þ <strong>co</strong>-<strong>doped</strong><br />
(Ba,La)-tellurite glass at 300 K.<br />
4 I15/2- k (nm) S meas<br />
ed (10 –20 cm 2 ) S cal<br />
ed (10–20 cm 2 )<br />
4 I13/2 1532 2.0121 2.2836<br />
4 I9/2 800 0.2452 0.2978<br />
4 F9/2 654 1.4445 1.5151<br />
4 S3/2 546 0.2088 0.3049<br />
4 H11/2 522 5.2190 5.0589<br />
4 F7/2 490 0.6235 1.1052<br />
4 F5/2 452 0.1303 0.3078<br />
4 F3/2 444 0.0138 0.1754<br />
( 2 G, 4 F, 2 H)9/2 408 0.1603 0.3422<br />
4 G11/2 380 6.3243 6.5085<br />
Twelve absorption bands were identified in the room temperature<br />
absorption spectra between 300 and 1600 nm, shown in<br />
Fig. 1(a) and (b) and are tabulated in Table 1. These absorption<br />
bands were chosen to determine the phenomenological Judd–<br />
Ofelt parameters [22–26] for Er 3 þ in Er 3 þ /Yb 3 þ <strong>doped</strong> fluorotellurite<br />
glass. The JO parameters obtained for the Er 3þ in the present<br />
glassy system are O 2¼5.97 10 20 70.3 cm 2 , O 4¼1.64 10 –<br />
20 70.10 cm 2 ,andO6¼1.38 10 –20 70.067 cm 2 . These values are<br />
in excellent agreement with the values reported earlier for many<br />
tellurite glassy hosts [20,21,27,28] within the relative error <strong>of</strong> fit and<br />
falls at the lower end <strong>of</strong> the range 5–25%, as obtained by the<br />
application <strong>of</strong> the JO theory to other laser materials [22,23,29,30].<br />
Using these phenomenological JO parameters, the emission<br />
line strengths <strong>co</strong>rresponding to the transitions from the upper
1912<br />
multiplet manifolds 2Sþ1 LJ to the <strong>co</strong>rresponding lower lying<br />
multiplet manifolds 2S0 þ1 LJ’ <strong>of</strong> Er 3 þ in the present glass was<br />
calculated [11,22,23,26]. Using these line strengths, radiative<br />
transition probabilities from J to J 0 , radiative decay rates, and<br />
branching ratios were calculated and are tabulated in Table 2.<br />
3.2. Infrared and up<strong>co</strong>nversion luminescence spectra<br />
Fig. 2 shows the infrared emission <strong>of</strong> the glass <strong>co</strong>mposition,<br />
where peak emission was observed at 1571 nm with a spectral<br />
bandwidth <strong>of</strong> 210 nm and full width at half max (FWHM) <strong>of</strong> over<br />
91 nm. Fig. 3 shows the up<strong>co</strong>nversion luminescence spectra<br />
obtained for various pump powers under 980 nm excitation with<br />
an inset photograph <strong>of</strong> the green up<strong>co</strong>nversion emission under<br />
60 mW excitation. The emission bands were observed at 533 nm<br />
(green), 547 nm (green) and 670 nm (red), which are assigned to<br />
the 2 H11/2- 4 I15/2, 4 S3/2- 4 I15/2 and 4 F9/2- 4 I15/2 transitions respectively.<br />
The fluorescence branching ratios <strong>of</strong> the up<strong>co</strong>nversion<br />
bands are 24% (533 nm), 64% (547 nm) and 13% (670 nm) respectively.<br />
Since the integrated intensity is highest for the 547 nm<br />
Table 2<br />
Calculated electric dipole radiative transition probabilities (A ed), fluorescence<br />
branching ratios (b JJ 0), and radiative decay rates (t rad) <strong>of</strong> various excited states <strong>of</strong><br />
Er 3 þ in Er 3 þ /Yb 3 þ <strong>co</strong>-<strong>doped</strong> (Ba,La)-tellurite glass at 300 K.<br />
Transitions k (nm) n S ed (10 –20 cm 2 ) A ed bJ-J 0 (%) s rad (ms)<br />
4<br />
I13/2-I15/2 1571 1.9741 2.3215<br />
a<br />
269.74 100 3.7072<br />
4<br />
I11/2-I15/2 988 1.9886 0.7058 260.02 88.79 3.4148<br />
4<br />
-I13/2<br />
2747 1.9678 1.7404 32.81 11.20<br />
4<br />
F9/2-I15/2 656 2.0202 1.5690 2092.28 89.07 0.4257<br />
4<br />
-I13/2<br />
1143 1.9825 0.4358 117.18 4.98<br />
4<br />
-I11/2<br />
1957 1.9707 2.1547 131.78 5.01<br />
4<br />
-I9/2<br />
3472 1.9666 0.5998 7.82 0.33<br />
4<br />
S3/2-I15/2 545 2.0465 0.3531 861.42 77.06 0.8946<br />
4<br />
-I13/2<br />
842 1.9978 0.1088 75.27 6.73<br />
4<br />
-I11/2<br />
1213 1.9805 0.4862 127.14 11.37<br />
4<br />
-I9/2<br />
1645 1.9733 0.4347 53.96 4.83<br />
2<br />
H9/2-I15/2 408 2.1168 0.2052 1353.64 27.14 0.2005<br />
4<br />
-I13/2<br />
554 2.0438 0.6366 1681.56 33.72<br />
4<br />
-I11/2<br />
694 2.0141 0.7726 1147.26 23.00<br />
4<br />
-I9/2<br />
821 1.9996 0.6192 649.06 13.01<br />
4<br />
F9/2 1076 1.9848 0.3434 155.61 3.12<br />
-<br />
a<br />
269.74 (Aed¼207.12þAmd¼62.62)—including the magnetic dipole <strong>co</strong>ntribution<br />
Amd. Cross section (cm 2 )<br />
6.0x10 -21<br />
4.0x10 -21<br />
2.0x10 -21<br />
0.0<br />
Absorption<br />
Emission<br />
1450 1500 1550 1600 1650<br />
Wavelength (nm)<br />
Fig. 2. NIR emission cross section spectrum <strong>of</strong> the glass under 980 nm laser<br />
excitation along with the overlap <strong>of</strong> the absorption <strong>co</strong>rresponding to 4 I 15/2- 4 I 13/2.<br />
The Y-axis is in cross section normalized with respect to the absorption peak<br />
intensity.<br />
M. Pokhrel et al. / Journal <strong>of</strong> Luminescence 132 (2012) 1910–1916<br />
Intensity (arb.units)<br />
800<br />
600<br />
400<br />
200<br />
100<br />
Laser Power (mW)<br />
200<br />
180<br />
160<br />
140<br />
120<br />
100<br />
80 60<br />
40<br />
20<br />
500 550 600<br />
Wavelength (nm)<br />
650 700<br />
Up<strong>co</strong>nversion Intensity (arb.units)<br />
533nm - Slope-2.3<br />
547nm - Slope-2.2<br />
670nm - Slope-2.1<br />
Laser Power (mW)<br />
Fig. 3. Up<strong>co</strong>nversion emission spectrum under 980 nm excitation. Inset shows the<br />
dependence <strong>of</strong> the intensity <strong>of</strong> the up<strong>co</strong>nversion bands under 980 nm excitation<br />
on pump power. Photograph in the inset is the green up<strong>co</strong>nversion emission under<br />
60 mw excitation power. (For interpretation <strong>of</strong> the references to <strong>co</strong>lor in this<br />
figure, the reader is referred to the web version <strong>of</strong> this article.)<br />
Energy<br />
20<br />
16<br />
12<br />
8<br />
4<br />
0<br />
x (10 3 cm -1 )<br />
2 F5/2<br />
980 nm<br />
2 F7/2<br />
Yb 3+<br />
ET<br />
980 nm<br />
ESA<br />
TPA<br />
1529 nm<br />
523 nm<br />
Er 3+<br />
4 F7/2<br />
2 H11/2<br />
4 S3/2<br />
4 F9/2<br />
4 I9/2<br />
Er 3+<br />
band, the <strong>co</strong>lor <strong>of</strong> the sample appears pure green as shown in inset<br />
<strong>of</strong> Fig. 3. The up<strong>co</strong>nversion process in YbEr system is well understood<br />
in several materials [11,31] and is briefly explained for this<br />
sample using the following energy level diagram as shown in<br />
Fig. 4. Emission bands were observed at 533 nm, 547 nm, and<br />
670 nm and are assigned to the 2 H11/2- 4 I15/2, 4 S3/2- 4 I15/2, and<br />
4 F9/2- 4 I 15/2 transitions respectively. The appearance <strong>of</strong> both the<br />
green and red emission bands can be explained on the basis <strong>of</strong><br />
various processes such as excited state absorption (ESA) and<br />
energy transfer (ET). When the 4 I11/2 level is excited under<br />
980 nm directly through Er 3 þ or through Yb 3 þ excitation photons,<br />
part <strong>of</strong> the excitation energy at the 4 I11/2 level relaxes<br />
MP<br />
546 nm<br />
672 nm<br />
CR<br />
ET<br />
4 I11/2<br />
4 I13/2<br />
4 I15/2<br />
Fig. 4. Energy level diagram <strong>of</strong> Yb 3þ <strong>co</strong>-<strong>doped</strong> with Er 3þ and the possible excitation<br />
and de excitation mechanisms giving rise to the observed up<strong>co</strong>nversion bands.
non-radiatively to the 4 I13/2 level which give rise to the transition<br />
within the manifold 4 I13/2- 4 I15/2 <strong>co</strong>rresponds to emission at<br />
1571nm. At the same time, the populated 4 I11/2 level is further<br />
excited to the 4 F7/2 state by ESA <strong>of</strong> a se<strong>co</strong>nd photon. From 4 F7/2 level<br />
another 980 nm photon can be absorbed to an equally similar excited<br />
level. As explained earlier these excited state processes can equally<br />
happen under high photon density through nonlinear absorption<br />
processes such as two photon or three photon absorption. After these<br />
excited state processes, de-excitation accumulates electron in different<br />
excited states and the intensity <strong>of</strong> emission depends on the<br />
electron density at that particular level as well as the nonradiative<br />
<strong>co</strong>ntribution to the emission band. The two photon processes that<br />
populate the 4 F7/2 level is so efficient that it can give very efficient<br />
green emission transition from 2 H 11/2 due to the fast multiphonon<br />
non-radiative decay <strong>of</strong> 4 F7/2 level to 2 H11/2. Because <strong>of</strong> several closely<br />
spaced levels in between 2 H 11/2 and 4 S 3/2 multiphonon relaxation<br />
results in decaying the 2 H11/2 level to 4 S3/2 yielding the strongest<br />
emission band at 547 nm. Further, since the energy gap between<br />
4 S3/2 and 4 F9/2 is 3080 cm 1 multiphonon relaxation is unlikely to<br />
happen and hence the 4 S 3/2- 4 F 9/2 transition <strong>co</strong>uld be radiative. Part<br />
<strong>of</strong> the population decaying to level 4 F9/2 can result in the red emission<br />
at 670 nm through the 4 F 9/2- 4 I 15/2 transition. The other possible<br />
major process that can populate the 4 F9/2 level <strong>of</strong> Er 3þ is<br />
the energy transfer process from Yb ac<strong>co</strong>rding to the equation<br />
2 F5/2(Yb 3þ )þ 4 I13/2(Er 3þ )- 2 F7/2(Yb 3þ )þ 4 F9/2(Er 3þ ). In order to<br />
establish the presence <strong>of</strong> these nonlinear processes, the pump power<br />
dependence <strong>of</strong> the emission bands on the emission intensity was<br />
measured and the relationship obtained is shown in the inset <strong>of</strong><br />
Fig. 3. The slope obtained for 533, 547 and 670 nm emission bands<br />
are respectively 2.3, 2.2 and 2.1, which shows that two photon<br />
processes <strong>co</strong>ntribute to these emissions.<br />
Fig. 5 presents the NIR emission spectra <strong>of</strong> Yb 3 þ ions singly<br />
<strong>doped</strong> and Yb 3 þ /Er 3 þ ions <strong>co</strong>-<strong>doped</strong> glasses. A 2 fold decrease<br />
in the peak emission intensity <strong>of</strong> Yb 3 þ : 2 F5/2- 2 F7/2 transition at<br />
1006 nm in the <strong>co</strong>-<strong>doped</strong> sample clearly indicates the occurrence<br />
<strong>of</strong> energy transfer. The left inset <strong>of</strong> Fig. 5 shows the decay pr<strong>of</strong>iles<br />
for the 1006 nm emission <strong>of</strong> Yb 3 þ ions in the singly <strong>doped</strong> and <strong>co</strong><strong>doped</strong><br />
sample fitted by single exponential function with a<br />
Emission Intensity (a.u)<br />
10.0 x10 6<br />
8.0 x10 6<br />
6.0 x10 6<br />
4.0 x10 6<br />
2.0 x10 6<br />
0<br />
M. Pokhrel et al. / Journal <strong>of</strong> Luminescence 132 (2012) 1910–1916 1913<br />
Yb: 2 F 5/2-> 2 F 7/2<br />
Log Photon Counts (a.u)<br />
λemi = 1006nm<br />
YbEr; τf = 152μs<br />
Yb; τf = 634μs<br />
<strong>co</strong>rrelation factor <strong>of</strong> 0.99998, and the right inset shows the decay<br />
pr<strong>of</strong>ile for 1571 nm <strong>of</strong> Er 3þ ions in the <strong>co</strong>-<strong>doped</strong> sample also fitted<br />
by single exponential function with a <strong>co</strong>rrelation factor <strong>of</strong> 0.99999.<br />
From the measured lifetimes <strong>of</strong> Yb 3þ transitions at 1006 nm in the<br />
singly <strong>doped</strong> (Yb 3þ )and<strong>co</strong>-<strong>doped</strong>glass(Yb 3þ /Er 3þ ), the energy<br />
transfer rate and efficiency can be calculated using the following<br />
expressions [32]:<br />
WET ¼ 1 1<br />
ð1Þ<br />
t<br />
Z ET ¼ 1<br />
t0<br />
t<br />
, ð2Þ<br />
t0<br />
where t is the lifetime <strong>of</strong> donor, Yb 3 þ ions in the presence <strong>of</strong><br />
acceptor, Er 3 þ ions and t 0 is the lifetime <strong>of</strong> donor, Yb 3 þ ions in<br />
the absence <strong>of</strong> acceptor, Er 3 þ ions. The energy transfer rate from<br />
(Yb 3 þ ) 2 F 5/2-(Er 3 þ ) 4 I 11/2 in the present glass is found to be<br />
5001.6 s 1 showing an energy transfer efficiency <strong>of</strong> 76%.<br />
3.3. Cross section and gain <strong>co</strong>efficient<br />
Emission cross-section (se) and the FWHM are important<br />
parameters in an optical amplifier’s achieving broadband and<br />
high-gain amplification. The bandwidth properties <strong>of</strong> the optical<br />
amplifier can be evaluated from the product FWHM s e. The<br />
larger the product is, the better are the performance <strong>of</strong> the<br />
amplifier. Tables 3 and 4 list the parameters <strong>co</strong>rresponding to<br />
1571 nm emission for <strong>co</strong>mparison such as FWHM, se, and<br />
FWHM s e <strong>of</strong> Er 3 þ in various Er 3 þ /Yb 3 þ <strong>doped</strong> tellurite and<br />
oxide glasses. It is seen that FWHM se in present glass <strong>co</strong>mposition<br />
80TeO 2þ15(BaF 2þBaO)þ3La 2O 3 is larger than in other tellurite<br />
glasses reported in the literature [17,27], but less than the<br />
reported in the literature [33,34] system, which indicates that<br />
present glass <strong>co</strong>mposition is better among the <strong>co</strong>mposition based<br />
on TeO 2þBaF 2, TeO 2þZnO, germinate [35], and silicate [36] for a<br />
broadband amplifier.<br />
A long upper state lifetime in a gain medium enables a<br />
significant population inversion with a relatively low pump<br />
400 800 120016002000 1200 2400 3600 4800<br />
Time (micro sec)<br />
Yb<br />
YbEr<br />
λ emi = 1571nm<br />
YbEr;τ f = 2693 μs<br />
1000 1125 1250 1375 1500 1625<br />
Wavelength (nm)<br />
Fig. 5. Emission spectra <strong>of</strong> Yb 3þ ion singly <strong>doped</strong> and Yb 3þ /Er 3þ ion <strong>co</strong>-<strong>doped</strong> tellurite glasses. Insets show the decay pr<strong>of</strong>iles for the emissions.<br />
Er: 4 I 13/2-> 4 I 15/2
1914<br />
Table 3<br />
Fluorescence lifetime (tf), emission cross-section (se), and full width at half max (FWHM) for the emission at 1571 nm in tellurite glass with different <strong>co</strong>mpositions.<br />
Sample (mol%) t f (ms) s e (10 21 cm 2 ) FWHM (nm) s e FWHM (10 28 cm 3 )<br />
80TeO2þ 15(BaF2þBaO)þ3La2O3þ1Er2O3þ1Yb2O3 a<br />
2.693 6.82 91 621<br />
75TeO2þ20ZnOþ5Na2Oþ0.5Er2O3þ1Yb2O3[21] 3.15 8.8 56 493<br />
70TeO2þ20ZnOþ5Li2Oþ5La2O3þ0.5Er2O3þ0.5Yb2O3[27] 4.02 8.5 65 553<br />
70TeO2þ10ZnOþ5BaF2þ15PbCl2þ0.5Er2O3þ1Yb2O3[17] 4.16 8.15 52 424<br />
70TeO2þ5BaF2þ10ZnBr2þ15PbF2þ0.5Er2O3þ1Yb2O3[17] 4.05 8.3 56 465<br />
70TeO2þ5BaF2þ10ZnBr2þ15PbCl2þ0.5Er2O3þ1Yb2O3[17] 3.85 8.45 55 465<br />
75TeO2þ15WO3þ10La2O3þ1Er2O3þ5Yb2O3[33] 3.0 10 77 770<br />
65TeO2þ15B2O3þ20SiO2 þ0.5Er2O3þ2.5Yb2O3[37] 2.38 7.49 71 532<br />
70TeO2þ20ZnOþ10PbOþ1Er2O3þ5Yb2O3[34] 2.69 8.77 72 631<br />
a Sample under study.<br />
Table 4<br />
Fluorescence lifetime (t f), emission cross-section (s e), and full width at half max (FWHM) for the emission at 1571 nm in different<br />
glasses.<br />
Glass type t f (ms) s e (10 21 cm 2 ) FWHM (nm) s e FWHM (10 28 cm 3 ) s e t f (10 23 cm 2 s)<br />
Tellurite [21] 3.15 8.8 56 493 2.77<br />
Silicate [36] 3.81 5.5 40 220 2.09<br />
Bismuth [38] 4.5 8.5 75 637 3.82<br />
Germanate [35] 9.55 5.7 53 302 5.44<br />
Oxyfluoride silicate [39] 9.4 7.4 60 444 6.95<br />
((Ba,La)-tellurite) a<br />
2.693 6.82 91 621 1.84<br />
a Sample under study.<br />
power. A higher excited state population with high emission cross<br />
section enables to achieve high optical gain. Thus in the design <strong>of</strong><br />
high gain amplifiers the product <strong>of</strong> emission cross section and<br />
excited state lifetime (s et) is very important and is found to be<br />
threshold pump power [40,41], The set value obtained for the<br />
present glass <strong>co</strong>mposition is listed in Table 4 along with other<br />
glass <strong>co</strong>mpositions, indicating that high gain <strong>co</strong>uld be achieved in<br />
the present glass.<br />
In analyzing the amplifier performance for broadband applications<br />
gain cross section is an important parameter. By measuring<br />
the absorption and emission cross sections using standard procedure<br />
[11] one can simulate the gain spectrum using the<br />
expression<br />
sg ¼ Nse ð1 NÞsa, ð3Þ<br />
where sa is the absorption cross section, se is the emission cross<br />
section and N is the fractional population inversion in the<br />
emitting level. The calculated gain spectra for different population<br />
inversions shown in Fig. 6 indicate that the gain increases with<br />
the population inversion and positive gain in the system can be<br />
achieved only for a population inversion <strong>of</strong> 20% and above. It is<br />
interesting to notice from Fig. 6 that even for a 20% <strong>of</strong> population<br />
a flat gain was observed in the L-band side and further increase in<br />
the population 50–60% a better gain was observed both in the S<br />
and L band regions. Moreover, the obtained gain spectrum spread<br />
from 1440 nm to 1650 nm with a spectral width <strong>of</strong> over 210 nm.<br />
3.4. Non-radiative processes and internal quantum yield<br />
A quantitative way <strong>of</strong> measuring the internal quantum yield<br />
for a particular emission band is done through the fluorescence<br />
lifetime measurements. Non-radiative processes such as multiphonon<br />
relaxation, vibrational losses by hydroxyl and other<br />
functional groups and energy transfer interaction quench the<br />
fluorescence intensity and the efficiency. The observed lifetime<br />
M. Pokhrel et al. / Journal <strong>of</strong> Luminescence 132 (2012) 1910–1916<br />
Gain <strong>co</strong>rss section, σ g (10 -20 cm 2 )<br />
0.5<br />
0.0<br />
-0.5<br />
1450 1500 1550 1600 1650<br />
Wavelength (nm)<br />
<strong>of</strong> the emission can be written as [42]<br />
Ν =0<br />
Ν =10<br />
Ν =20<br />
Ν =30<br />
Ν =40<br />
Ν =50<br />
Ν =60<br />
Ν =70<br />
Ν =80<br />
Ν =90<br />
Ν =100<br />
Fig. 6. Gain cross section spectrum for the 4 I13/2- 4 I15/2 transition showing the<br />
possible spectral width and peak gain cross section. The spectrum was simulated<br />
for different population inversion P.<br />
1<br />
¼ AradþWmp þWOH þWET, ð4Þ<br />
tlum where A rad, W mp, W HO, W ET are the radiative transition rate,<br />
transition rate from multiphonon relaxation, hydroxyl groups<br />
and energy transfer interactions, respectively. The <strong>co</strong>ntribution<br />
to non-radiative decay <strong>co</strong>mes from multiphonon relaxation from<br />
the host and energy transfer interaction between nearby ions. The<br />
transition probability by energy transfer depends on the distance<br />
between the donor (D) and acceptor (A) ions, R DA, and hence<br />
depends on the <strong>co</strong>ncentration <strong>of</strong> the ions. When the ions are<br />
homogeneously distributed in the matrix, the energy transfer
elaxation rate WET can be written as [43]<br />
WETp 1<br />
R 6<br />
pN<br />
DA<br />
2 , ð5Þ<br />
where N is the ionic <strong>co</strong>ncentration. Since the Er 3 þ 3 þ<br />
and Yb<br />
<strong>co</strong>ncentration on the present sample is too low <strong>co</strong>mpared to that<br />
reported in the literature [24,44], ET does not have appreciable<br />
influence on the non-radiative losses. The values <strong>of</strong> WOH can be<br />
determined from the quantitative measurements <strong>of</strong> the OH<br />
<strong>co</strong>ntent and the low frequency vibrational modes in the sample<br />
from the infrared vibrational spectrum shown in Fig. 7. The FTIR<br />
spectrum shows the characteristic Te–O symmetric vibration at<br />
640 cm 1 , which is usually present in the tellurite glass [45].<br />
Using this frequency, the transition rate for multiphonon vibrational<br />
loss (Wmp) <strong>of</strong> the 1571 nm emission band was estimated to<br />
be 0.00282 s 1 [42], which is negligibly small.<br />
So the main <strong>co</strong>ntribution is <strong>co</strong>ming from water <strong>co</strong>ntent, which is<br />
<strong>co</strong>nfirmed by the absorption band at 2933 cm 1 in the IR spectrum.<br />
In the tellurite glasses, these absorption bands originate from the<br />
stretching vibration <strong>of</strong> OH groups, which are in<strong>co</strong>rporated as Te(OH) 6<br />
and H2TeO6 [45–47], and the 2283 cm 1 absorption are ascribed to<br />
the strongly hydrogen-bonded OH-groups. Because <strong>of</strong> the various<br />
sites <strong>of</strong> OH-groups in the vitreous host and the highly disordered<br />
hydrogen-bonded OH-groups made the absorption bands quite<br />
broad. The absolute measurement <strong>of</strong> OH <strong>co</strong>ntent in glasses is<br />
difficult, particularly at <strong>co</strong>ncentration below 1000 ppm. However, a<br />
relative estimate <strong>of</strong> the water <strong>co</strong>ntent can be obtained from the<br />
infrared absorption measurements <strong>co</strong>rresponding to the OH band.<br />
The amount <strong>of</strong> water <strong>co</strong>ntent in the glass samples can be obtained<br />
from the measurement <strong>of</strong> the absorption <strong>co</strong>efficient at the OH peak<br />
<strong>of</strong> the IR spectrum and is estimated to be nearly 2.4 cm 1 .AnOH<br />
<strong>co</strong>ncentration <strong>of</strong> 3607100 ppm gives absorption <strong>of</strong> 2.8 cm 1 [48].<br />
By <strong>co</strong>mparison, the <strong>co</strong>rresponding water <strong>co</strong>ntent was estimated to be<br />
308 ppm (5.5 10 19 molecules/cm 3 ). Since the se<strong>co</strong>nd order vibrational<br />
frequency <strong>of</strong> OH is almost in resonance with the 4 113/2- 4 I15/2<br />
transition in Er 3þ , they are powerful quenchers <strong>of</strong> the Er 3þ emission<br />
at 1571 nm. The quenching rate due to this water <strong>co</strong>ntent is found to<br />
be proportional to the absorption <strong>co</strong>efficient <strong>of</strong> the OH radicals [49].<br />
Themajorsources<strong>of</strong>OH<strong>co</strong>ntentintheglassarefromthestarting<br />
chemicals as well as from the synthesis atmosphere. Higher level <strong>of</strong><br />
water <strong>co</strong>ntent can be suppressed using moisture free chemicals<br />
melted in water free environment as well as by re-melting <strong>of</strong> the<br />
glasses.<br />
The internal quantum efficiency, (ZInt) can be evaluated from<br />
the ratio <strong>of</strong> the fluorescence to radiative decay time [26]. The<br />
Absorbance<br />
4<br />
3<br />
2<br />
1<br />
0<br />
Te-O<br />
O-H<br />
1000 2000 3000 4000<br />
Frequency (cm -1 )<br />
Te(OH) 6<br />
Fig. 7. Infrared vibration spectrum <strong>of</strong> glass <strong>co</strong>mposition showing the presence <strong>of</strong><br />
OH radicals associated with the tellurite network.<br />
M. Pokhrel et al. / Journal <strong>of</strong> Luminescence 132 (2012) 1910–1916 1915<br />
Up<strong>co</strong>nversion efficiency (%)<br />
0.300<br />
0.225<br />
0.150<br />
0.075<br />
lifetime obtained for the 1571 nm emission in the glass <strong>co</strong>mposition<br />
was 2.693 ms and this together with the calculated radiative<br />
decay time <strong>of</strong> 3.707 ms yields a radiative internal quantum<br />
efficiency <strong>of</strong> near 73%. It should be noted that this internal<br />
quantum yield is smaller <strong>co</strong>mpared to similar reported tellurite<br />
<strong>co</strong>mposition [17,21,27,33]. However the influence <strong>of</strong> OH radicals<br />
and other non-radiative interactions from Er 3 þ ions detracts the<br />
efficiency less than 100% as noticed from our calculations.<br />
The up<strong>co</strong>nversion efficiency (Zup) can be calculated by <strong>co</strong>mparing<br />
the up<strong>co</strong>nversion luminescence signal with the directly<br />
excited signal intensity using the expression [50]<br />
P<br />
Z ¼ Z<br />
absð488nmÞI550ð980nmÞ<br />
q<br />
Pabsð980nmÞI550ð488nmÞ where Pabs(l) represent the power absorbed by the glass sample<br />
at the indicated wavelength, and I 550(l) denotes the relative<br />
intensity generated in the green when the sample is photo excited<br />
at the indicated pump wavelength, and Zq represents the internal<br />
radiative quantum yield <strong>of</strong> the 547 nm emission. For the 4 S3/2<br />
state <strong>of</strong> Er 3 þ , tflu and trad were determined to be 26 ms and<br />
0.260 ms respectively yielding an internal radiative quantum<br />
yield <strong>of</strong> 10% for the green up<strong>co</strong>nversion emission. The values <strong>of</strong><br />
P abs(l) in Eq. (6) were calculated from the measured power<br />
incident on the sample, and the known absorption <strong>co</strong>efficient at<br />
the excitation wavelength. On the basis <strong>of</strong> Eq. (6), the 980 nm-<br />
547 nm up<strong>co</strong>nversion efficiency in glass has been calculated from<br />
experimental measurements made for several values <strong>of</strong> excitation<br />
power at 980 nm, 488 nm and the results are illustrated in Fig. 8.<br />
For all the pump powers, Z increases approximately linearly with<br />
an efficiency <strong>of</strong> 0.3% at 60 mW excitation. The saturation <strong>of</strong> the<br />
detector limits the efficiency measurements for higher values <strong>of</strong><br />
the excitation power.<br />
4. Conclusion<br />
10 20 30 40 50 60<br />
Excitation Power (mW)<br />
Fig. 8. Green up<strong>co</strong>nversion efficiency dependence under 980 nm excitation power.<br />
An in depth spectros<strong>co</strong>pic analysis <strong>of</strong> Yb 3 þ /Er 3 þ <strong>co</strong>-<strong>doped</strong><br />
(Ba,La) tellurite glass host has been performed following the<br />
theoretical and experimental methods. The investigations on the<br />
fluorescence spectral properties <strong>of</strong> Yb 3 þ /Er 3 þ <strong>co</strong>-<strong>doped</strong> (Ba,La)<br />
tellurite glass <strong>co</strong>mposition shows better optical performance in<br />
terms <strong>of</strong> gain cross section and full width at half max (FWHM) <strong>of</strong><br />
over 91 nm <strong>co</strong>mpared to other glass system. Although, the<br />
internal quantum efficiency <strong>of</strong> the present system approaches<br />
near 73% that is <strong>co</strong>mparable to similar <strong>co</strong>mpositions, the influence<br />
<strong>of</strong> non-radiative interactions from OH radicals can be<br />
ð6Þ
1916<br />
suppressed using moisture free chemical melting in water free<br />
environment or by re-melting the glass and increase the internal<br />
efficiency close to100%. The internal radiative quantum yield <strong>of</strong><br />
10% was obtained for the green up<strong>co</strong>nversion emission at 547 nm.<br />
The low up<strong>co</strong>nversion efficiency <strong>of</strong>fers additional possibility <strong>of</strong><br />
enhancing the infrared emission quantum yield by optimizing the<br />
dopant <strong>co</strong>ncentration as well as synthesizing the sample in<br />
moisture free environment. More detailed investigations on range<br />
<strong>of</strong> Yb 3 þ /Er 3 þ dopant <strong>co</strong>ncentrations are under way to understand<br />
the details <strong>of</strong> the energy transfer and other non-radiative process.<br />
Acknowledgments<br />
This research was supported by the National Science Foundation<br />
Partnership for Research and Education in Materials (NSF-PREM)<br />
Grant no. DMR-0934218. One <strong>of</strong> the authors, Balaji, also acknowledges<br />
the support from the Director, CSIR-CGCRI, Kolkata.<br />
References<br />
[1] A. Brenier, Chem. Phys. Lett. 290 (1998) 329.<br />
[2] Y. Chen, Y. Huang, Z. Luo, Chem. Phys. Lett. 382 (2003) 481.<br />
[3] N. Chiodini, A. Paleari, G. Brambilla, E.R. Taylor, Appl. Phys. Lett. 80 (2002)<br />
4449.<br />
[4] D.F. de Sousa, L.F.C. Zonetti, M.J.V. Bell, R. Lebullenger, A.C. Hernandes,<br />
L.A.O. Nunes, J. Appl. Phys. 85 (1999) 2502.<br />
[5] D. Jaque, J. Capmany, F. Molero, Z.D. Luo, J. García Sole, Opt. Mater. 10 (1998)<br />
211.<br />
[6] N. Rakov, F.E. Ramos, G. Hirata, M. Xiao, Appl. Phys. Lett. 83 (2003) 272.<br />
[7] T.J. Whitley, C.A. Millar, R. Wyatt, M.C. Brierley, D. Szebesta, Electron. Lett. 27<br />
(1991) 1785.<br />
[8] Y.C. Yan, A.J. Faber, H. de Waal, P.G. Kik, A. Polman, Appl. Phys. Lett. 71 (1997)<br />
2922.<br />
[9] Y. Hu, S. Jiang, G. Sorbello, T. Luo, Y. Ding, B.-C. Hwang, J.-H. Kim, H.-J. Seo,<br />
N. Peyghambarian, J. Opt. Soc. Am. A 18 (2001) 1928.<br />
[10] H. Lin, G. Meredith, S. Jiang, X. Peng, T. Luo, N. Peyghambarian, E.Y.-B. Pun,<br />
J. Appl. Phys. 93 (2003) 186.<br />
[11] P.C. Becker, N.A. Olsson, J.R. Simpson, Erbium-Doped Fiber Amplifiers<br />
Fundamentals and Technology, Academic Press, San Diego, 1999.<br />
[12] J.C. Michel, D. Morin, F. Auzel, Rev. Phys. Appl. 13 (1978) 859.<br />
[13] Z. Pan, S.H. Morgan, K. Dyer, A. Ueda, H. Liu, J. Appl. Phys. 79 (1996) 8906.<br />
[14] K.J. Pluciński, W. Gruhn, J. Wasylak, J. Ebothe, D. Dorosz, J. Kucharski,<br />
I.V. Kityk, Opt. Mater. 22 (2003) 13.<br />
[15] H. Sun, S. Xu, S. Dai, J. Zhang, L. Hu, Z. Jiang, Solid State Commun. 132 (2004)<br />
193.<br />
[16] X. Wang, H. Lin, D. Yang, L. Lin, E.Y.-B. Pun, J. Appl. Phys. 101 (2007) 113535.<br />
[17] J. Yang, L. Zhang, L. Wen, S. Dai, L. Hu, Z. Jiang, J. Appl. Phys. 95 (2004) 3020.<br />
M. Pokhrel et al. / Journal <strong>of</strong> Luminescence 132 (2012) 1910–1916<br />
[18] M.A.P. Silva, Y. Messaddeq, V. Briois, M. Poulain, F. Villain, S.J.L. Ribeiro,<br />
J. Phys. Chem. Solids 63 (2002) 605.<br />
[19] J. Lu, M. Prabhu, J. Song, C. Li, J. Xu, K. Ueda, A.A. Kaminskii, H. Yagi,<br />
T. Yanagitani, Appl. Phys. B Lasers Opt. 71 (2000) 469.<br />
[20] A. Ghosh, R. Debnath, Opt. Mater. 31 (2009) 604.<br />
[21] I. Jlassi, H. Elhouichet, M. Ferid, C. Barthou, J. Lumin. 130 (2010) 2394.<br />
[22] B.R. Judd, Phys. Rev. 127 (1962) 750.<br />
[23] G. Ofelt, J. Chem. Phys. 37 (1962) 511.<br />
[24] M. Pokhrel, G.A. Kumar, P. Samuel, K.I. Ueda, T. Yanagitani, H. Yagi, D.K. Sardar,<br />
Opt. Mater. Express 1 (2011) 1272.<br />
[25] A.A. Kaminskii, Laser Crystals: Physics and Properties, Springer-Verlag, Berlin,<br />
New York, 1979.<br />
[26] A.A. Kaminskii, Laser Crystals: Their Physics and Properties, Springer-Verlag,<br />
Berlin, New York, 1990.<br />
[27] H. Desirena, E.D.l. Rosa, A. Shulzgen, S. Shabet, N. Peyghambarian, J. Phys. D<br />
41 (2008) 095102.<br />
[28] D.K. Sardar, D.M. Dee, K.L. Nash, R.M. Yow, J.B. Gruber, R. Debnath, J. Appl.<br />
Phys. 102 (2007) 083105.<br />
[29] A. Kaminskii, K. Ueda, A. Konstantinova, H. Yagi, T. Yanagitani, A. Butashin,<br />
V. Orekhova, J. Lu, K. Takaichi, T. Uematsu, M. Musha, A. Shirokava, Crystallogr.<br />
Rep. 48 (2003) 868.<br />
[30] W.F. Krupke, M.D. Shinn, J.E. Marion, J.A. Caird, S.E. Stokowski, J. Opt. Soc. Am.<br />
B 3 (1986) 102.<br />
[31] M.J.F. Digonnet, Society <strong>of</strong> Photo-optical Instrumentation, Selected Papers on<br />
Rare-Earth-Doped Fiber Laser Sources and Amplifiers, SPIE <strong>Optical</strong> Engineering<br />
Press, Bellingham, Washington, 1992.<br />
[32] L.M.S. El-Deen, M.S.A. Salhi, M.M. Elkholy, J. Alloys Compd. 465 (2008) 333.<br />
[33] X. Shen, Q. Nie, T. Xu, Y. Gao, Spectrochim. Acta A 61 (2005) 2189.<br />
[34] Z. Jin, Q. Nie, T. Xu, S. Dai, X. Shen, X. Zhang, Mater. Chem. Phys. 104 (2007)<br />
62.<br />
[35] H. Lin, E.Y.B. Pun, S.Q. Man, X.R. Liu, J. Opt. Soc. Am. B 18 (2001) 602.<br />
[36] X. Feng, S. Tanabe, T. Hanada, J. Am. Ceram. Soc. 84 (2001) 165.<br />
[37] T. Xu, X. Zhang, S. Dai, Q. Nie, X. Shen, X. Zhang, Physica B 389 (2007) 242.<br />
[38] J. Yang, S. Dai, N. Dai, S. Xu, L. Wen, L. Hu, Z. Jiang, J. Opt. Soc. Am. B 20 (2003)<br />
810.<br />
[39] S. Xu, Z. Yang, S. Dai, J. Yang, L. Hu, Z. Jiang, J. Alloys Compd. 361 (2003) 313.<br />
[40] H. Kühn, S.T. Fredrich-Thornton, C. Kränkel, R. Peters, K. Petermann, Opt. Lett.<br />
32 (2007) 1908.<br />
[41] D.S. Sumida, T.Y. Fan, Opt. Lett. 19 (1994) 1343.<br />
[42] B. Di Bartolo, G. Armagan, International School <strong>of</strong> Molecular, Spectros<strong>co</strong>py <strong>of</strong><br />
Solid-State Laser-Type Materials. Plenum Press, New York, 1987.<br />
[43] D. Dexter, J. Chem. Phys. 21 (1953) 836.<br />
[44] W.Q. Shi, M. Bass, M. Birnbaum, J. Opt. Soc. Am. B 7 (1990) 1456.<br />
[45] G. Liao, Q. Chen, J. Xing, H. Gebavi, D. Milanese, M. Fokine, M. Ferraris, J. Non-<br />
Cryst. Solids 355 (2009) 447.<br />
[46] G.A. Hebbink, L. Grave, L.A. Woldering, D.N. Reinhoudt, F.C.J.M. van Veggel,<br />
J. Phys. Chem. A 107 (2003) 2483.<br />
[47] J. Massera, A. Haldeman, J. Jackson, C. Rivero-Baleine, L. Petit, K. Richardson,<br />
J. Am. Ceram. Soc 94 (2010) 130.<br />
[48] D.E. Day, J.M. Stevels, J. Non-Cryst. Solids 14 (1974) 165.<br />
[49] S.A. Payne, M.L. Elder, J.H. Campbell, G.D. Wilke, M.J. Weber, J. Am. Ceram.<br />
Soc. 28 (1991) 253.<br />
[50] G.A. Kumar, A. Martinez, E. Mejia, J.G. Eden, J. Alloys Compd. 365 (2004) 117.