Optical characterization of Er3+and Yb3+ co-doped barium ...
Optical characterization of Er3+and Yb3+ co-doped barium ...
Optical characterization of Er3+and Yb3+ co-doped barium ...

Create successful ePaper yourself
Turn your PDF publications into a flip-book with our unique Google optimized e-Paper software.
furnace at 750 1C for 2 h in platinum crucible and the molten glass<br />
was stirred intermittently to achieve homogeneity. The melt was<br />
then cast onto a preheated (250 1C) carbon mold. The glass disks<br />
thus obtained were annealed at 250 1C for 12 h to avoid undesirable<br />
thermal stresses. The samples were then polished to optical<br />
quality and only bubble and streak free samples <strong>of</strong> thickness<br />
0.2 cm were taken for optical measurements.<br />
The density <strong>of</strong> the sample was measured by Archimedes’s<br />
principle and found to be 5.679 g/cm 3 and the calculated number<br />
density <strong>of</strong> the Er 3 þ ion in the glass were found to be 4.02<br />
10 20 ions/cm 3 .<br />
2.2. <strong>Optical</strong> measurements<br />
The refractive index were measured at five different wavelengths<br />
(473 nm, 532 nm, 632.8 nm, 1060 nm and 1552 nm) on<br />
Metri<strong>co</strong>n M2010 Prism Coupler equipped with respective laser<br />
sources and the obtained values were fitted to Sellmeier’s<br />
dispersion equation to obtain wavelength dependent refractive<br />
index. The absorption spectra were measured in the 300–1700 nm<br />
range using a spectrophotometer (Cary, Model 14R) in the<br />
transmission mode. The NIR emission spectra and fluorescence<br />
decay kinetics <strong>of</strong> the samples were re<strong>co</strong>rded on spectr<strong>of</strong>luorimeter<br />
(Model: Quantum Master enhanced NIR, PTI, USA) fitted<br />
with double monochromators on both excitation and emission<br />
channels. The instrument was equipped with liquid N 2 <strong>co</strong>oled<br />
gated NIR photo-multiplier tube (Model: NIR-PMT-R 1.7, Hamamatsu)<br />
as detector for acquiring both steady state spectra and<br />
phosphorescence decay. For decay measurements, a 60 W Xenon<br />
flash lamp was employed as an excitation source. The up<strong>co</strong>nversion<br />
luminescence spectra <strong>of</strong> the glass were re<strong>co</strong>rded in the above<br />
mentioned spectr<strong>of</strong>luorimeter using a 980 nm fiber pig-tailed<br />
diode laser with variable output power up to a maximum <strong>of</strong><br />
200 mW (Thorlab, USA) as an excitation source. For quantum<br />
yield measurements, the emission spectra <strong>of</strong> the samples were<br />
re<strong>co</strong>rded by exciting the sample with 980 nm band <strong>of</strong> a Ti–S laser<br />
(Spectra Physics, Model 3900S) pumped by an Nd:YAG laser<br />
(Spectra Physics, Model Millennia) and 488 nm band <strong>of</strong> an<br />
Ar-ion laser (Spectra Physics, Model 2500). The up<strong>co</strong>nversion<br />
and the visible emission from the sample were focused onto a<br />
photo multiplier tube (Model 1911, Horiba) and scanned using a<br />
1200 grooves/mm diffraction grating blazed at 0.5 mm, with a<br />
spectral resolution <strong>of</strong> 0.01 nm. The detector signal was processed<br />
in a PC <strong>co</strong>upled to the data acquisition system through a lock in<br />
amplifier (Stanford Research System, Model SR510). The entire<br />
system was <strong>co</strong>ntrolled through the data acquisition s<strong>of</strong>tware<br />
Snerjy (Origin Lab, and Jobin Yvon). All the emissions and decay<br />
time measurements were performed at room temperature. The<br />
FTIR vibrational spectrum was measured on the solid sample in<br />
the transmission mode using the FTIR spectrometer (Bruker,<br />
Model vector 22).<br />
3. Results<br />
3.1. Judd–Ofelt (JO) parameters<br />
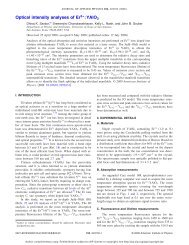
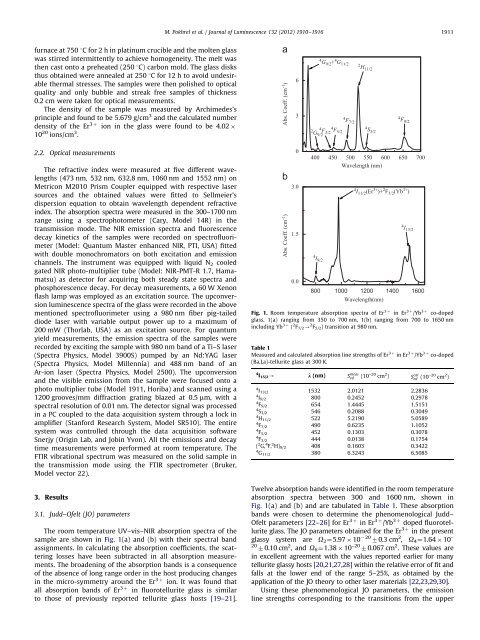
The room temperature UV–vis–NIR absorption spectra <strong>of</strong> the<br />
sample are shown in Fig. 1(a) and (b) with their spectral band<br />
assignments. In calculating the absorption <strong>co</strong>efficients, the scattering<br />
losses have been subtracted in all absorption measurements.<br />
The broadening <strong>of</strong> the absorption bands is a <strong>co</strong>nsequence<br />
<strong>of</strong> the absence <strong>of</strong> long range order in the host producing changes<br />
in the micro-symmetry around the Er 3 þ ion. It was found that<br />
all absorption bands <strong>of</strong> Er 3 þ in fluorotellurite glass is similar<br />
to those <strong>of</strong> previously reported tellurite glass hosts [19–21].<br />
M. Pokhrel et al. / Journal <strong>of</strong> Luminescence 132 (2012) 1910–1916 1911<br />
Abs. Coeff. (cm -1 )<br />
Abs. Coeff. (cm -1 )<br />
6<br />
3<br />
0<br />
3.0<br />
1.5<br />
0.0<br />
4 G9/2+ 4 G 11/2<br />
4 F5/2<br />
4 F3/2<br />
2 G9/2<br />
4 F7/2<br />
2 H11/2<br />
4 S3/2<br />
4 F9/2<br />
400 450 500 550 600 650 700<br />
Wavelength (nm)<br />
4 I9/2<br />
4 I11/2 (Er 3+ )+ 2 F 5/2 (Yb 3+ )<br />
800 1000 1200 1400 1600<br />
Wavelength(nm)<br />
4 I13/2<br />
Fig. 1. Room temperature absorption spectra <strong>of</strong> Er 3þ in Er 3þ /Yb 3þ <strong>co</strong>-<strong>doped</strong><br />
glass, 1(a) ranging from 350 to 700 nm, 1(b) ranging from 700 to 1650 nm<br />
including Yb 3þ ( 2 F7/2- 2 F5/2) transition at 980 nm.<br />
Table 1<br />
Measured and calculated absorption line strengths <strong>of</strong> Er 3þ in Er 3 þ /Yb 3þ <strong>co</strong>-<strong>doped</strong><br />
(Ba,La)-tellurite glass at 300 K.<br />
4 I15/2- k (nm) S meas<br />
ed (10 –20 cm 2 ) S cal<br />
ed (10–20 cm 2 )<br />
4 I13/2 1532 2.0121 2.2836<br />
4 I9/2 800 0.2452 0.2978<br />
4 F9/2 654 1.4445 1.5151<br />
4 S3/2 546 0.2088 0.3049<br />
4 H11/2 522 5.2190 5.0589<br />
4 F7/2 490 0.6235 1.1052<br />
4 F5/2 452 0.1303 0.3078<br />
4 F3/2 444 0.0138 0.1754<br />
( 2 G, 4 F, 2 H)9/2 408 0.1603 0.3422<br />
4 G11/2 380 6.3243 6.5085<br />
Twelve absorption bands were identified in the room temperature<br />
absorption spectra between 300 and 1600 nm, shown in<br />
Fig. 1(a) and (b) and are tabulated in Table 1. These absorption<br />
bands were chosen to determine the phenomenological Judd–<br />
Ofelt parameters [22–26] for Er 3 þ in Er 3 þ /Yb 3 þ <strong>doped</strong> fluorotellurite<br />
glass. The JO parameters obtained for the Er 3þ in the present<br />
glassy system are O 2¼5.97 10 20 70.3 cm 2 , O 4¼1.64 10 –<br />
20 70.10 cm 2 ,andO6¼1.38 10 –20 70.067 cm 2 . These values are<br />
in excellent agreement with the values reported earlier for many<br />
tellurite glassy hosts [20,21,27,28] within the relative error <strong>of</strong> fit and<br />
falls at the lower end <strong>of</strong> the range 5–25%, as obtained by the<br />
application <strong>of</strong> the JO theory to other laser materials [22,23,29,30].<br />
Using these phenomenological JO parameters, the emission<br />
line strengths <strong>co</strong>rresponding to the transitions from the upper