echocardiography: basic principles Two dimensional speckle tracking
echocardiography: basic principles Two dimensional speckle tracking
echocardiography: basic principles Two dimensional speckle tracking

You also want an ePaper? Increase the reach of your titles
YUMPU automatically turns print PDFs into web optimized ePapers that Google loves.
Education in Heart<br />
Downloaded from<br />
heart.bmj.com on May 1, 2010 - Published by group.bmj.com<br />
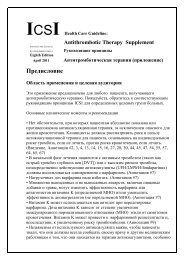
Figure 3 Rotation of left ventricular apex and base during the heart cycle. Rot, rotation;<br />
l, length; diast, diastole; syst, systole; ap, apical; diff, difference.<br />
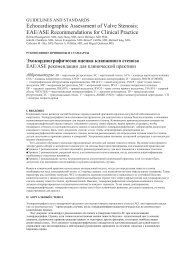
Figure 4 Apical and basal rotation during heart cycle. Ordinate, rotation in degrees;<br />
abscissa, time.<br />
Figure 5 Different types of left ventricular myocardial wall strains.<br />
systolic shortening fraction) and peak systolic SR. 23<br />
For timing of contraction the time to peak systolic<br />
strain and SR have been used (beginning of QRS<br />
complex to max peak of strain/SR curve, see figure 7).<br />
By defining the time of aortic valve closure it is<br />
also possible to determine if peak strain in certain<br />
regions occurs before or after the end of systole.<br />
This may be particularly important for the assessment<br />
of dyssynchrony. 24<br />
Such computations can be made for radial,<br />
circumferential, and longitudinal function, either<br />
for individual segments, a cut plane or the entire<br />
ventricle (using averaged values). Thus, strain and<br />
SR provide valuable information on both global and<br />
regional systolic and diastolic function and their<br />
timing.<br />
Basic <strong>principles</strong> of 2D <strong>speckle</strong> <strong>tracking</strong><br />
<strong>echocardiography</strong> (STE): key points<br />
< STE is a novel imaging modality that overcomes<br />
many of the limitations associated with tissue<br />
Doppler imaging.<br />
< STE allows easy assessment of segmental and<br />
global longitudinal, radial, and circumferential<br />
strain and strain rate as well as LV rotation,<br />
torsion, and dyssynchrony.<br />
< Reference values for all LV segments are already<br />
available.<br />
< STE is a valuable tool in evaluating LV systolic<br />
function and provides information on top of<br />
ejection fraction.<br />
< STE also proved useful to investigate LV<br />
diastolic dysfunction.<br />
< Application of STE is limited by image quality,<br />
out-of-plane motion of <strong>speckle</strong>s, lack of clear<br />
cut-off values for clinical decision making, and<br />
software issues (correct definition of ROI, intervendor<br />
comparability of values).<br />
How does 2D <strong>speckle</strong> <strong>tracking</strong> work?<br />
STE was introduced by Reisner, Leitman, Friedman,<br />
and Lysyansky in 2004. 25 26 It is performed as an<br />
offline analysis from digitally recorded and ECG<br />
triggered cine loops. The algorithm uses <strong>speckle</strong><br />
artefacts in the echo image which are generated at<br />
random due to reflections, refraction, and scattering<br />
of echo beams. Such <strong>speckle</strong>s in the LV wall are<br />
tracked throughout the cardiac cycle. Some of these<br />
<strong>speckle</strong>s stay stable during a part of the heart cycle<br />
and can be used as natural acoustic markers for<br />
tagging the myocardial motion during the cardiac<br />
cycle. The post-processing software defines<br />
a ‘cluster of <strong>speckle</strong>s’ (called a ‘kernel’) and follows<br />
this cluster frame to frame (figure 8). 1 Detection of<br />
spatial movement of this ‘fingerprint’ during the<br />
heart cycle now allows direct calculation of<br />
Langrangian strain. Tissue velocity is estimated<br />
from the shift of the individual <strong>speckle</strong>s divided by<br />
the time between successive frames. Strain rate can<br />
be calculated from tissue velocity as well (figure 2).<br />
Before strain analysis can be performed, it is essential<br />
to correctly track the endocardial and epicardial<br />
borders of the left ventricle, and thereby correctly<br />
define the region of interest (ROI) (figure 9).<br />
After definition of ROI in the long or short axis<br />
view, the post-processing software automatically<br />
divides the ventricle into six equally distributed<br />
718 Heart 2010;96:716e722. doi:10.1136/hrt.2007.141002