echocardiography: basic principles Two dimensional speckle tracking
echocardiography: basic principles Two dimensional speckle tracking
echocardiography: basic principles Two dimensional speckle tracking

Create successful ePaper yourself
Turn your PDF publications into a flip-book with our unique Google optimized e-Paper software.
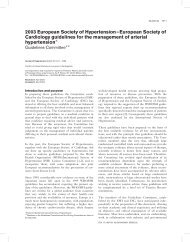
Figure 6 Shear strain. A, surface area; F, force; Δx, border shift; L, height; a, shear angle.<br />
segments. Several different approaches and<br />
varying degrees of user interaction are required<br />
depending on the scanner type and the echocardiographic<br />
view (parasternal vs apical). Endocardial<br />
<strong>tracking</strong> also allows computation of LV area<br />
changes during the cardiac cycle and can, thus,<br />
also be used to define end-systole and end-diastole.<br />
The raw data are filtered and mathematical algorithms<br />
are applied to generate values. Several<br />
different display formats have been used to represent<br />
the data both using strain and SR curves and<br />
graphical colour encoded displays. STE proved to be<br />
highly robust and reproducible. 27 Intra- as well as<br />
inter-observer variability between skilled echo<br />
examiners were negligible. 27 From a practical point it<br />
is essential to choose a sector width and transducer<br />
position which provides visibility of the apical and<br />
lateral segments, but which still guarantees frame<br />
rates above 30 Hz, ideally around 50 Hz.<br />
Speckle <strong>tracking</strong> versus tissue Doppler imaging<br />
and MRI<br />
STE has several important advantages compared to<br />
other modalities which are able to measure deformation.<br />
In contrast to MRI, STE is much more<br />
available, cost efficient, can be used ‘bedside’, and<br />
has a shorter procedure and post-processing time.<br />
In comparison to TDI, STE is insonation angle<br />
independent and does not require such high frame<br />
rates, is not subjected to the tethering effect, and<br />
allows straightforward measurement of radial and<br />
circumferential strain in addition to longitudinal<br />
strain. 2 The ‘tethering effect’ is a phenomenon<br />
encountered when TDI is used to assess strain. Scar<br />
tissue which is unable to contract is ‘dragged’ by<br />
adjacent viable myocardium during systole. Since<br />
TDI strain is calculated on the basis of tissue<br />
Table 1 Reference values for segmental longitudinal peak systolic strain<br />
LV segment<br />
(apical 4<br />
chamber view)<br />
Mean peak systolic<br />
longitudinal strain<br />
(%)±SD*<br />
Downloaded from<br />
heart.bmj.com on May 1, 2010 - Published by group.bmj.com<br />
Mean peak systolic<br />
longitudinal strain<br />
(%)±SDy<br />
LV segment<br />
(apical 2<br />
chamber view)<br />
velocities, this motion is falsely assigned with<br />
a negative strain value, and thus assumed to be<br />
actively contracting tissue. In STE, this effect does<br />
not occur as strain is directly calculated from the<br />
frame to frame motion of <strong>speckle</strong> patterns and not<br />
from myocardial velocities.<br />
Strain and systolic function<br />
While both strain and LV ejection fraction (LVEF)<br />
measure LV function, there is a fundamental<br />
difference between the two: strain calculates the<br />
contractility of the myocardium, while LVEF is<br />
a surrogate parameter that describes myocardial<br />
pump function. Even if contractility is reduced,<br />
compensatory mechanisms (ie, ventricular dilatation,<br />
geometry changes) can still assure that stroke<br />
volume remains normal (at least at rest). Thus, STE<br />
is especially suited for the assessment of global and<br />
regional systolic function in patients with heart<br />
failure and apparently normal ejection fraction<br />
(HFNEF). 28 Furthermore, regional dysfunction is<br />
not as apparent when using a global parameter<br />
such as LVEF. In addition, exact calculation of LVEF<br />
requires good image quality, operator experience,<br />
and has a large error of measurement. LVEF is also<br />
much more load dependent than strain. 29 Hooke’s<br />
law 30 summarises the relationship between the<br />
forces contributing to tissue deformation:<br />
Passive wall stress ðtÞ<br />
contractile forceðtÞ ¼ elasticity 3 deformationðtÞ According to this law, passive wall stress and<br />
elasticity both interfere with direct translation of<br />
segmental contractile force into deformation<br />
(strain). Passive wall stress is influenced by LV<br />
loading conditions (LV pressure), ventricle geometry,<br />
and segment to segment interaction, whereas<br />
elasticity is defined by tissue properties.<br />
In summary, strain could be an important<br />
parameter for LV function which can display<br />
cardiac dysfunction on a more fundamental level in<br />
an early stage of disease.<br />
STE longitudinal strain and EF correlate well in<br />
healthy individuals; however, in ST elevation<br />
myocardial infarction survivors and heart failure<br />
patients, for example, the correlation is less strong.<br />
Mean peak systolic<br />
longitudinal strain<br />
(%)±SD*<br />
LV segment (apical<br />
3 chamber view)<br />
Education in Heart<br />
Mean peak<br />
systolic longitudinal<br />
strain (%)±SD*<br />
Basal septal 13.764.0 1764 Basal anterior 20.164.0 Basal anteroseptal 18.363.5<br />
Mid septal 18.763.0 1964 Mid anterior 18.863.4 Mid anteroseptal 19.463.2<br />
Apical septal 22.364.8 2366 Apical anterior 19.465.4 Apical anteroseptal 18.865.9<br />
Apical lateral 19.265.4 2167 Apical inferior 22.564.5 Apical posterior 17.766.0<br />
Mid lateral 18.163.5 1966 Mid inferior 20.463.5 Mid posterior 16.865.0<br />
Basal lateral 17.865.0 1966 Basal inferior 17.163.9 Basal posterior 14.667.4<br />
*Mean left ventricular longitudinal peak systolic segmental strain values calculated from 242 healthy subjects aged 51612 years (between 18 and 80 years) by Marwick et al. 19 Scanner: Vivid<br />
7, GE Medical Systems, Horten, Norway. Software: EchoPAC PC, version 6.0.0, GE Healthcare, Chalfont St Giles, UK.<br />
yMean left ventricular longitudinal peak systolic segmental strain values calculated from 60 healthy subjects aged 39615 years by Hurlburt et al. 15 Scanner: Vivid 7, GE Medical Systems,<br />
Milwaukee, Wisconsin, USA. Software: EchoPac Advanced Analysis Technologies, GE Medical Systems.<br />
LV, left ventricular.<br />
Heart 2010;96:716e722. doi:10.1136/hrt.2007.141002 719