Asset Pricing John H. Cochrane June 12, 2000
Asset Pricing John H. Cochrane June 12, 2000
Asset Pricing John H. Cochrane June 12, 2000

You also want an ePaper? Increase the reach of your titles
YUMPU automatically turns print PDFs into web optimized ePapers that Google loves.
<strong>Asset</strong> <strong>Pricing</strong><br />
<strong>John</strong> H. <strong>Cochrane</strong><br />
<strong>June</strong> <strong>12</strong>, <strong>2000</strong><br />
1
Acknowledgments<br />
This book owes an enormous intellectual debt to Lars Hansen and Gene Fama. Most of the<br />
ideas in the book developed from long discussions with each of them, and trying to make<br />
sense of what each was saying in the language of the other. I am also grateful to all my colleagues<br />
in Finance and Economics at the University of Chicago, and to George Constantinides<br />
especially, for many discussions about the ideas in this book. I thank George Constantinides,<br />
Andrea Eisfeldt, Gene Fama, Wayne Ferson, Owen Lamont, Anthony Lynch, Dan Nelson,<br />
Alberto Pozzolo, Michael Roberts, Juha Seppala, Mike Stutzer, Pietro Veronesi, an anonymous<br />
reviewer, and several generations of Ph.D. students at the University of Chicago for<br />
many useful comments. I thank the NSF and the Graduate School of Business for research<br />
support.<br />
Additional material and both substantive and typographical corrections will be maintained<br />
at<br />
http://www-gsb.uchicago.edu/fac/john.cochrane/research/papers<br />
Comments and suggestions are most welcome This book draft is copyright c° <strong>John</strong> H.<br />
<strong>Cochrane</strong> 1997, 1998, 1999, <strong>2000</strong><br />
<strong>John</strong> H. <strong>Cochrane</strong><br />
Graduate School of Business<br />
University of Chicago<br />
1101 E. 58th St.<br />
Chicago IL 60637<br />
773 702 3059<br />
john.cochrane@gsb.uchicago.edu<br />
<strong>June</strong> <strong>12</strong>, <strong>2000</strong><br />
2
Contents<br />
Acknowledgments 2<br />
Preface 8<br />
Part I. <strong>Asset</strong> pricing theory <strong>12</strong><br />
1 Consumption-based model and overview 13<br />
1.1 Basic pricing equation 14<br />
1.2 Marginal rate of substitution/stochastic discount factor 16<br />
1.3 Prices, payoffs and notation 17<br />
1.4 Classic issues in finance 20<br />
1.5 Discount factors in continuous time 33<br />
1.6 Problems 38<br />
2 Applying the basic model 41<br />
2.1 Assumptions and applicability 41<br />
2.2 General Equilibrium 43<br />
2.3 Consumption-based model in practice 47<br />
2.4 Alternative asset pricing models: Overview 49<br />
2.5 Problems 51<br />
3 Contingent Claims Markets 54<br />
3.1 Contingent claims 54<br />
3.2 Risk neutral probabilities 55<br />
3.3 Investors again 57<br />
3.4 Risk sharing 59<br />
3.5 State diagram and price function 60<br />
4 The discount factor 64<br />
4.1 Law of one price and existence of a discount factor 64<br />
4.2 No-Arbitrage and positive discount factors 69<br />
3
4.3 An alternative formula, and x∗ in continuous time 74<br />
4.4 Problems 76<br />
5 Mean-variance frontier and beta representations 77<br />
5.1 Expected return - Beta representations 77<br />
5.2 Mean-variance frontier: Intuition and Lagrangian characterization 80<br />
5.3 An orthogonal characterization of the mean-variance frontier 83<br />
5.4 Spanning the mean-variance frontier 88<br />
5.5 A compilation of properties of R∗ ,Re∗ and x∗ 89<br />
5.6 Mean-variance frontiers for m: the Hansen-Jagannathan bounds 92<br />
5.7 Problems 97<br />
6 Relation between discount factors, betas, and mean-variance frontiers 98<br />
6.1 From discount factors to beta representations 98<br />
6.2 From mean-variance frontier to a discount factor and beta representation 101<br />
6.3 Factor models and discount factors 104<br />
6.4 Discount factors and beta models to mean - variance frontier 108<br />
6.5 Three riskfree rate analogues 109<br />
6.6 Mean-variance special cases with no riskfree rate 115<br />
6.7 Problems 118<br />
7 Implications of existence and equivalence theorems <strong>12</strong>0<br />
8 Conditioning information <strong>12</strong>8<br />
8.1 Scaled payoffs <strong>12</strong>9<br />
8.2 Sufficiency of adding scaled returns 131<br />
8.3 Conditional and unconditional models 133<br />
8.4 Scaled factors: a partial solution 140<br />
8.5 Summary 141<br />
8.6 Problems 142<br />
9 Factor pricing models 143<br />
9.1 Capital <strong>Asset</strong> <strong>Pricing</strong> Model (CAPM) 145<br />
4
9.2 Intertemporal Capital <strong>Asset</strong> <strong>Pricing</strong> Model (ICAPM) 156<br />
9.3 Comments on the CAPM and ICAPM 158<br />
9.4 Arbitrage <strong>Pricing</strong> Theory (APT) 162<br />
9.5 APT vs. ICAPM 171<br />
9.6 Problems 172<br />
Part II. Estimating and evaluating asset pricing models 174<br />
10 GMM in explicit discount factor models 177<br />
10.1 The Recipe 177<br />
10.2 Interpreting the GMM procedure 180<br />
10.3 Applying GMM 184<br />
11 GMM: general formulas and applications 188<br />
11.1 General GMM formulas 188<br />
11.2 Testing moments 192<br />
11.3 Standard errors of anything by delta method 193<br />
11.4 Using GMM for regressions 194<br />
11.5 Prespecified weighting matrices and moment conditions 196<br />
11.6 Estimating on one group of moments, testing on another. 205<br />
11.7 Estimating the spectral density matrix 205<br />
11.8 Problems 2<strong>12</strong><br />
<strong>12</strong> Regression-based tests of linear factor models 214<br />
<strong>12</strong>.1 Time-series regressions 214<br />
<strong>12</strong>.2 Cross-sectional regressions 219<br />
<strong>12</strong>.3 Fama-MacBeth Procedure 228<br />
<strong>12</strong>.4 Problems 234<br />
13 GMM for linear factor models in discount factor form 235<br />
13.1 GMM on the pricing errors gives a cross-sectional regression 235<br />
13.2 The case of excess returns 237<br />
13.3 Horse Races 239<br />
5
13.4 Testing for characteristics 240<br />
13.5 Testing for priced factors: lambdas or b’s? 241<br />
13.6 Problems 245<br />
14 Maximum likelihood 247<br />
14.1 Maximum likelihood 247<br />
14.2 ML is GMM on the scores 249<br />
14.3 When factors are returns, ML prescribes a time-series regression 251<br />
14.4 When factors are not excess returns, ML prescribes a cross-sectional<br />
regression 255<br />
14.5 Problems 256<br />
15 Time series, cross-section, and GMM/DF tests of linear factor models 258<br />
15.1 Three approaches to the CAPM in size portfolios 259<br />
15.2 Monte Carlo and Bootstrap 265<br />
16 Which method? 271<br />
Part III. Bonds and options 284<br />
17 Option pricing 286<br />
17.1 Background 286<br />
17.2 Black-Scholes formula 293<br />
17.3 Problems 299<br />
18 Option pricing without perfect replication 300<br />
18.1 On the edges of arbitrage 300<br />
18.2 One-period good deal bounds 301<br />
18.3 Multiple periods and continuous time 309<br />
18.4 Extensions, other approaches, and bibliography 317<br />
18.5 Problems 319<br />
19 Term structure of interest rates 320<br />
19.1 Definitions and notation 320<br />
6
19.2 Yield curve and expectations hypothesis 325<br />
19.3 Term structure models – a discrete-time introduction 327<br />
19.4 Continuous time term structure models 332<br />
19.5 Three linear term structure models 337<br />
19.6 Bibliography and comments 348<br />
19.7 Problems 351<br />
Part IV. Empirical survey 352<br />
20 Expected returns in the time-series and cross-section 354<br />
20.1 Time-series predictability 356<br />
20.2 The Cross-section: CAPM and Multifactor Models 396<br />
20.3 Summary and interpretation 409<br />
20.4 Problems 413<br />
21 Equity premium puzzle and consumption-based models 414<br />
21.1 Equity premium puzzles 414<br />
21.2 New models 423<br />
21.3 Bibliography 437<br />
21.4 Problems 440<br />
22 References 442<br />
Part V. Appendix 455<br />
23 Continuous time 456<br />
23.1 Brownian Motion 456<br />
23.2 Diffusion model 457<br />
23.3 Ito’s lemma 460<br />
23.4 Problems 462<br />
7
Preface<br />
<strong>Asset</strong> pricing theory tries to understand the prices or values of claims to uncertain payments.<br />
A low price implies a high rate of return, so one can also think of the theory as explaining<br />
why some assets pay higher average returns than others.<br />
To value an asset, we have to account for the delay and for the risk of its payments. The<br />
effects of time are not too difficult to work out. However, corrections for risk are much<br />
more important determinants of an many assets’ values. For example, over the last 50 years<br />
U.S. stocks have given a real return of about 9% on average. Of this, only about 1% is due<br />
to interest rates; the remaining 8% is a premium earned for holding risk. Uncertainty, or<br />
corrections for risk make asset pricing interesting and challenging.<br />
<strong>Asset</strong> pricing theory shares the positive vs. normative tension present in the rest of economics.<br />
Does it describe the way the world does work or the way the world should work?<br />
We observe the prices or returns of many assets. We can use the theory positively, to try to<br />
understand why prices or returns are what they are. If the world does not obey a model’s predictions,<br />
we can decide that the model needs improvement. However, we can also decide that<br />
the world is wrong, that some assets are “mis-priced” and present trading opportunities for<br />
the shrewd investor. This latter use of asset pricing theory accounts for much of its popularity<br />
and practical application. Also, and perhaps most importantly, the prices of many assets<br />
or claims to uncertain cash flows are not observed, such as potential public or private investment<br />
projects, new financial securities, buyout prospects, and complex derivatives. We can<br />
apply the theory to establish what the prices of these claims should be as well; the answers<br />
are important guides to public and private decisions.<br />
<strong>Asset</strong> pricing theory all stems from one simple concept, derived in the first page of the<br />
first Chapter of this book: price equals expected discounted payoff. The rest is elaboration,<br />
special cases, and a closet full of tricks that make the central equation useful for one or<br />
another application.<br />
There are two polar approaches to this elaboration. I will call them absolute pricing and<br />
relative pricing. Inabsolute pricing, we price each asset by reference to its exposure to fundamental<br />
sources of macroeconomic risk. The consumption-based and general equilibrium<br />
models described below are the purest examples of this approach. The absolute approach is<br />
most common in academic settings, in which we use asset pricing theory positively to give<br />
an economic explanation for why prices are what they are, or in order to predict how prices<br />
might change if policy or economic structure changed.<br />
In relative pricing, we ask a less ambitious question. We ask what we can learn about an<br />
asset’s value given the prices of some other assets. We do not ask where the price of the other<br />
set of assets came from, and we use as little information about fundamental risk factors as<br />
possible. Black-Scholes option pricing is the classic example of this approach. While limited<br />
in scope, this approach offers precision in many applications.<br />
8
<strong>Asset</strong> pricing problems are solved by judiciously choosing how much absolute and how<br />
much relative pricing one will do, depending on the assets in question and the purpose of the<br />
calculation. Almost no problems are solved by the pure extremes. For example, the CAPM<br />
and its successor factor models are paradigms of the absolute approach. Yet in applications,<br />
they price assets “relative” to the market or other risk factors, without answering what determines<br />
the market or factor risk premia and betas. The latter are treated as free parameters.<br />
On the other end of the spectrum, most practical financial engineering questions involve assumptions<br />
beyond pure lack of arbitrage, assumptions about equilibrium “market prices of<br />
risk.”<br />
The central and unfinished task of absolute asset pricing is to understand and measure the<br />
sources of aggregate or macroeconomic risk that drive asset prices. Of course, this is also the<br />
central question of macroeconomics, and this is a particularly exciting time for researchers<br />
who want to answer these fundamental questions in macroeconomics and finance. A lot of<br />
empirical work has documented tantalizing stylized facts and links between macroeconomics<br />
and finance. For example, expected returns vary across time and across assets in ways that<br />
are linked to macroeconomic variables, or variables that also forecast macroeconomic events;<br />
a wide class of models suggests that a “recession” or “financial distress” factor lies behind<br />
many asset prices. Yet theory lags behind; we do not yet have a well-described model that<br />
explains these interesting correlations.<br />
In turn, I think that what we are learning about finance must feed back on macroeconomics.<br />
To take a simple example, we have learned that the risk premium on stocks – the<br />
expected stock return less interest rates – is much larger than the interest rate, and varies a<br />
good deal more than interest rates. This means that attempts to line investment up with interest<br />
rates are pretty hopeless – most variation in the cost of capital comes from the varying risk<br />
premium. Similarly, we have learned that some measure of risk aversion must be quite high,<br />
or people would all borrow like crazy to buy stocks. Most macroeconomics pursues small<br />
deviations about perfect foresight equilibria, but the large equity premium means that volatility<br />
is a first-order effect, not a second-order effect. Standard macroeconomic models predict<br />
that people really don’t care much about business cycles (Lucas 1987). <strong>Asset</strong> prices are beginningtorevealthattheydo–thattheyforegosubstantialreturnpremiatoavoidassetsthat<br />
fall in recessions. This fact ought to tell us something about recessions!<br />
This book advocates a discount factor / generalized method of moments view of asset<br />
pricing theory and associated empirical procedures. I summarize asset pricing by two equations:<br />
pt = E(mt+1xt+1)<br />
mt+1 = f(data, parameters).<br />
where pt = asset price, xt+1 = asset payoff, mt+1 = stochastic discount factor.<br />
9
The major advantage of the discount factor / moment condition approach are its simplicity<br />
and universality. Where once there were three apparently different theories for stocks, bonds,<br />
and options, now we see each as just special cases of the same theory. The common language<br />
also allows us to use insights from each field of application in other fields.<br />
This approach also allows us to conveniently separate the step of specifying economic<br />
assumptions of the model (second equation) from the step of deciding which kind of empirical<br />
representation to pursue or understand. For a given model – choice of f(·) – we will see<br />
how the first equation can lead to predictions stated in terms of returns, price-dividend ratios,<br />
expected return-beta representations, moment conditions, continuous vs. discrete time<br />
implications and so forth. The ability to translate between such representations is also very<br />
helpful in digesting the results of empirical work, which uses a number of apparently distinct<br />
but fundamentally connected representations.<br />
Thinking in terms of discount factors often turns out to be much simpler than thinking in<br />
terms of portfolios. For example, it is easier to insist that there is a positive discount factor<br />
than to check that every possible portfolio that dominates every other portfolio has a larger<br />
price, and the long arguments over the APT stated in terms of portfolios are easy to digest<br />
when stated in terms of discount factors.<br />
The discount factor approach is also associated with a state-space geometry in place of<br />
the usual mean-variance geometry, and this book emphasizes the state-space intuition behind<br />
many classic results.<br />
For these reasons, the discount factor language and the associated state-space geometry<br />
is common in academic research and high-tech practice. It is not yet common in textbooks,<br />
and that is the niche that this book tries to fill.<br />
I also diverge from the usual order of presentation. Most books are structured following<br />
the history of thought: portfolio theory, mean-variance frontiers, spanning theorems,<br />
CAPM,ICAPM,APT,optionpricing,andfinally consumption-based model. Contingent<br />
claims are an esoteric extension of option-pricing theory. I go the other way around: contingent<br />
claims and the consumption-based model are the basic and simplest models around;<br />
the others are specializations. Just because they were discovered in the opposite order is no<br />
reason to present them that way.<br />
I also try to unify the treatment of empirical methods. A wide variety of methods are popular,<br />
including time-series and cross-sectional regressions, and methods based on generalized<br />
method of moments (GMM) and maximum likelihood. However, in the end all of these apparently<br />
different approaches do the same thing: they pick free parameters of the model to<br />
make it fit best, which usually means to minimize pricing errors; and they evaluate the model<br />
by examining how big those pricing errors are.<br />
As with the theory, I do not attempt an encyclopedic compilation of empirical procedures.<br />
The literature on econometric methods contains lots of methods and special cases (likelihood<br />
ratio analogues of common Wald tests; cases with and without riskfree assets and when<br />
factors do and don’t span the mean variance frontier, etc.) that are seldom used in practice. I<br />
10
try to focus on the basic ideas and on methods that are actually used in practice.<br />
The accent in this book is on understanding statements of theory, and working with that<br />
theory to applications, rather than rigorous or general proofs. Also, I skip very lightly over<br />
many parts of asset pricing theory that have faded from current applications, although they<br />
occupied large amounts of the attention in the past. Some examples are portfolio separation<br />
theorems, properties of various distributions, or asymptotic APT. While portfolio theory is<br />
still interesting and useful, it is no longer a cornerstone of pricing. Rather than use portfolio<br />
theory to find a demand curve for assets, which intersected with a supply curve gives prices,<br />
we now go to prices directly. One can then find optimal portfolios, but it is a side issue for<br />
the asset pricing question.<br />
My presentation is consciously informal. I like to see an idea in its simplest form and<br />
learn to use it before going back and understanding all the foundations of the ideas. I have organized<br />
the book for similarly minded readers. If you are hungry for more formal definitions<br />
and background, keep going, they usually show up later on in the chapter.<br />
Again, my organizing principle is that everything can be traced back to specializations of<br />
the basic pricing equation p = E(mx). Therefore, after reading the first chapter, one can<br />
pretty much skip around and read topics in as much depth or order as one likes. Each major<br />
subject always starts back at the same pricing equation.<br />
The target audience for this book is economics and finance Ph.D. students, advanced MBA<br />
students or professionals with similar background. I hope the book will also be useful to<br />
fellow researchers and finance professionals, by clarifying, relating and simplifying the set of<br />
tools we have all learned in a hodgepodge manner. I presume some exposure to undergraduate<br />
economics and statistics. A reader should have seen a utility function, a random variable, a<br />
standard error and a time series, should have some basic linear algebra and calculus and<br />
should have solved a maximum problem by setting derivatives to zero. The hurdles in asset<br />
pricing are really conceptual rather than mathematical.<br />
11
PART I<br />
<strong>Asset</strong> pricing theory<br />
<strong>12</strong>
Chapter 1. Consumption-based model<br />
and overview<br />
I start by thinking of an investor who thinks about how much to save and consume, and<br />
what portfolio of assets to hold. The most basic pricing equation comes from the first-order<br />
conditions to that problem, and say that price should be the expected discounted payoff, using<br />
the investor’s marginal utility to discount the payoff. The marginal utility loss of consuming<br />
a little less today and investing the result should equal the marginal utility gain of selling the<br />
investment at some point in the future and eating the proceeds. If the price does not satisfy<br />
this relation, the investor should buy more of the asset.<br />
From this simple idea, I can discuss the classic issues in finance. The interest rate is<br />
related to the average future marginal utility, and hence to the expected path of consumption.<br />
High real interest rates should be associated with an expectation of growing consumption. In<br />
a time of high real interest rates, it makes sense to save, buy bonds, and then consume more<br />
tomorrow.<br />
Most importantly, risk corrections to asset prices should be driven by the covariance of<br />
asset payoffs with consumption or marginal utility. For a given expected payoff of an asset,<br />
an asset that does badly in states like a recession, in which the investor feels poor and is<br />
consuming little, is less desirable than an asset that does badly in states of nature like a boom<br />
when the investor feels wealthy and is consuming a great deal. The former assets will sell for<br />
lower prices; their prices will reflect a discount for their riskiness, and this riskiness depends<br />
on a co-variance. This is the fundamental point of the whole book.<br />
Of course, the fundamental measure of how you feel is marginal utility; given that assets<br />
must pay off well in some states and poorly in others, you want assets that pay off poorly in<br />
states of low marginal utility, when an extra dollar doesn’t really seem all that important, and<br />
you’d rather that they pay off well in states of high marginal utility, when you’re hungry and<br />
really anxious to have an extra dollar. Most of the book is about how to go from marginal<br />
utility to observable indicators. Consumption is low when marginal utility is high, of course,<br />
so consumption may be a useful indicator. Consumption is also low and marginal utility is<br />
high when the investor’s other assets have done poorly; thus we may expect that prices are<br />
13
CHAPTER 1 CONSUMPTION-BASED MODEL AND OVERVIEW<br />
low for assets that covary positively with a large index such as the market portfolio. This<br />
is the Capital <strong>Asset</strong> <strong>Pricing</strong> Model. The rest of the book comes down to useful indicators<br />
for marginal utility, things against which to compute a covariance in order to predict the<br />
risk-adjustment for prices.<br />
1.1 Basic pricing equation<br />
An investor’s first order conditions give the basic consumption-based model,<br />
¸<br />
.<br />
pt = Et<br />
·<br />
β u0 (ct+1)<br />
u 0 (ct) xt+1<br />
Our basic objective is to figure out the value of any stream of uncertain cash flows. I start<br />
with an apparently simple case, which turns out to capture very general situations.<br />
Let us find the value at time t of a payoff xt+1. For example, if one buys a stock today,<br />
the payoff next period is the stock price plus dividend, xt+1 = pt+1 +dt+1. xt+1 is a random<br />
variable: an investor does not know exactly how much he will get from his investment, but he<br />
can assess the probability of various possible outcomes. Don’t confuse the payoff xt+1 with<br />
the profit or return; xt+1 is the value of the investment at time t +1, without subtracting or<br />
dividing by the cost of the investment.<br />
We find the value of this payoff by asking what it is worth to a typical investor. To do this,<br />
we need a convenient mathematical formalism to capture what an investor wants. We model<br />
investors by a utility function defined over current and future values of consumption,<br />
U(ct,ct+1) =u(ct)+βEt [u(ct+1)] ,<br />
where ct denotes consumption at date t. We will often use a convenient power utility form,<br />
u(ct) = 1<br />
1 − γ c1−γ t .<br />
The limit as γ → 1 is<br />
u(c) =ln(c).<br />
The utility function captures the fundamental desire for more consumption, rather than<br />
posit a desire for intermediate objectives such as means and variance of portfolio returns.<br />
Consumption ct+1 is also random; the investor does not know his wealth tomorrow, and<br />
hence how much he will decide to consume. The period utility function u(·) is increasing,<br />
reflecting a desire for more consumption, and concave, reflecting the declining marginal value<br />
of additional consumption. The last bite is never as satisfying as the first.<br />
14
SECTION 1.1 BASIC PRICING EQUATION<br />
This formalism captures investors’ impatience and their aversion to risk, so we can quantitatively<br />
correct for the risk and delay of cash flows. Discounting the future by β captures<br />
impatience, and β is called the subjective discount factor. The curvature of the utility function<br />
also generates aversion to risk and to intertemporal substitution: The consumer prefers a<br />
consumption stream that is steady over time and across states of nature.<br />
Now, assume that the investor can freely buy or sell as much of the payoff xt+1 as he<br />
wishes, at a price pt. How much will he buy or sell? To find the answer, denote by e the<br />
original consumption level (if the investor bought none of the asset), and denote by ξ the<br />
amount of the asset he chooses to buy. Then, his problem is,<br />
max<br />
{ξ} u(ct)+Etβu(ct+1) s.t.<br />
ct = et − ptξ<br />
ct+1 = et+1 + xt+1ξ<br />
Substituting the constraints into the objective, and setting the derivative with respect to ξ<br />
equal to zero, we obtain the first-order condition for an optimal consumption and portfolio<br />
choice,<br />
ptu 0 (ct) =Et [βu 0 (ct+1)xt+1] (1)<br />
or,<br />
·<br />
pt = Et β u0 (ct+1)<br />
u0 (ct) xt+1<br />
¸<br />
. (2)<br />
The investor buys more or less of the asset until this first order condition holds.<br />
Equation (1.1) expresses the standard marginal condition for an optimum: ptu 0 (ct) is<br />
the loss in utility if the investor buys another unit of the asset; Et [βu 0 (ct+1)xt+1] is the<br />
increase in (discounted, expected) utility he obtains from the extra payoff at t+1. The investor<br />
continues to buy or sell the asset until the marginal loss equals the marginal gain.<br />
Equation (1.2) is the central asset-pricing formula. Given the payoff xt+1 and given the<br />
investor’s consumption choice ct,ct+1, ittellsyouwhatmarketpricept to expect. Its economic<br />
content is simply the first order conditions for optimal consumption and portfolio formation.<br />
Most of the theory of asset pricing just consists of specializations and manipulations<br />
of this formula.<br />
Notice that we have stopped short of a complete solution to the model, i.e. an expression<br />
with exogenous items on the right hand side. We relate one endogenous variable, price,<br />
to two other endogenous variables, consumption and payoffs. One can continue to solve<br />
this model and derive the optimal consumption choice ct,ct+1 in terms of the givens of the<br />
model. In the model I have sketched so far, those givens are the income sequence et,et+1 and<br />
aspecification of the full set of assets that the investor may buy and sell. We will in fact study<br />
15
CHAPTER 1 CONSUMPTION-BASED MODEL AND OVERVIEW<br />
such fuller solutions below. However, for many purposes one can stop short of specifying<br />
(possibly wrongly) all this extra structure, and obtain very useful predictions about asset<br />
prices from (1.2), even though consumption is an endogenous variable.<br />
1.2 Marginal rate of substitution/stochastic discount factor<br />
We break up the basic consumption-based pricing equation into<br />
where mt+1 is the stochastic discount factor.<br />
p = E(mx)<br />
m = β u0 (ct+1)<br />
u 0 (ct)<br />
A convenient way to break up the basic pricing equation (1.2) is to define the stochastic<br />
discount factor mt+1<br />
mt+1 ≡ β u0 (ct+1)<br />
u 0 (ct)<br />
Then, the basic pricing formula (1.2) can simply be expressed as<br />
(3)<br />
pt = Et(mt+1xt+1). (4)<br />
When it isn’t necessary to be explicit about time subscripts or the difference between<br />
conditional and unconditional expectation, I’ll suppress the subscripts and just write p =<br />
E(mx). The price always comes at t, the payoff at t +1, and the expectation is conditional<br />
on time t information.<br />
The term stochastic discount factor refers to the way m generalizes standard discount<br />
factor ideas. If there is no uncertainty, we can express prices via the standard present value<br />
formula<br />
pt = 1<br />
xt+1<br />
(5)<br />
Rf where R f is the gross risk-free rate. 1/R f is the discount factor. Since gross interest rates<br />
are typically greater than one, the payoff xt+1 sells “at a discount.” Riskier assets have<br />
lower prices than equivalent risk-free assets, so they are often valued by using risk-adjusted<br />
16
discount factors,<br />
SECTION 1.3 PRICES, PAYOFFS AND NOTATION<br />
p i t = 1<br />
R i Et(x i t+1).<br />
Here, I have added the i superscript to emphasize that each risky asset i must be discounted<br />
by an asset-specific risk-adjusted discount factor 1/Ri .<br />
In this context, equation (1.4) is obviously a generalization, and it says something deep:<br />
one can incorporate all risk-corrections by defining a single stochastic discount factor – the<br />
same one for each asset – and putting it inside the expectation. mt+1 is stochastic or random<br />
because it is not known with certainty at time t. As we will see, the correlation between the<br />
random components of m and xi generate asset-specific risk corrections.<br />
mt+1 is also often called the marginal rate of substitution after (1.3). In that equation,<br />
mt+1 is the rate at which the investor is willing to substitute consumption at time t +1for<br />
consumption at time t. mt+1is sometimes also called the pricing kernel. If you know what a<br />
kernel is and express the expectation as an integral, you can see where the name comes from.<br />
It is sometimes called a change of measure or a state-price density for reasons that we will<br />
see below.<br />
For the moment, introducing the discount factor m and breaking the basic pricing equation<br />
(1.2) into (1.3) and (1.4) is just a notational convenience. As we will see, however, it<br />
represents a much deeper and more useful separation. For example, notice that p = E(mx)<br />
would still be valid if we changed the utility function, but we would have a different function<br />
connecting m to data. As we will see, all asset pricing models amount to alternative<br />
models connecting the stochastic discount factor to data, while p = E(mx) is a convenient<br />
accounting identity with almost no content. At the same time, we will study lots of alternative<br />
expressions of p = E(mx), and we can summarize many empirical approaches to<br />
p = E(mx). By separating our models into these two components, we don’t have to redo all<br />
that elaboration for each asset pricing model.<br />
1.3 Prices, payoffs and notation<br />
The price pt givesrightstoapayoff xt+1. In practice, this notation covers a variety of<br />
cases, including the following:<br />
17
CHAPTER 1 CONSUMPTION-BASED MODEL AND OVERVIEW<br />
Price pt Payoff xt+1<br />
Stock pt pt+1 + dt+1<br />
Return<br />
Price-dividend ratio<br />
1<br />
pt<br />
dt<br />
Rt+1 ³<br />
pt+1<br />
dt+1 +1<br />
Excess return 0<br />
´<br />
dt+1<br />
dt<br />
Re t+1 = Ra t+1 − Rb Managed portfolio zt<br />
t+1<br />
ztRt+1<br />
Moment condition E(ptzt) xt+1zt<br />
One-period bond<br />
Risk free rate<br />
pt<br />
1<br />
1<br />
Rf Option C max(ST − K, 0)<br />
The price pt and payoff xt+1 seem like a very restrictive kind of security. In fact, this<br />
notation is quite general and allows us easily to accommodate many different asset pricing<br />
questions. In particular, we can cover stocks, bonds and options and make clear that there is<br />
one theory for all asset pricing.<br />
For stocks, the one period payoff is of course the next price plus dividend, xt+1 = pt+1 +<br />
dt+1. We frequently divide the payoff xt+1 by the price pt to obtain a gross return<br />
Rt+1 ≡ xt+1<br />
We can think of a return as a payoff with price one. If you pay one dollar today, the return is<br />
how many dollars or units of consumption you get tomorrow. Thus, returns obey<br />
pt<br />
1=E(mR)<br />
which is by far the most important special case of the basic formula p = E(mx). I use capital<br />
letters to denote gross returns R, which have a numerical value like 1.05. I use lowercase<br />
letters to denote net returns r = R−1 or log (continuously compounded) returns ln(R), both<br />
of which have numerical values like 0.05. One may also quote percent returns 100 × r.<br />
Returns are often used in empirical work because they are typically stationary over time.<br />
(Stationary in the statistical sense; they don’t have trends and you can meaningfully take an<br />
average. “Stationary” does not mean constant.) However, thinking in terms of returns takes<br />
us away from the central task of finding asset prices. Dividing by dividends and creating a<br />
payoff<br />
xt+1 =<br />
µ<br />
1+ pt+1<br />
<br />
dt+1<br />
dt+1 dt<br />
corresponding to a price pt/dt is a way to look at prices but still to examine stationary variables.<br />
Not everything can be reduced to a return. If you borrow a dollar at the interest rate Rf andinvestitinanassetwithreturnR, you pay no money out-of-pocket today, and get the<br />
18
SECTION 1.4 CLASSIC ISSUES IN FINANCE<br />
payoff R − Rf . This is a payoff with a zero price, so you obviously can’t divide payoff by<br />
price to get a return. Zero price does not imply zero payoff. It is a bet in which the chance of<br />
losing exactly balances its chance of winning, so that it is not worth paying extra to take the<br />
bet. It is common to study equity strategies in which one short sells one stock or portfolio and<br />
invests the proceeds in another stock or portfolio, generating an excess return. I denote any<br />
such difference between returns as an excess return, Re . It is also called a zero-cost portfolio<br />
or a self-financing portfolio.<br />
In fact, much asset pricing focuses on excess returns. Our economic understanding of<br />
interest rate variation turns out to have little to do with our understanding of risk premia, so<br />
it is convenient to separate the two exercises by looking at interest rates and excess returns<br />
separately.<br />
We also want to think about the managed portfolios, in which one invests more or less<br />
in an asset according to some signal. The “price” of such a strategy is the amount invested<br />
at time t, sayzt, and the payoff is ztRt+1. For example a market timing strategy might put<br />
a weight in stocks proportional to the price-dividend ratio, investing less when prices are<br />
higher. We could represent such a strategy as a payoff using zt = a − b(pt/dt).<br />
When we think about conditioning information below, we will think of objects like zt as<br />
instruments. Then we take an unconditional expectation of ptzt = Et(mt+1xt+1)zt, yielding<br />
E(ptzt) =E(mt+1xt+1zt). We can think of this operation as creating a “security” with<br />
payoff xt+1zt+1, and “price” E(ptzt) represented with unconditional expectations.<br />
A one period bond is of course a claim to a unit payoff. Bonds, options, investment<br />
projects are all examples in which it is often more useful to think of prices and payoffs rather<br />
than returns.<br />
Prices and returns can be real (denominated in goods) or nominal (denominated in dollars);<br />
p = E(mx) can refer to either case. The only difference is whether we use a real or<br />
nominal discount factor. If prices, returns and payoffs are nominal, we should use a nominal<br />
discount factor. For example, if p and x denote nominal values, then we can create real<br />
prices and payoffs to write<br />
pt<br />
= Et<br />
Πt<br />
·µ<br />
β u0 (ct+1)<br />
u 0 (ct)<br />
xt+1<br />
Πt+1<br />
where Π denotes the price level (cpi). Obviously, this is the same as defining a nominal<br />
discount factor by<br />
pt = Et<br />
·µ<br />
β u0 (ct+1)<br />
u0 (ct)<br />
Πt<br />
Πt+1<br />
<br />
¸<br />
xt+1<br />
To accommodate all these cases, I will simply use the notation price pt and payoff xt+1.<br />
These symbols can denote 0, 1, or zt and R e t ,rt+1, orztRt+1 respectively, according to the<br />
case. Lots of other definitions of p and x are useful as well.<br />
19<br />
¸
CHAPTER 1 CONSUMPTION-BASED MODEL AND OVERVIEW<br />
1.4 Classic issues in finance<br />
I use simple manipulations of the basic pricing equation to introduce classic issues in finance:<br />
the economics of interest rates, risk adjustments, systematic vs. idiosyncratic risk, expected<br />
return-beta representations, the mean-variance frontier, the slope of the mean-variance<br />
frontier, time-varying expected returns, and present value relations.<br />
A few simple rearrangements and manipulations of the basic pricing equation p = E(mx)<br />
give a lot of intuition and introduce some classic issues in finance, including determinants of<br />
the interest rate, risk corrections, idiosyncratic vs. systematic risk, beta pricing models, and<br />
mean variance frontiers.<br />
1.4.1 Risk free rate<br />
With lognormal consumption growth,<br />
R f =1/E(m).<br />
r f<br />
t = δ + γEt∆ ln ct+1 − γ2<br />
2 σ2 t (∆ ln ct+1)<br />
Real interest rates are high when people are impatient (δ), when expected consumption<br />
growth is high (intertemporal substitution), or when risk is low (precautionary saving). A<br />
more curved utility function (γ) or a lower elasticity of intertemporal substitution (1/γ)means<br />
that interest rates are more sensitive to changes in expected consumption growth.<br />
Theriskfreerateisgivenby<br />
R f =1/E(m). (6)<br />
The risk free rate is known ahead of time, so p = E(mx) becomes 1 = E(mRf ) =<br />
E(m)Rf .<br />
If a risk free security is not traded, we can define Rf =1/E(m) as the “shadow” risk-free<br />
rate. (In some models it is called the “zero-beta” rate.) If one introduced a risk free security<br />
with return Rf =1/E(m), investors would be just indifferent to buying or selling it. I use<br />
Rf to simplify formulas below with this understanding.<br />
To think about the economics behind real interest rates in a simple setup, use power utility<br />
20
SECTION 1.4 CLASSIC ISSUES IN FINANCE<br />
u 0 (c) =c −γ . Start by turning off uncertainty, in which case<br />
We can see three effects right away:<br />
R f = 1<br />
β<br />
µ ct+1<br />
ct<br />
γ<br />
.<br />
1. Real interest rates are high when people are impatient, when β is low. If everyone wants<br />
to consume now, it takes a high interest rate to convince them to save.<br />
2. Real interest rates are high when consumption growth is high. In times of high interest<br />
rates, it pays investors to consume less now, invest more, and consume more in the<br />
future. Thus, high interest rates lower the level of consumption today, while raising its<br />
growth rate from today to tomorrow.<br />
3. Real interest rates are more sensitive to consumption growth if the power parameter γ is<br />
large. If utility is highly curved, the investor cares more about maintaining a consumption<br />
profile that is smooth over time, and is less willing to rearrange consumption over time<br />
in response to interest rate incentives. Thus it takes a larger interest rate change to induce<br />
him to a given consumption growth.<br />
To understand how interest rates behave when there is some uncertainty, I specify that<br />
consumption growth is lognormally distributed. In this case, the real riskfree rate equation<br />
becomes<br />
r f<br />
t = δ + γEt∆ ln ct+1 − γ2<br />
2 σ2 t (∆ ln ct+1) (7)<br />
where I have definedthelogriskfreerater f<br />
t and subjective discount rate δ by<br />
and ∆ denotes the first difference operator,<br />
r f<br />
t =lnRf<br />
t ; β = e−δ ,<br />
∆ ln ct+1 =lnct+1 − ln ct.<br />
To derive expression (1.7) for the riskfree rate, start with<br />
Using the fact that normal z means<br />
R f<br />
t =1/Et<br />
"<br />
β<br />
µ ct+1<br />
ct<br />
#<br />
−γ<br />
.<br />
E (e z 1 E(z)+<br />
)=e 2 σ2 (z)<br />
21
CHAPTER 1 CONSUMPTION-BASED MODEL AND OVERVIEW<br />
(you can check this by writing out the integral that defines the expectation), we have<br />
R f<br />
·<br />
t = e −δ e −γEt(∆ ln ct+1)+ γ2<br />
2 σ2 ¸−1 t (∆ ln ct+1)<br />
.<br />
Then take logarithms. The combination of lognormal distributions and power utility is one of<br />
the basic tricks to getting analytical solutions in this kind of model. Section 1.5 shows how<br />
to get the same result in continuous time.<br />
Looking at (1.7), we see the same results as we had with the deterministic case. Real interest<br />
rates are high when impatience δ is high and when consumption growth is high; higher<br />
γ makes interest rates more sensitive to consumption growth. The new σ2 term captures precautionary<br />
savings. When consumption is more volatile, people with this utility function are<br />
more worried about the low consumption states than they are pleased by the high consumption<br />
states. Therefore, people want to save more, driving down interest rates.<br />
We can also read the same terms backwards: consumption growth is high when real<br />
interest rates are high, since people save more now and spend it in the future, and consumption<br />
is less sensitive to interest rates as the desire for a smooth consumption stream, captured by<br />
γ, rises. . Section 2.2 below takes up the question of which way we should read this equation<br />
– as consumption determining interest rates, or as interest rates determining consumption.<br />
For the power utility function, the curvature parameter γ simultaneously controls intertemporal<br />
substitution – aversion to a consumption stream that varies over time, risk aversion<br />
– aversion to a consumption stream that varies across states of nature, and precautionary<br />
savings, which turns out to depend on the third derivative of the utility function. This link is<br />
particular to the power utility function. We will study utility functions below that loosen the<br />
links between these three quantities.<br />
1.4.2 Risk corrections<br />
p = E(x)<br />
+ cov(m, x)<br />
Rf E(R i ) − R f = −R f cov ¡ m, R i¢ .<br />
Payoffs that are positively correlated with consumption growth have lower prices, to compensate<br />
investors for risk. Expected returns are proportional to the covariance of returns with<br />
discount factors.<br />
Using the definition of covariance cov(m, x) = E(mx) − E(m)E(x), we can write<br />
22
equation (1.2) as<br />
SECTION 1.4 CLASSIC ISSUES IN FINANCE<br />
Substituting the riskfree rate equation (1.6), we obtain<br />
p = E(m)E(x)+cov(m, x). (8)<br />
p = E(x)<br />
+ cov(m, x) (9)<br />
Rf The first term in (1.9) is the standard discounted present value formula. This is the asset’s<br />
price in a risk-neutral world – if consumption is constant or if utility is linear. The second<br />
term is a risk adjustment. An asset whose payoff covaries positively with the discount factor<br />
has its price raised and vice-versa.<br />
To understand the risk adjustment, substitute back for m in terms of consumption, to<br />
obtain<br />
p = E(x)<br />
Rf + cov [βu0 (ct+1),xt+1]<br />
u0 (10)<br />
(ct)<br />
Marginal utility u0 (c) declines as c rises. Thus, an asset’s price is lowered if its payoff covaries<br />
positively with consumption. Conversely, an asset’s price is raised if it covaries negatively<br />
with consumption.<br />
Why? Investors do not like uncertainty about consumption. If you buy an asset whose<br />
payoff covaries positively with consumption, one that pays off well when you are already<br />
feeling wealthy, and pays off badly when you are already feeling poor, that asset will make<br />
your consumption stream more volatile. You will require a low price to induce you to buy<br />
such an asset. If you buy an asset whose payoff covaries negatively with consumption, it<br />
helps to smooth consumption and so is more valuable than its expected payoff might indicate.<br />
Insurance is an extreme example. Insurance pays off exactly when wealth and consumption<br />
would otherwise be low–you get a check when your house burns down. For this reason, you<br />
are happy to hold insurance, even though you expect to lose money—even though the price<br />
of insurance is greater than its expected payoff discounted at the risk free rate.<br />
To emphasize why the covariance of a payoff with the discount factor rather than its<br />
variance determines its riskiness, keep in mind that the investor cares about the volatility of<br />
consumption. He does not care about the volatility of his individual assets or of his portfolio,<br />
if he can keep a steady consumption. Consider what happens to the volatility of consumption<br />
if the investor buys a little more ξ of payoff x:<br />
σ 2 (c) becomes σ 2 (c + ξx) =σ 2 (c)+2ξcov(c, x)+ξ 2 σ 2 (x)<br />
For small (marginal) portfolio changes, the covariance between consumption and payoff determines<br />
the effect of adding a bit more of each payoff on the volatility of consumption.<br />
We use returns so often that it is worth restating the same intuition for the special case that<br />
23
CHAPTER 1 CONSUMPTION-BASED MODEL AND OVERVIEW<br />
the price is one and the payoff is a return. Start with the basic pricing equation for returns,<br />
1=E(mR i ).<br />
I denote the return R i to emphasize that the point of the theory is to distinguish the behavior<br />
of one asset R i from another R j .<br />
The asset pricing model says that, although expected returns can vary across time and<br />
assets, expected discounted returns should always be the same, 1.<br />
Applying the covariance decomposition,<br />
and, using R f =1/E(m),<br />
or<br />
1=E(m)E(R i )+cov(m, R i ) (11)<br />
E(R i ) − R f = −R f cov(m, R i ) (<strong>12</strong>)<br />
E(R i ) − R f = − cov[u0 (ct+1),Ri t+1]<br />
E[u0 . (13)<br />
(ct+1)]<br />
All assets have an expected return equal to the risk-free rate, plus a risk adjustment. <strong>Asset</strong>s<br />
whose returns covary positively with consumption make consumption more volatile, and so<br />
must promise higher expected returns to induce investors to hold them. Conversely, assets<br />
that covary negatively with consumption, such as insurance, can offer expected rates of return<br />
that are lower than the risk-free rate, or even negative (net) expected returns.<br />
Much of finance focuses on expected returns. We think of expected returns increasing<br />
or decreasing to clear markets; we offer intuition that “riskier” securities must offer higher<br />
expected returns to get investors to hold them, rather than saying “riskier” securities trade for<br />
lower prices so that investors will hold them. Of course, a low initial price for a given payoff<br />
corresponds to a high expected return, so this is no more than a different language for the<br />
same phenomenon.<br />
1.4.3 Idiosyncratic risk does not affect prices<br />
Only the component of a payoff perfectly correlated with the discount factor generates an<br />
extra return. Idiosyncratic risk, uncorrelated with the discount factor, generates no premium.<br />
You might think that an asset with a high payoff variance is “risky” and thus should have<br />
a large risk correction. However, if the payoff is uncorrelated with the discount factor m,the<br />
asset receives no risk-correction to its price, and pays an expected return equal to the risk-free<br />
24
ate! In equations, if<br />
then<br />
SECTION 1.4 CLASSIC ISSUES IN FINANCE<br />
cov(m, x) =0<br />
p = E(x)<br />
.<br />
Rf This prediction holds even if the payoff x is highly volatile and investors are highly risk<br />
averse. The reason is simple: if you buy a little bit more of such an asset, it has no first-order<br />
effect on the variance of your consumption stream.<br />
More generally, one gets no compensation or risk adjustment for holding idiosyncratic<br />
risk. Only systematic risk generates a risk correction. To give meaning to these words, we can<br />
decompose any payoff x into a part correlated with the discount factor and an idiosyncratic<br />
part uncorrelated with the discount factor by running a regression,<br />
x = proj(x|m)+ε.<br />
Then, the price of the residual or idiosyncratic risk ε is zero, and the price of x is the same<br />
as the price of its projection on m. The projection of x on m is of course that part of x<br />
which is perfectly correlated with m. Theidiosyncratic component of any payoff is that part<br />
uncorrelated with m. Thus only the systematic part of a payoff accounts for its price.<br />
Projection means linear regression without a constant,<br />
proj(x|m) = E(mx)<br />
E(m 2 ) m.<br />
You can verify that regression residuals are orthogonal to right hand variables E(mε) =0<br />
from this definition. E(mε) =0of course means that the price of ε is zero.<br />
µ<br />
E(mx)<br />
p (proj(x|m)) = p<br />
E(m2 ) m<br />
µ<br />
2 E(mx)<br />
= E m<br />
E(m2 <br />
= E(mx) =p(x).<br />
)<br />
The words “systematic” and “idiosyncratic” are defined differently in different contexts,<br />
which can lead to some confusion. In this decomposition, the residuals ε can be correlated<br />
with each other, though they are not correlated with the discount factor. The APT starts with<br />
a factor-analytic decomposition of the covariance of payoffs, and the word “idiosyncratic”<br />
there is reserved for the component of payoffs uncorrelated with all of the other payoffs.<br />
1.4.4 Expected return-beta representation<br />
25
CHAPTER 1 CONSUMPTION-BASED MODEL AND OVERVIEW<br />
We can write p = E(mx) as<br />
E(R i )=R f + β i,mλm<br />
We can express the expected return equation (1.<strong>12</strong>), for a return Ri ,as<br />
E(R i )=R f µ µ<br />
i cov(R ,m)<br />
+<br />
−<br />
var(m)<br />
var(m)<br />
<br />
E(m)<br />
or<br />
E(R i )=R f + β i,mλm<br />
where βim is the regression coefficient of the return Ri on m. Thisisabeta pricing model.<br />
It says that expected returns on assets i =1, 2,...Nshould be proportional to their betas in a<br />
regression of returns on the discount factor. Notice that the coefficient λm is the same for all<br />
assets i,while the βi,m varies from asset to asset. The λm is often interpreted as the price of<br />
risk and the β as the quantity of risk in each asset.<br />
Obviously, there is nothing deep about saying that expected returns are proportional to<br />
betas rather than to covariances. There is a long historical tradition and some minor convenience<br />
in favor of betas. The betas refer to the projection of R on m that we studied above,<br />
so you see again a sense in which only the systematic component of risk matters.<br />
With m = β (ct+1/ct) −γ , we can take a Taylor approximation of equation (1.14) to<br />
express betas in terms of a more concrete variable, consumption growth, rather than marginal<br />
utility. The result, which I derive more explicitly and conveniently in the continuous time<br />
limit below, is<br />
(14)<br />
(15)<br />
E(R i ) = R f + βi,∆cλ∆c (1.16)<br />
λ∆c = γvar(∆c).<br />
Expected returns should increase linearly with their betas on consumption growth itself. In<br />
addition, though it is treated as a free parameter in many applications, the factor risk premium<br />
λ∆c is determined by risk aversion and the volatility of consumption. The more risk averse<br />
people are, or the riskier their environment, the larger an expected return premium one must<br />
pay to get investors to hold risky (high beta) assets.<br />
1.4.5 Mean-variance frontier<br />
All asset returns lie inside a mean-variance frontier. <strong>Asset</strong>s on the frontier are perfectly<br />
correlated with each other and the discount factor. Returns on the frontier can be generated<br />
as portfolios of any two frontier returns. We can construct a discount factor from any frontier<br />
26
SECTION 1.4 CLASSIC ISSUES IN FINANCE<br />
return (except R f ), and an expected return-beta representation holds using any frontier return<br />
(except R f ) as the factor.<br />
<strong>Asset</strong> pricing theory has focused a lot on the means and variances of asset returns. Interestingly,<br />
the set of means and variances of returns is limited. All assets priced by the discount<br />
factor m must obey<br />
To derive (1.17) write for a given asset return R i<br />
and hence<br />
¯<br />
¯E(R i ) − R f¯ ¯ ≤ σ(m)<br />
E(m) σ(Ri ). (17)<br />
1=E(mR i )=E(m)E(R i )+ρ m,R iσ(R i )σ(m)<br />
E(R i )=R f σ(m)<br />
− ρm,Ri E(m) σ(Ri ). (18)<br />
Correlation coefficients can’t be greater than one in magnitude, leading to (1.17).<br />
This simple calculation has many interesting and classic implications.<br />
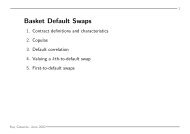
1. Means and variances of asset returns must lie in the wedge-shaped region illustrated<br />
in Figure 1. The boundary of the mean-variance region in which assets can lie is called the<br />
mean-variance frontier. It answers a naturally interesting question, “how much mean return<br />
can you get for a given level of variance?”<br />
2. All returns on the frontier are perfectly correlated with the discount factor: the frontier<br />
is generated by ¯ ¯<br />
¯ρ ¯<br />
m,Ri =1. Returns on the upper part of the frontier are perfectly negatively<br />
correlated with the discount factor and hence positively correlated with consumption. They<br />
are “maximally risky” and thus get the highest expected returns. Returns on the lower part of<br />
the frontier are perfectly positively correlated with the discount factor and hence negatively<br />
correlated with consumption. They thus provide the best insurance against consumption<br />
fluctuations.<br />
3. All frontier returns are also perfectly correlated with each other, since they are all<br />
perfectly correlated with the discount factor. This fact implies that we can span or synthesize<br />
any frontier return from two such returns. For example if you pick any single frontier return<br />
Rm then all frontier returns Rmv must be expressible as<br />
R mv = R f + a ¡ R m − R f¢<br />
for some number a.<br />
4. Since each point on the mean-variance frontier is perfectly correlated with the discount<br />
27
CHAPTER 1 CONSUMPTION-BASED MODEL AND OVERVIEW<br />
R f<br />
E(R)<br />
Slope σ(m)/E(m)<br />
Idiosyncratic risk R i<br />
Mean-variance frontier<br />
Some asset returns<br />
Figure 1. Mean-variance frontier. The mean and standard deviation of all assets priced by<br />
a discount factor m must line in the wedge-shaped region<br />
factor, we must be able to pick constants a, b, d, e such that<br />
m = a + bR mv<br />
R mv = d + em.<br />
Thus, any mean-variance efficient return carries all pricing information. Given a meanvariance<br />
efficient return and the risk free rate, we can find a discount factor that prices all<br />
assets and vice versa.<br />
5. Given a discount factor, we can also construct a single-beta representation, so expected<br />
returns can be described in a single - beta representation using any mean-variance efficient<br />
return (except the riskfree rate),<br />
E(R i )=R f £ mv f<br />
+ βi,mv E(R ) − R ¤ .<br />
The essence of the β pricing model is that, even though the means and standard deviations<br />
of returns fill out the space inside the mean-variance frontier, a graph of mean returns versus<br />
betas should yield a straight line. Since the beta model applies to every return including<br />
Rmv itself, and Rmv has a beta of one on itself, we can identify the factor risk premium as<br />
λ = E(Rmv − Rf ).<br />
The last two points suggest an intimate relationship between discount factors, beta models<br />
and mean-variance frontiers. I explore this relation in detail in Chapter 6. A problem at the<br />
end of this chapter guides you through the algebra to demonstrate points 4 and 5 explicitly.<br />
28<br />
σ(R)
SECTION 1.4 CLASSIC ISSUES IN FINANCE<br />
6. We can plot the decomposition of a return into a “priced” or “systematic” component<br />
and a “residual,” or “idiosyncratic” component as shown in Figure 1. The priced part is<br />
perfectly correlated with the discount factor, and hence perfectly correlated with any frontier<br />
asset. The residual or idiosyncratic part generates no expected return, so it lies flat as shown<br />
in the figure, and it is uncorrelated with the discount factor or any frontier asset..<br />
1.4.6 Slope of the mean-standard deviation frontier and equity premium puzzle<br />
The Sharpe ratio is limited by the volatility of the discount factor. The maximal risk-return<br />
tradeoff is steeper if there is more risk or more risk aversion<br />
¯<br />
E(R) − R<br />
¯<br />
f<br />
¯<br />
σ(m)<br />
σ(R) ¯ ≤ ≈ γσ(∆ ln c)<br />
E(m)<br />
This formula captures the equity premium puzzle, which suggests that either people are very<br />
risk averse, or the stock returns of the last 50 years were good luck which will not continue.<br />
The ratio of mean excess return to standard deviation<br />
E(R i ) − R f<br />
σ(R i )<br />
= Sharpe ratio<br />
is known as the Sharpe ratio. It is a more interesting characterization of any security than<br />
the mean return alone. If you borrow and put more money into a security, you can increase<br />
the mean return of your position, but you do not increase the Sharpe ratio, since the standard<br />
deviation increases at the same rate as the mean. The slope of the mean-standard deviation<br />
frontier is the largest available Sharpe ratio, and thus is naturally interesting. It answers “how<br />
much more mean return can I get by shouldering a bit more volatility in my portfolio?”<br />
Let Rmv denote the return of a portfolio on the frontier. From equation (1.17), the slope<br />
of the frontier is<br />
¯<br />
E(R<br />
¯<br />
mv ) − Rf σ(Rmv )<br />
¯<br />
= σ(m)<br />
E(m) = σ(m)Rf .<br />
Thus, the slope of the frontier is governed by the volatility of the discount factor.<br />
For an economic interpretation, again consider the power utility function, u0 (c) =c−γ ,<br />
¯<br />
E(R<br />
¯<br />
mv ) − Rf σ(Rmv ¯<br />
) ¯ = σ [(ct+1/ct) −γ ]<br />
h<br />
E (ct+1/ct) −γi.<br />
(19)<br />
The standard deviation is large if consumption is volatile or if γ is large. We can state this<br />
29
CHAPTER 1 CONSUMPTION-BASED MODEL AND OVERVIEW<br />
approximation again using the lognormal assumption. If consumption growth is lognormal,<br />
¯<br />
E(R<br />
¯<br />
mv ) − Rf σ(Rmv ¯<br />
) ¯ =<br />
p<br />
eγ2σ 2 (∆ ln ct+1) − 1 ≈ γσ(∆ ln c). (20)<br />
(A problem at the end of the chapter guides you though the algebra of the first equality.<br />
The relation is exact in continuous time, and thus the approximation is easiest to derive by<br />
reference to the continuous time result; see section 1.5.)<br />
Reading the equation, the slope of the mean-standard deviation frontier is higher if the<br />
economy is riskier – if consumption is more volatile – or if investors are more risk averse.<br />
Both situations naturally make investors more reluctant to take on the extra risk of holding<br />
risky assets. This expression is also the slope of the expected return beta line of the consumption<br />
beta model, (1.16). (Or, conversely, in an economy with a high Sharpe ratio, low risk<br />
aversion investors should take on so much risk that their consumption becomes volatile.)<br />
In postwar US data, the slope of the mean-standard deviation frontier, or of expected<br />
return-beta lines is much higher than reasonable risk aversion and consumption volatility<br />
estimates suggest. This is the “equity premium puzzle.” Over the last 50 years in the U.S.,<br />
real stock returns have averaged 9% with a standard deviation of about 16%, while the real<br />
return on treasury bills has been about 1%. Thus, the historical annual market Sharpe ratio<br />
has been about 0.5. Aggregate consumption growth has been about 1%. Thus, we can only<br />
reconcile these facts with (1.20) if investors have a risk aversion coefficient of 50!<br />
Obvious ways of generalizing the calculation just make matters worse. Equation (1.20)<br />
relates consumption growth to the mean-variance frontier of all contingent claims. The market<br />
indices with 0.5 Sharpe ratios are if anything inside that frontier, so recognizing market<br />
incompleteness will only make matters worse. Aggregate consumption has about 0.2 correlation<br />
with the market return, while the equality (1.20) takes the worst possible case that<br />
consumption growth and asset returns are perfectly correlated. If you add this fact, you need<br />
risk aversion of 250 to explain the market Sharpe ratio in the face of 1% consumption volatility!<br />
Individuals have riskier consumption streams than aggregate, but as their risk goes up<br />
their correlation with any aggregate must decrease proportionally, so to first order recognizing<br />
individual risk will not help either.<br />
Clearly, either 1) people are a lot more risk averse than we might have thought 2) the stock<br />
returns of the last 50 years were largely good luck rather than an equilibrium compensation<br />
for risk, or 3) something is deeply wrong with the model, including the utility function and<br />
use of aggregate consumption data. This “equity premium puzzle” has attracted the attention<br />
of a lot of research in finance, especially on the last item. I return to the equity premium in<br />
more detail in Chapter 21.<br />
1.4.7 Random walks and time-varying expected returns<br />
30
SECTION 1.4 CLASSIC ISSUES IN FINANCE<br />
If investors are risk neutral, returns are unpredictable, and prices follow martingales. In<br />
general, prices scaled by marginal utility are martingales, and returns can be predictable if<br />
investors are risk averse and if the conditional second moments of returns and discount factors<br />
vary over time. This is more plausible at long horizons.<br />
So far, we have concentrated on the behavior of prices or expected returns across assets.<br />
We should also consider the behavior of the price or return of a given asset over time. Going<br />
back to the basic first order condition,<br />
ptu 0 (ct) =Et[βu 0 (ct+1)(pt+1 + dt+1)]. (21)<br />
If investors are risk neutral, i.e. if u(c) is linear or there is no variation in consumption,<br />
if the security pays no dividends between t and t +1, and for short time horizons where β is<br />
close to one, this equation reduces to<br />
pt = Et(pt+1).<br />
Equivalently, prices follow a time-series process of the form<br />
pt+1 = pt + εt+1.<br />
If the variance σ2 t (εt+1) is constant, prices follow a random walk. More generally, prices<br />
follow a martingale. Intuitively, if the price today is a lot lower than investor’s expectations<br />
of the price tomorrow, then people will try to buy the security. But this action will drive<br />
up the price of the security until the price today does equal the expected price tomorrow.<br />
Another way of saying the same thing is that returns should not be predictable; dividing by<br />
pt, expected returns Et(pt+1/pt) =1should be constant; returns should be like coin flips.<br />
The more general equation (1.21) says that prices should follow a martingale after adjusting<br />
for dividends and scaling by marginal utility. Since martingales have useful mathematical<br />
properties, and since risk-neutrality is such a simple economic environment, many asset pricing<br />
results are easily derived by scaling prices and dividends by marginal utility first, and<br />
then using “risk-neutral” formulas and economic arguments.<br />
Since consumption and risk aversion don’t change much day to day, we might expect<br />
the random walk view to hold pretty well on a day-to-day basis. This idea contradicts the<br />
still popular notion that there are “systems” or “technical analysis” by which one can predict<br />
where stock prices are going on any given day. It has been remarkably successful. Despite<br />
decades of dredging the data, and the popularity of television and radio reports that purport<br />
to explain where markets are going, trading rules that reliably survive transactions costs and<br />
do not implicitly expose the investor to risk have not yet been reliably demonstrated.<br />
However, more recently, evidence has accumulated that long-horizon excess returns are<br />
quite predictable, and to some this indicates that the whole enterprise of economic explanation<br />
of asset returns is flawed. To think about this issue, write our basic equation for expected<br />
31
eturns as<br />
CHAPTER 1 CONSUMPTION-BASED MODEL AND OVERVIEW<br />
Et(Rt+1) − R f<br />
t<br />
= −covt(mt+1,Rt+1)<br />
Et(mt+1)<br />
= σt(mt+1)<br />
Et(mt+1) σt(Rt+1)ρt(mt+1,Rt+1) ≈ γtσt(∆ct+1)σt(Rt+1)ρt(mt+1,Rt+1). (1.22)<br />
I include the t subscripts to emphasize that the relation applies to conditional moments.<br />
Sometimes, the conditional mean or other moment of a random variable is different from its<br />
unconditional moment. Conditional on tonight’s weather forecast, you can better predict rain<br />
tomorrow than just knowing the average rain for that date. In the special case that random<br />
variables are i.i.d. (independent and identically distributed), like coin flips, the conditional<br />
and unconditional moments are the same, but that is a special case and not likely to be true of<br />
asset prices, returns, and macroeconomic variables. In the theory so far, we have thought of<br />
an investor, today, forming expectations of payoffs, consumption, and other variables tomorrow.<br />
Thus, the moments are really all conditional, and if we want to be precise we should<br />
include some notation to express this fact. I use subscripts Et(xt+1) to denote conditional<br />
expectation; the notation E(xt+1|It) where It is the information set at time t is more precise<br />
but a little more cumbersome.<br />
Examining equation (1.22), we see that returns can be somewhat predictable. First, if<br />
the conditional variance of returns changes over time, we might expect the conditional mean<br />
return to vary as well – the return can just move in and out a line of constant Sharpe ratio.<br />
This explanation does not seem to help much in the data; variables that forecast means do<br />
not seem to forecast variances and vice versa. Unless we want to probe the conditional<br />
correlation, predictable excess returns have to be explained by changing risk – σt(∆ct+1)<br />
– or changing risk aversion γ. It is not plausible that risk or risk aversion change at daily<br />
frequencies, but fortunately returns are not predictable at daily frequencies. It is much more<br />
plausible that risk and risk aversion change over the business cycle, and this is exactly the<br />
horizon at which we see predictable excess returns. Models that make this connection precise<br />
are a very active area of current research.<br />
1.4.8 Present value statement<br />
∞X<br />
pt = Et mt,t+jdt+j.<br />
j=0<br />
It is convenient to use only the two period valuation, thinking of a price pt and a payoff<br />
32
SECTION 1.5 DISCOUNT FACTORS IN CONTINUOUS TIME<br />
xt+1. But there are times when we want to relate a price to the entire cash flow stream, rather<br />
than just to one dividend and next period’s price.<br />
The most straightforward way to do this is to write out a longer term objective,<br />
∞X<br />
Et β<br />
j=0<br />
j u(ct+j).<br />
Now suppose an investor can purchase a stream {dt+j} at price pt. As with the two-period<br />
model, his first order condition gives us the pricing formula directly,<br />
pt = Et<br />
j=0<br />
∞X<br />
β j u0 (ct+j)<br />
u0 (ct) dt+j = Et<br />
j=0<br />
∞X<br />
mt,t+jdt+j. (23)<br />
You can see that if this equation holds at time t and time t +1, then we can derive the<br />
two-period version<br />
pt = Et[mt+1(pt+1 + dt+1)] (24)<br />
Thus, the infinite period and two period models are equivalent.<br />
(Going in the other direction is a little tougher. If you chain together (1.24), you get (1.23)<br />
plus an extra term. To get (1.23) you also need the “transversality condition” limt→∞ Etmt,t+jpt+j =<br />
0. This is an extra first order condition of the infinite period investor, which is not present<br />
with overlapping generations of two-period investors. It rules out “bubbles” in which prices<br />
grow so fast that people will buy now just to resell at higher prices later, even if there are no<br />
dividends.)<br />
From (1.23) we can write a risk-adjustment to prices, as we did with one period payoffs,<br />
∞X<br />
∞X<br />
pt =<br />
+ covt(dt+j,mt,t+j)<br />
j=1<br />
Etdt+j<br />
R f<br />
t,t+j<br />
j=1<br />
where R f<br />
t,t+j ≡ Et(mt,t+j) −1 is the j period interest rate. Again, assets whose dividend<br />
streams covary negatively with marginal utility, and positively with consumption, have lower<br />
prices, since holding those assets gives the investor a more volatile consumption stream. (It<br />
is common instead to write prices as a discounted value using a risk adjusted discount factor,<br />
e.g. pt = P∞ j=1 Etdt+j/Rt,t+jbut this approach is difficult to use correctly for multiperiod<br />
problems, especially when expected returns can vary over time.)<br />
1.5 Discount factors in continuous time<br />
Continuous time versions of the basic pricing equations.<br />
33
CHAPTER 1 CONSUMPTION-BASED MODEL AND OVERVIEW<br />
Discrete Continuous<br />
pt = Et<br />
P ∞<br />
j=1 βj u0 (ct+j)<br />
u 0 (ct) Dt+j ptu 0 (ct) =Et<br />
mt+1 = β u0 (ct+1)<br />
u 0 (ct)<br />
Λt = e −δt u 0 (ct)<br />
p = E(mx) 0=ΛD dt+ Et[d(Λp)]<br />
E(R) =R f − R f cov(m, R) Et<br />
³ dp<br />
p<br />
R ∞<br />
s=0 e−δs u 0 (ct+s)Dt+sds<br />
´<br />
+ D<br />
p dt = rf t dt − Et<br />
It is often convenient to express asset pricing ideas in the language of continuous time<br />
stochastic differential equations rather than discrete time stochastic difference equations as<br />
I have done so far. The appendix contains a brief introduction to continuous time processes<br />
that covers what you need to know for this book. Even if you want to end up with a discrete<br />
time representation, manipulations are often easier in continuous time. For example, relating<br />
interest rates and Sharpe ratios to consumption growth in the last section required a clumsy<br />
lognormal approximation; you’ll see the same sort of thing done much more cleanly in this<br />
section.<br />
The choice of discrete vs. continuous time is one of modeling convenience. The richness<br />
of the theory of continuous time processes often allows one to obtain analytical results that<br />
would be unavailable in discrete time. On the other hand, in the complexity of most practical<br />
situations, one often ends up resorting to numerical simulation of a discretized model anyway.<br />
In those cases, it might be clearer to start with a discrete model. But I emphasize this is all a<br />
choice of language. One should become familiar enough with discrete as well as continuous<br />
time representations of the same ideas to pick the representation that is most convenient for<br />
a particular application.<br />
First, we need to think about how to model securities, in place of price pt and one-period<br />
payoff xt+1. Let a generic security have price pt at any moment in time, and let it pay<br />
dividends at the rate Dtdt. (I will continue to denote functions of time as pt rather than p(t)<br />
to maintain continuity with the discrete-time treatment, and I will drop the time subscripts<br />
where they are obvious, e.g. dp in place of dpt.Inanintervaldt, the security pays dividends<br />
Dtdt. I use capital D for dividends to distinguish them from the differential operator d. )<br />
The instantaneous total return is<br />
dpt<br />
+<br />
pt<br />
Dt<br />
dt.<br />
pt<br />
We model the price of risky assets as diffusions, for example<br />
dpt<br />
= µ(·)dt + σ(·)dz.<br />
pt<br />
(I will reserve the notation dz for increments to a standard Brownian motion, e.g. zt+∆ −<br />
zt ∼ N (0, ∆). I use the notation (·) to indicate that the drift and diffusions can be functions<br />
of state variables. I limit the discussion to diffusion processes – no jumps.) What’s nice about<br />
this diffusion model is that the increments dz are normal; the dependence of µ and σ on state<br />
34<br />
h dΛ<br />
Λ<br />
i<br />
dp<br />
p
SECTION 1.5 DISCOUNT FACTORS IN CONTINUOUS TIME<br />
variables means that the finite time distribution of prices f(pt+∆|It) need not be normal.<br />
We can think of a riskfree security as one that has a constant price equal to one and pays<br />
the riskfree rate as a dividend,<br />
p =1; Dt = r f<br />
t , (25)<br />
or as a security that pays no dividend but whose price climbs deterministically at a rate<br />
dpt<br />
pt<br />
= r f<br />
t dt. (26)<br />
Next, we need to express the first order conditions in continuous time. The utility function<br />
is<br />
Z ∞<br />
U ({ct}) =E e<br />
t=0<br />
−δt u(ct)dt.<br />
Suppose the investor can buy a security whose price is pt and that pays a dividend stream Dt.<br />
As we did in deriving the present value price relation in discrete time, the first order condition<br />
for this problem gives us the infinite period version of the basic pricing equation right away1 ,<br />
ptu 0 (ct) =Et<br />
This equation is an obvious continuous time analogue to<br />
Z ∞<br />
e<br />
s=0<br />
−δs u 0 (ct+s)Dt+sds (27)<br />
∞X<br />
pt = Et β<br />
j=0<br />
t u0 (ct+j)<br />
u0 (ct) Dt+j.<br />
It turns out that dividing by u 0 (ct) is not a good idea in continuous time, since the ratio<br />
u 0 (ct+∆)/u 0 (ct) isn’t well behaved for small time intervals. Instead, we keep track of the<br />
level of marginal utility. Therefore, define the “discount factor” in continuous time as<br />
Then we can write the pricing equation as<br />
Λt ≡ e −δt u 0 (ct).<br />
Z ∞<br />
ptΛt = Et<br />
s=0<br />
Λt+sDt+sds. (28)<br />
1 One unit of the security pays the dividend stream Dt, i.e.Dtdt units of the numeraire consumption good in a<br />
time interval dt. The security costs pt units of the consumption good. The investor can finance the purchase of ξ<br />
units of the security by reducing consumption from et to ct = et − ξpt/dt during time interval dt. Thelossin<br />
utility from doing so is u 0 (ct)(et − ct)dt = u 0 (ct)ξpt. The gain is the right hand side of (1.27)<br />
35
CHAPTER 1 CONSUMPTION-BASED MODEL AND OVERVIEW<br />
(Some people like to define Λt = u 0 (ct), in which case you keep the e −δt in the equation, or<br />
to scale Λt by the riskfree rate, in which case you get an extra e − R s<br />
τ=0 rf<br />
t+τ dτ in the equation.<br />
The latter procedure makes it look like a risk-neutral or present-value formula valuation.)<br />
The analogue to the one period pricing equation p = E(mx) is<br />
0=ΛD dt+ Et [d(Λp)] . (29)<br />
To derive this fundamental equation, take the difference of equation (1.28) at t and t + ∆.<br />
(Or, start directly with the first order condition for buying the security at t and selling it at<br />
t + ∆.)<br />
Z ∆<br />
ptΛt = Et<br />
Λt+sDt+sds + Et [Λt+∆pt+∆]<br />
s=0<br />
For ∆ small the term in the integral can be approximated<br />
ptΛt ≈ ΛtDt∆ + Et [Λt+∆pt+∆] . (30)<br />
We want to get to d something, so introduce differences by writing<br />
Canceling ptΛt ,<br />
Taking the limit as ∆ → 0,<br />
ptΛt ≈ ΛtDt∆ + Et [Λtpt +(Λt+∆pt+∆ − Λtpt)] . (31)<br />
0 ≈ ΛtDt∆ + Et(Λt+∆pt+∆ − Λtpt).<br />
0=ΛtDtdt + Et [d(Λtpt)]<br />
or, dropping time subscripts, equation (1.29).<br />
Equation (1.29) looks different than p = E(mx) because there is no price on the left<br />
hand side; we are used to thinking of the one period pricing equation as determining price at<br />
t given other things, including price at t +1. But price at t is really here, of course, as you<br />
can see from equation (1.30) or (1.31). It is just easier to express the difference in price over<br />
time rather than price today on the left and payoff (including price tomorrow) on the right.<br />
With no dividends and constant Λ, 0=Et (dpt) =Et(pt+∆ − pt) says that price should<br />
follow a martingale. Thus, Et [d(Λp)] = 0 means that marginal utility-weighted price should<br />
follow a martingale, and (1.29) adjusts for dividends. Thus, it’s the same as the equation<br />
(1.21), ptu0 (ct) =Et (mt+1 (pt+1 + dt+1)) that we derived in discrete time.<br />
Since we will write down price processes for dp and discount factor processes for dΛ,and<br />
to interpret (1.29) in terms of expected returns, it is often convenient to break up the d(Λtpt)<br />
term using Ito’s lemma:<br />
d(Λp) =pdΛ + Λdp + dpdΛ. (32)<br />
36
SECTION 1.5 DISCOUNT FACTORS IN CONTINUOUS TIME<br />
Using the expanded version (1.32) in the basic equation (1.29), and dividing by pΛ to make<br />
it pretty, we obtain an equivalent, slightly less compact but slightly more intuitive version,<br />
0= D<br />
· ¸<br />
dΛ dp dΛ dp<br />
dt + Et + + . (33)<br />
p Λ p Λ p<br />
(This formula only works when both Λ and p can never be zero. That is often enough the case<br />
that this formula is useful. If not, multiply through by Λ and p and keep them in numerators.)<br />
Applying the basic pricing equations (1.29) or (1.33) to a riskfree rate, defined as (1.25)<br />
or (1.26), we obtain<br />
r f<br />
µ <br />
dΛt<br />
t dt = −Et<br />
(34)<br />
This equation is the obvious continuous time equivalent to<br />
R f 1<br />
t =<br />
Et(mt+1) .<br />
If a riskfree rate is not traded, we can use (1.34) to define a shadow riskfree rate or zero-beta<br />
rate.<br />
With this interpretation, we can rearrange equation (1.33) as<br />
µ <br />
dpt<br />
Et +<br />
pt<br />
Dt<br />
dt = r<br />
pt<br />
f<br />
· ¸<br />
dΛt dpt<br />
t dt − Et . (35)<br />
Λt pt<br />
This is the obvious continuous-time analogue to<br />
Λt<br />
E(R) =R f − R f cov(m, R). (36)<br />
The last term in (1.35) is the covariance of the return with the discount factor or marginal<br />
utility. Since means are order dt, there is no difference between covariance and second moment<br />
in the last term of (1.35). The interest rate component of the last term of (1.36) naturally<br />
vanishes as the time interval gets short.<br />
Ito’s lemma makes many transformations simple in continuous time. For example, the<br />
nonlinear transformation between consumption and the discount factor led us to some tricky<br />
approximations in discrete time. This transformation is easy in continuous time (diffusions<br />
are locally normal, so it’s really the same trick). With Λt = e−δtu0 (ct) we have<br />
dΛt = −δe −δt u 0 (ct)dt + e −δt u 00 (ct)dct + 1<br />
2 e−δtu 000 (ct)dc 2 t<br />
dΛt<br />
Λt<br />
= −δdt + ctu00 (ct)<br />
u0 dct<br />
(ct) ct<br />
37<br />
+ 1<br />
2<br />
c2 t u000 (ct)<br />
u0 dc<br />
(ct)<br />
2 t<br />
c2 t<br />
(37)
1.<br />
CHAPTER 1 CONSUMPTION-BASED MODEL AND OVERVIEW<br />
Denote the local curvature and third derivative of the utility function as<br />
γt = − ctu00 (ct)<br />
u0 (ct)<br />
η t = c2 t u 000 (ct)<br />
u 0 (ct) .<br />
(For power utility, the former is the power coefficient γ and the latter is ηt = γ(γ +1).)<br />
Using this formula we can quickly redo the relationship between interest rates and consumption<br />
growth, equation (1.7),<br />
r f 1<br />
t = −<br />
dt Et<br />
µ <br />
dΛt<br />
1<br />
= δ + γt dt Et<br />
µ <br />
dct<br />
− 1<br />
2 η 1<br />
t<br />
dt Et<br />
µ 2 dct .<br />
Λt<br />
We can also easily express asset prices in terms of consumption risk rather than discount<br />
factor risk, as in equation (1.16). Using (1.37) in (1.35),<br />
µ <br />
dpt<br />
Et +<br />
pt<br />
Dt<br />
dt − r<br />
pt<br />
f<br />
µ <br />
dct dpt<br />
t dt = γEt<br />
(38)<br />
ct pt<br />
Thus, assets whose returns covary more strongly with consumption get higher mean returns,<br />
and the constant relating covariance to mean return is the utility curvature coefficient γ.<br />
Since correlations are less than one, equation (1.38) implies that Sharpe ratios are related<br />
to utility curvature and consumption volatility directly; we don’t need the ugly lognormal<br />
facts and an approximation that we needed in (1.20). Using µ p ≡ Et (dpt/pt);<br />
σ2 h<br />
p = Et (dpt/pt) 2i<br />
; σ2 h<br />
c = Et (dct/ct) 2i<br />
,<br />
1.6 Problems<br />
µ p + Dt<br />
pt<br />
dt − rf<br />
t dt<br />
σp<br />
(a) The absolute risk aversion coefficient is<br />
u 00 (c)<br />
u 0 (c) .<br />
ct<br />
≤ γσc.<br />
We scale by u 0 (c) because expected utility is only defineduptolinear<br />
transformations – a + bu(c) gives the same predictions as u(c) – and this measure of<br />
the second derivative is invariant to linear transformations. Show that the utility<br />
38<br />
c 2 t
SECTION 1.6 PROBLEMS<br />
function with constant absolute risk aversion is<br />
u(c) =−e −αc .<br />
(b) The coefficient of relative risk aversion in a one-period model (i.e. when<br />
consumption equals wealth) is defined as<br />
rra = cu00 (c)<br />
u 0 (c) .<br />
For power utility u0 (c) =c−γ , show that the risk aversion coefficient equals the<br />
power.<br />
(c) The elasticity of intertemporal substitution is defined as<br />
ξ I ≡− c2/c1d(c1/c2)<br />
.<br />
dR/R<br />
Show that with power utility u0 (c) =c−γ , the intertemporal substitution elasticity is<br />
equal to 1/γ.<br />
2. Show that the “idiosyncratic risk” line in Figure 1 is horizontal.<br />
3.<br />
(a) Suppose you have a mean-variance efficient return Rmv and the risk free rate.<br />
using the fact that Rmv is perfectly correlated with the discount factor, construct a<br />
discount factor m in terms of Rf and Rmv , with no free parameters. (the constants<br />
in m = a + bRmv will be functions of things like E(Rmv ))<br />
(b) Using this result, and the beta model in terms of m, show that expected returns can<br />
be described in a single - beta representation using any mean-variance efficient<br />
return (except the riskfree rate).<br />
E(R i )=R f £ mv f<br />
+ βi,mv E(R ) − R ¤ .<br />
4. Can the “Sharpe ratio” between two risky assets exceed the slope of the mean-variance<br />
frontier? I.e. if R mv is on the frontier, is it possible that<br />
E(Ri ) − E(Rj )<br />
σ(Ri − Rj ) > E(Rmv ) − Rf σ(Rmv ?<br />
)<br />
5. Show that if consumption growth is lognormal, then<br />
¯<br />
E(R<br />
¯<br />
mv ) − Rf σ(Rmv ¯<br />
) ¯ = σ [(ct+1/ct) −γ ] p<br />
h<br />
= e<br />
E (ct+1/ct)<br />
−γi γ2σ2 (∆ ln ct+1) − 1 ≈ γσ(∆ ln c).<br />
(Start with σ 2 (x) =E(x 2 ) − E(x) 2 and the lognormal property E(e z )=e Ez+ 1 2 σ2 (z) .)<br />
6. There are assets with mean return equal to the riskfree rate, but substantial standard<br />
deviation of returns. Long term bonds are pretty close examples. Why would anyone<br />
39
CHAPTER 1 CONSUMPTION-BASED MODEL AND OVERVIEW<br />
hold such an asset?<br />
7. The first order conditions for an infinitely lived consumer who can buy an asset with<br />
dividend stream {dt} are<br />
∞X<br />
pt = Et β<br />
j=1<br />
j u0 (ct+j)<br />
u0 (ct) dt+j. (39)<br />
The first order conditions for buying a security with price pt and payoff xt+1 =<br />
dt+1 + pt+1 are<br />
pt = Et<br />
·<br />
β u0 (ct+1)<br />
u0 (ct) (pt+1<br />
¸<br />
+ dt+1)<br />
(a) Derive (1.40) from (1.39)<br />
(b) Derive (1.39) from (1.40). You need an extra condition. Show that this extra<br />
condition is a first order condition for maximization. To do this, think about what<br />
strategy the consumer could follow to improve utility if the condition did not hold.<br />
8. Suppose a consumer has a utility function that includes leisure. (This could also be a<br />
second good, or a good produced in another country.) Using the continuous time setup,<br />
show that expected returns will now depend on two covariances, the covariance of returns<br />
with leisure and the covariance of returns with consumption, so long as leisure enters<br />
non-separably, i.e. u(c, l) cannot be written v(c)+w(l). (This is a three line problem,<br />
but you need to apply Ito’s lemma to Λ.)<br />
9. From<br />
1=E(mR)<br />
show that the negative of the mean log discount factor must be larger than any mean<br />
return,<br />
−E(ln m) >E(ln R).<br />
How is it possible that E(ln R) is bounded – what about returns of the form<br />
R =(1− α)R f + αR m for arbitrarily large α? (Hint: start by assuming m and R<br />
are lognormal. Then see if you can generalize the results using Jensen’s inequality,<br />
E(f(x)) >f(E(x)) for f convex. The return that solves maxR E(ln R) is known as the<br />
growth optimal portfolio.)<br />
40<br />
(40)
Chapter 2. Applying the basic model<br />
2.1 Assumptions and applicability<br />
Writing p = E(mx), wedonot assume<br />
1. Markets are complete, or there is a representative investor<br />
2. <strong>Asset</strong> returns or payoffs are normally distributed (no options), or independent over time.<br />
3. Two period investors, quadratic utility, or separable utility<br />
4. Investors have no human capital or labor income<br />
5. The market has reached equilibrium, or individuals have bought all the securities they<br />
want to.<br />
All of these assumptions come later, in various special cases, but we haven’t made them<br />
yet. We do assume that the investor can consider a small marginal investment or disinvestment.<br />
The theory of asset pricing contains lots of assumptions to derive analytically convenient<br />
special cases and empirically useful representations. In writing p = E(mx) or pu 0 (ct) =<br />
Et [βu 0 (ct+1)xt+1] we have not made most of these assumptions.<br />
We have not assumed complete markets or a representative investor. These equations<br />
apply to each individual investor, for each asset to which he has access, independently of<br />
the presence or absence of other investors or other assets. Complete markets/representative<br />
agent assumptions are used if one wants to use aggregate consumption data in u0 (ct),orother<br />
specializations and simplifications of the model.<br />
We have not said anything about payoff or return distributions. In particular, we have<br />
not assumed that returns are normally distributed or that utility is quadratic. The basic<br />
pricing equation should hold for any asset, stock, bond, option, real investment opportunity,<br />
etc., and any monotone and concave utility function. In particular, it is often thought that<br />
mean-variance analysis and beta pricing models require these kind of limiting assumptions<br />
or quadratic utility, but that is not the case. A mean-variance efficient return carries all pricing<br />
information no matter what the distribution of payoffs, utility function, etc.<br />
This is not a “two-period model.” The fundamental pricing equation holds for any two<br />
periods of a multi-period model, as we have seen. Really, everything involves conditional<br />
moments, so we have not assumed i.i.d. returns over time.<br />
I have written things down in terms of a time- and state-separable utility function and I<br />
have extensively used the convenient power utility example. Nothing important lies in either<br />
41
CHAPTER 2 APPLYING THE BASIC MODEL<br />
choice. Just interpret u0 (ct) as the partial derivative of a general utility function with respect<br />
to consumption at time t. State- or time-nonseparable utility (habit persistence, durability)<br />
complicates the relation between the discount factor and real variables, but does not change<br />
p = E(mx) or any of the basic structure. We will look at several examples below.<br />
We do not assume that investors have no non-marketable human capital, or no outside<br />
sources of income. The first order conditions for purchase of an asset relative to consumption<br />
hold no matter what else is in the budget constraint. By contrast, the portfolio approach to<br />
asset pricing as in the CAPM and ICAPM relies heavily on the assumption that the investor<br />
has no non-asset income, and we will study these special cases below. For example, leisure<br />
in the utility function just means that u0 (c, l) may depend on l as well as c.<br />
We don’t even really need the assumption (yet) that the market is “in equilibrium,” that<br />
investor has bought all of the asset that he wants to, or even that he can buy the asset at all.<br />
We can interpret p = E(mx) as giving us the value, or willingness to pay for, a small amount<br />
of a payoff xt+1 that the investor does not yet have. Here’s why: If the investor had a little ξ<br />
more of the payoff xt+1 at time t +1, his utility u(ct)+βEtu(ct+1) would increase by<br />
¸<br />
βEt [u(ct+1 + ξxt+1) − u(ct+1)] = βEt<br />
·<br />
u 0 (ct+1)xt+1ξ + 1<br />
2 u00 (ct+1)(xt+1ξ) 2 + ...<br />
If ξ is small, only the first term on the right matters. If the investor has to give up a small<br />
amount of money vtξ at time t, that loss lowers his utility by<br />
u(ct − vtξ) =u 0 (ct)vtξ + 1<br />
2 u00 (ct)(vtξ) 2 + ....<br />
Again, for small ξ, onlythefirst term matters. Therefore, in order to receive the small extra<br />
payoff ξxt+1, the investor is willing to pay the small amount vtξ where<br />
¸<br />
.<br />
vt = Et<br />
·<br />
β u0 (ct+1)<br />
u 0 (ct) xt+1<br />
If this private valuation is higher than the market value pt, and if the investor can buy<br />
some more of the asset, he will. As he buys more, his consumption will change; it will be<br />
higher in states where xt+1 is higher, driving down u 0 (ct+1) in those states, until the value<br />
to the investor has declined to equal the market value. Thus, after an investor has reached<br />
his optimal portfolio, the market value should obey the basic pricing equation as well, using<br />
post-trade or equilibrium consumption. But the formula can also be applied to generate<br />
the marginal private valuation, using pre-trade consumption, or to value a potential, not yet<br />
traded security.<br />
We have calculated the value of a “small” or marginal portfolio change for the investor.<br />
For some investment projects, an investor cannot take a small (“diversified”) position. For example,<br />
a venture capitalist or entrepreneur must usually take all or nothing of a project with<br />
payoff stream {xt}. Then the value of a project not already taken, E P<br />
j βj u(ct+j + xt+j)<br />
42
SECTION 2.2 GENERAL EQUILIBRIUM<br />
might be substantially different from its marginal counterpart, E P β j u 0 (ct+j)xt+j. Once<br />
the project is taken of course, ct+j + xt+j becomes ct+j, so the marginal valuation still applies<br />
to the ex-post consumption stream. Analysts often forget this point and apply marginal<br />
(diversified) valuation models such as the CAPM to projects that must be bought in discrete<br />
chunks. Also, we have abstracted from short sales and bid/ask spreads; this modification<br />
changes p = E(mx) from an equality to a set of inequalities.<br />
2.2 General Equilibrium<br />
<strong>Asset</strong> returns and consumption: which is the chicken and which is the egg? The exogenous<br />
return model, the endowment economy model, and the argument that it doesn’t matter for<br />
studying p = E(mx).<br />
So far, we have not said where the joint statistical properties of the payoff xt+1 and<br />
marginal utility mt+1 or consumption ct+1 come from. We have also not said anything<br />
about the fundamental exogenous shocks that drive the economy. The basic pricing equation<br />
p = E(mx) tells us only what the price should be, given the joint distribution of consumption<br />
(marginal utility, discount factor) and the asset payoff.<br />
There is nothing that stops us from writing the basic pricing equation as<br />
u 0 (ct) =Et [βu 0 (ct+1)xt+1/pt] .<br />
We can think of this equation as determining today’s consumption given asset prices and<br />
payoffs, rather than determining today’s asset price in terms of consumption and payoffs.<br />
Thinking about the basic first order condition in this way gives the permanent income model<br />
of consumption.<br />
Which is the chicken and which is the egg? Which variable is exogenous and which is endogenous?<br />
The answer is, neither, and for many purposes, it doesn’t matter. The first order<br />
conditions characterize any equilibrium; if you happen to know E(mx), you can use them to<br />
determine p; if you happen to know p, you can use them to determine consumption and savings<br />
decisions. For most asset pricing applications we are interested in understanding a wide<br />
cross-section of assets. Thus, it is interesting to contrast the cross-sectional variation in their<br />
prices (expected returns) with cross-sectional variation in their second moments (betas) with<br />
a single discount factor. In most applications, the discount factor is a function of aggregate<br />
variables (market return, aggregate consumption), so is plausible to hold the properties of the<br />
discount factor constant as we study one individual asset after another. Permanent income<br />
studies typically dramatically restrict the number of assets under consideration, often to just<br />
an interest rate, and study the time-series evolution of aggregate or individual consumption.<br />
Nonetheless, it is an obvious next step to complete the solution of our model economy; to<br />
43
CHAPTER 2 APPLYING THE BASIC MODEL<br />
find c and p in terms of truly exogenous forces. The results will of course depend on what the<br />
rest of the economy looks like, in particular the production or intertemporal transformation<br />
technology and the set of markets.<br />
Figure 2 shows one possibility for a general equilibrium. Suppose that the production<br />
technologies are linear: the real, physical rate of return (the rate of intertemporal transformation)<br />
is not affected by how much is invested. Now consumption must adjust to these<br />
technologically given rates of return. If the rates of return on the intertemporal technologies<br />
were to change, the consumption process would have to change as well. This is, implicitly,<br />
how the permanent income model works. This is how many finance theories such as the<br />
CAPM and ICAPM and the Cox, Ingersoll and Ross (1986) model of the term structure work<br />
as well. These models specify the return process, and then solve the consumer’s portfolio and<br />
consumption rules.<br />
C t+1<br />
Figure 2. Consumption adjusts when the rate of return is determined by a linear technology.<br />
Figure 3 shows another extreme possibility for the production technology. This is an<br />
“endowment economy.” Nondurable consumption appears (or is produced by labor) every<br />
period. There is nothing anyone can do to save, store, invest or otherwise transform consumption<br />
goods this period to consumption goods next period. Hence, asset prices must<br />
adjust until people are just happy consuming the endowment process. In this case consumption<br />
is exogenous and asset prices adjust. Lucas (1978) and Mehra and Prescott (1985) are<br />
two very famous applications of this sort of “endowment economy.”<br />
Which of these possibilities is correct? Well, neither, of course. The real economy and all<br />
serious general equilibrium models look something like figure 4: one can save or transform<br />
consumption from one date to the next, but at a decreasing rate. As investment increases,<br />
44<br />
R<br />
C t
C t+1<br />
SECTION 2.2 GENERAL EQUILIBRIUM<br />
Figure 3. <strong>Asset</strong> prices adjust to consumption in an endowment economy.<br />
rates of return decline<br />
C t+1<br />
Figure 4. General equilibrium. The solid lines represent the indifference curve and production<br />
possibility set. The dashed straight line represents the equilibrium rate of return.<br />
The dashed box represents an endowment economy that predicts the same consumption-asset<br />
return process.<br />
45<br />
R<br />
R<br />
C t<br />
C t
CHAPTER 2 APPLYING THE BASIC MODEL<br />
Does this observation invalidate any modeling we do with the linear technology (CAPM,<br />
CIR, permanent income) model, or the endowment economy model? No. Start at the equilibrium<br />
in figure 4. Suppose we model this economy as a linear technology, but we happen to<br />
choose for the rate of return on the linear technologies exactly the same stochastic process for<br />
returns that emerges from the general equilibrium. The resulting joint consumption, asset return<br />
process is exactly the same as in the original general equilibrium! Similarly, suppose we<br />
model this economy as an endowment economy, but we happen to choose for the endowment<br />
process exactly the stochastic process for consumption that emerges from the equilibrium<br />
with a concave technology. Again, the joint consumption-asset return process is exactly the<br />
same.<br />
Therefore, there is nothing wrong in adopting one of the following strategies for empirical<br />
work:<br />
1. Form a statistical model of bond and stock returns, solve the optimal consumptionportfolio<br />
decision. Use the equilibrium consumption values in p = E(mx).<br />
2. Form a statistical model of the consumption process, calculate asset prices and returns<br />
directly from the basic pricing equation p = E(mx).<br />
3. Form a completely correct general equilibrium model, including the production<br />
technology, utility function and specification of the market structure. Derive the<br />
equilibrium consumption and asset price process, including p = E(mx) as one of the<br />
equilibrium conditions.<br />
If the statistical models for consumption and/or asset returns are right, i.e. if they coincide<br />
with the equilibrium consumption or return process generated by the true economy, either of<br />
the first two approaches will give correct predictions for the joint consumption-asset return<br />
process.<br />
As we will see, most finance models, developed from the 1950s through the early 1970s,<br />
take the return process as given, implicitly assuming linear technologies. The endowment<br />
economy approach, introduced by Lucas (1978), is a breakthrough because it turns out to be<br />
much easier. It is much easier to evaluate p = E(mx) for fixed m than it is to solve joint<br />
consumption-portfolio problems for given asset returns, all to derive the equilibrium consumption<br />
process. To solve a consumption-portfolio problem we have to model the investor’s<br />
entire environment: we have to specify all the assets to which he has access, what his labor<br />
income process looks like (or wage rate process, and include a labor supply decision).<br />
Once we model the consumption stream directly, we can look at each asset in isolation, and<br />
the actual computation is almost trivial. This breakthrough accounts for the unusual structure<br />
of the presentation in this book. It is traditional to start with an extensive study of<br />
consumption-portfolio problems. But by modeling consumption directly, we have been able<br />
to study pricing directly, and portfolio problems are an interesting side trip which we can<br />
defer.<br />
Most uses of p = E(mx) do not require us to take any stand on exogeneity or endogeneity,<br />
or general equilibrium. This is a condition that must hold for any asset, for any<br />
46
SECTION 2.3 CONSUMPTION-BASED MODEL IN PRACTICE<br />
production technology. Having a taste of the extra assumptions required for a general equilibrium<br />
model, you can now appreciate why people stop short of full solutions when they can<br />
address an application using only the first order conditions, using knowledge of E(mx) to<br />
make a prediction about p.<br />
It is enormously tempting to slide into an interpretation that E(mx) determines p. Weroutinely<br />
think of betas and factor risk prices – components of E(mx) –asdetermining expected<br />
returns. For example, we routinely say things like “the expected return of a stock increased<br />
because the firm took on riskier projects, thereby increasing its β.” But the whole consumption<br />
process, discount factor, and factor risk premia change when the production technology<br />
changes. Similarly, we are on thin ice if we say anything about the effects of policy interventions,<br />
new markets and so on. The equilibrium consumption or asset return process one has<br />
modeled statistically may change in response to such changes in structure. For such questions<br />
one really needs to start thinking in general equilibrium terms. It may help to remember<br />
that there is an army of permanent-income macroeconomists who make precisely the opposite<br />
assumption, taking our asset return processes as exogenous and studying (endogenous)<br />
consumption and savings decisions.<br />
2.3 Consumption-based model in practice<br />
The consumption-based model is, in principle, a complete answer to all asset pricing<br />
questions, but works poorly in practice. This observation motivates other asset pricing models.<br />
The model I have sketched so far can, in principle, give a compete answer to all the<br />
questions of the theory of valuation. It can be applied to any security—bonds, stocks, options,<br />
futures, etc.—or to any uncertain cash flow. All we need is a functional form for utility,<br />
numerical values for the parameters, and a statistical model for the conditional distribution of<br />
consumption and payoffs.<br />
To be specific, consider the standard power utility function<br />
Then, excess returns should obey<br />
"<br />
0=Et β<br />
u 0 (c) =c −γ . (41)<br />
µ −γ<br />
ct+1<br />
R<br />
ct<br />
e t+1<br />
Taking unconditional expectations and applying the covariance decomposition, expected ex-<br />
47<br />
#<br />
(42)
cess returns should follow<br />
CHAPTER 2 APPLYING THE BASIC MODEL<br />
E(R e t+1) =−R f cov<br />
" µct+1<br />
ct<br />
−γ<br />
,R e #<br />
t+1 . (43)<br />
Given a value for γ, and data on consumption and returns, one can easily estimate the mean<br />
and covariance on the right hand side, and check whether actual expected returns are, in fact,<br />
in accordance with the formula.<br />
Similarly, the present value formula is<br />
∞X<br />
pt = Et β<br />
j=1<br />
j<br />
µ<br />
ct+j<br />
ct<br />
−γ<br />
dt+j. (44)<br />
Given data on consumption and dividends or another stream of payoffs, we can estimate the<br />
right hand side and check it against prices on the left.<br />
Bonds and options do not require separate valuation theories. For example, an N-period<br />
default-free nominal discount bond (a U.S. Treasury strip) is a claim to one dollar at time<br />
t + N. Its price should be<br />
pt = Et<br />
Ã<br />
β N<br />
µ −γ<br />
ct+N Πt<br />
ct Πt+N<br />
where Π = price level ($/good). A European option is a claim to the payoff max(St+T −<br />
K, 0), whereSt+T = stock price at time t + T,K = strike price. The option price should be<br />
pt = Et<br />
"<br />
β T<br />
µ −γ<br />
ct+T<br />
ct<br />
1<br />
!<br />
max(St+T − K, 0)<br />
again, we can use data on consumption, prices and payoffs to check these predictions.<br />
Unfortunately, the above specification of the consumption-based model does not work<br />
very well. To give a flavor of some of the problems, Figure 5 presents the mean excess<br />
returns on the ten size-ranked portfolios of NYSE stocks vs. the predictions – the right hand<br />
side of (2.43) – of the consumption-based model. I picked the utility curvature parameter<br />
γ =241to make the picture look as good as possible (The section on GMM estimation<br />
below goes into detail on how to do this. The Figure presents the first-stage GMM estimate.)<br />
As you can see, the model isn’t hopeless–there is some correlation between sample average<br />
returns and the consumption-based model predictions. But the model does not do very well.<br />
The pricing error (actual expected return - predicted expected return) for each portfolio is of<br />
the same order of magnitude as the spread in expected returns across the portfolios.<br />
48<br />
#
SECTION 2.4 ALTERNATIVE ASSET PRICING MODELS: OVERVIEW<br />
Figure 5. Mean excess returns of 10 CRSP size portfolios vs. predictions of the power<br />
utility consumption-based model. The predictions are generated by −R f cov(m, R i ) with<br />
m = β(ct+1/ct) −γ . β =0.98 and γ =241are picked by first-stage GMM to minimize the<br />
sum of squared pricing errors (deviation from 45 ◦ line). Source: <strong>Cochrane</strong> (1996).<br />
2.4 Alternative asset pricing models: Overview<br />
I motivate exploration of different utility functions, general equilibrium models, and linear<br />
factor models such as the CAPM, APT and ICAPM as approaches to circumvent the empirical<br />
difficulties of the consumption-based model.<br />
The poor empirical performance of the consumption-based model motivates a search for<br />
alternative asset pricing models – alternative functions m = f(data). All asset pricing models<br />
amount to different functions for m. Igivehereabaresketchofsomeofthedifferent<br />
approaches; we study each in detail in later chapters.<br />
1) Different utility functions. Perhaps the problem with the consumption-based model is<br />
simply the functional form we chose for utility. The natural response is to try different utility<br />
functions. Which variables determine marginal utility is a far more important question than<br />
the functional form. Perhaps the stock of durable goods influences the marginal utility of<br />
nondurable goods; perhaps leisure or yesterday’s consumption affect today’s marginal utility.<br />
These possibilities are all instances of nonseparabilities. One can also try to use micro data<br />
on individual consumption of stockholders rather than aggregate consumption. Aggregation<br />
of heterogenous investors can make variables such as the cross-sectional variance of income<br />
49
CHAPTER 2 APPLYING THE BASIC MODEL<br />
appear in aggregate marginal utility.<br />
2) General equilibrium models. Perhaps the problem is simply with the consumption data.<br />
General equilibrium models deliver equilibrium decision rules linking consumption to other<br />
variables, such as income, investment, etc. Substituting the decision rules ct = f(yt,it,...)<br />
in the consumption-based model, we can link asset prices to other, hopefully better-measured<br />
macroeconomic aggregates.<br />
In addition, true general equilibrium models completely describe the economy, including<br />
the stochastic process followed by all variables. They can answer questions such as why is<br />
the covariance (beta) of an asset payoff x with the discount factor m the value that it is, rather<br />
than take this covariance as a primitive. They can in principle answer structural questions,<br />
such as how asset prices might be affected by different government policies. Neither kind of<br />
question can be answered by just manipulating investor first order conditions.<br />
3) Factor pricing models. Another sensible response to bad consumption data is to model<br />
marginal utility in terms of other variables directly. Factor pricing models follow this approach.<br />
They just specify that the discount factor is a linear function of a set of proxies,<br />
mt+1 = a + bAf A t+1 + bBf B t+1 + ... . (45)<br />
where f i are factors and a, bi are parameters. (This is a different sense of the use of the word<br />
“factor” than “discount factor.” I didn’t invent the confusing terminology.) By and large, the<br />
factors are just selected as plausible proxies for marginal utility; events that describe whether<br />
typical investors are happy or unhappy. Among others, the Capital <strong>Asset</strong> <strong>Pricing</strong> Model<br />
(CAPM) is the model<br />
mt+1 = a + bR W t+1<br />
where RW is the rate of return on a claim to total wealth, often proxied by a broad-based<br />
portfolio such as the value-weighted NYSE portfolio. The Arbitrage <strong>Pricing</strong> Theory (APT)<br />
uses returns on broad-based portfolios derived from a factor analysis of the return covariance<br />
matrix. The Intertemporal Capital <strong>Asset</strong> <strong>Pricing</strong> Model (ICAPM) suggests macroeconomic<br />
variables such as GNP and inflation and variables that forecast macroeconomic variables or<br />
asset returns as factors. Term structure models such as the Cox-Ingersoll-Ross model specify<br />
that the discount factor is a function of a few term structure variables, for example the short<br />
rate of interest and a few interest rate spreads.<br />
Many factor pricing models are derived as general equilibrium models with linear technologies<br />
and no labor income; thus they also fall into the general idea of using general equilibrium<br />
relations (from, admittedly, very stylized general equilibrium models) to substitute<br />
out for consumption.<br />
4) Arbitrage or near-arbitrage pricing. Themereexistenceofarepresentationp =<br />
E(mx) and the fact that marginal utility is positive m ≥ 0 (these facts are discussed in<br />
the next chapter) can often be used to deduce prices of one payoff in terms of the prices of<br />
other payoffs. The Black-Scholes option pricing model is the paradigm of this approach:<br />
50
SECTION 2.5 PROBLEMS<br />
Since the option payoff can be replicated by a portfolio of stock and bond, any m that prices<br />
the stock and bond gives the price for the option. Recently, there have been several suggestions<br />
on how to use this idea in more general circumstances by using very weak further<br />
restrictions on m, and we will study these suggestions in Chapter 17.<br />
We return to a more detailed derivation and discussion of these alternative models of the<br />
discount factor m below. First, and with this brief overview in mind, we look at p = E(mx)<br />
and what the discount factor m represents in a little more detail.<br />
2.5 Problems<br />
1. The representative consumer maximizes a CRRA utility function.<br />
X<br />
j 1−γ<br />
Et β ct+j .<br />
Consumption is given by an endowment stream.<br />
(a) Show that with log utility, the price/consumption ratio of the consumption stream is<br />
constant, no matter what the distribution of consumption growth.<br />
(b) Suppose there is news at time t that future consumption will be higher. For<br />
γ < 1, γ =1,and γ > 1, evaluate the effect of this news on the price. Make sense of<br />
your results. (Note: there is a real-world interpretation here. It’s often regarded as a<br />
puzzle that the market declines on good economic news. This is attributed to an<br />
expectation by the market that the Fed will respond to such news by raising interest<br />
rates. Note that γ > 0 in this problem gives a completely real and frictionless<br />
interpretation to this phenomenon! I thank Pete Hecht for this nice problem.)<br />
2. The linear quadratic permanent income model is a very useful general equilibrium model<br />
that we can solve in closed form. It specifies a production technology rather than fixed<br />
endowments, and it easily allows aggregation of disparate consumers. (Hansen 1987 is a<br />
wonderful exposition of what one can do with this setup.)<br />
The consumer maximizes<br />
∞X<br />
E β t<br />
µ<br />
− 1<br />
<br />
(ct − c<br />
2<br />
∗ ) 2<br />
subject to a linear technology<br />
t=0<br />
kt+1 =(1+r)kt + it<br />
it = et − ct<br />
et is an exogenous endowment or labor income stream. Assume β =1/(1 + r); the<br />
discount rate equals the interest rate or marginal productivity of capital.<br />
51
CHAPTER 2 APPLYING THE BASIC MODEL<br />
(a) Show that optimal consumption follows<br />
ct = rkt + rβ<br />
∞X<br />
j=0<br />
ct = ct−1 +(Et − Et−1) rβ<br />
β j Etet+j<br />
∞X<br />
j=0<br />
β j et+j<br />
i.e., consumption equals permanent income, precisely defined, and consumption<br />
follows a random walk whose innovations are equal to innovations in permanent<br />
income.<br />
(b) Assume that the endowment et follows an AR(1)<br />
et = ρet−1 + εt<br />
(2.46)<br />
(2.47)<br />
and specialize (2.46) and (2.47). Calculate and interpret the result for ρ =1and<br />
ρ =0. (The result looks like a “consumption function” relating consumption to<br />
capital and current income, except that the slope of that function depends on<br />
the persistence of income shocks. Transitory shocks will have little effect on<br />
consumption, and permanent shocks a larger effect.)<br />
(c) Calculate the one period interest rate (it should come out to r of course) and the<br />
price of a claim to the consumption stream. e and k are the only state variables, so<br />
the price should be a function of e and k. Interpret the time-variation in the price of<br />
the consumption stream. (This consumer gets more risk averse as consumption rises<br />
to c∗ . c∗ is the bliss point, so at the bliss point there is no average return that can<br />
compensate the consumer for greater risk.)<br />
3. Consider again CRRA utility,<br />
X<br />
j 1−γ<br />
Et β ct+j .<br />
Consumption growth follows a two-state Markov process. The states are<br />
∆ct = ct/ct−1 = h, l,anda2×2matrixπgoverns the set of transition probabilities, i.e.<br />
pr(∆ct+1 = h|∆ct = l) =πl→h. (This is the Mehra-Prescott 1986 model, but it will be<br />
faster to do it than to look it up. It is a useful and simple endowment economy.)<br />
(a) Find the riskfree rate (price of a certain real payoff of one) in this economy. This<br />
price is generated by<br />
p b t = Et(mt,t+11).<br />
You are looking for two values, the price in the l state and the price in the h state.<br />
(b) Find the price of the consumption stream (the price at t of {ct+1,ct+2,...}). To do<br />
this, guess that the price/consumption ratio must be a function of state (h,l), and find<br />
52
that function. From<br />
SECTION 2.5 PROBLEMS<br />
p c ¡<br />
t = Et mt,t+1(p c ¢<br />
t+1 + ct+1 )<br />
find a recursive relation for p c t/ct, and hence find the two values of p c t/ct, one for the<br />
h state and one for the l state.<br />
(c) Pick β =0.99 and try γ =0.5, 5 (Try more if you feel like it). Calibrate<br />
the consumption process to have a 1% mean and 1% standard deviation, and<br />
consumption growth uncorrelated over time. Calculate prices and returns in each<br />
state.<br />
(d) Now introduce serial correlation in consumption growth with γ =5. (You can do<br />
this by adding weight to the diagonal entries of the transition matrix π.) What effect<br />
does this have on the model?<br />
53
Chapter 3. Contingent Claims Markets<br />
Our firsttaskistounderstandthep = E(mx) representation a little more deeply. In this<br />
chapter I introduce a very simple market structure, contingent claims. This leads us to an<br />
inner product interpretation of p = E(mx) which allows an intuitive visual representation<br />
of most of the theorems. We see that discount factors exist, are positive, and the pricing<br />
function is linear, just starting from prices and payoffs in a complete market, without any<br />
utility functions. The next chapter shows that these properties can be built up in incomplete<br />
markets as well.<br />
3.1 Contingent claims<br />
I describe contingent claims. I interpret the stochastic discount factor m as contingent<br />
claims prices divided by probabilities, and p = E(mx) as a bundling of contingent claims.<br />
Suppose that one of S possible states of nature can occur tomorrow, i.e. specialize to a<br />
finite-dimensional state space. Denote the individual states by s. For example, we might have<br />
S =2and s = rain or s = shine.<br />
A contingent claim is a security that pays one dollar (or one unit of the consumption<br />
good) in one state s only tomorrow. pc(s) is the price today of the contingent claim. I write<br />
pc to specify that it is the price of a contingent claim and (s) to denote in which state s the<br />
claim pays off.<br />
In a complete market investors can buy any contingent claim. They don’t necessarily have<br />
to be faced with explicit contingent claims; they just need enough other securities to span<br />
or synthesize all contingent claims. For example, if the possible states of nature are (rain,<br />
shine), one can span or synthesize any contingent claim or portfolio achieved by combining<br />
contingent claims by forming portfolios of a security that pays 2 dollars if it rains and one if<br />
it shines, or x1 =(2, 1), and a riskfree security whose payoff pattern is x2 =(1, 1).<br />
Now, we are on a hunt for discount factors, and the central point is:<br />
If there are complete contingent claims, a discount factor exists, and it is equal to the<br />
contingent claim price divided by probabilities.<br />
Let x(s) denote an asset’s payoff in state of nature s. We can think of the asset as a<br />
bundle of contingent claims—x(1) contingent claims to state 1, x(2) claims to state 2, etc.<br />
The asset’s price must then equal the value of the contingent claims of which it is a bundle,<br />
p(x) = X<br />
pc(s)x(s). (48)<br />
s<br />
54
SECTION 3.2 RISK NEUTRAL PROBABILITIES<br />
I denote the price p(x) to emphasize that it is the price of the payoff x. Where the payoff<br />
in question is clear, I suppress the (x). I like to think of equation (3.48) as a happy-meal<br />
theorem: the price of a happy meal (in a frictionless market) should be the same as the price<br />
of one hamburger, one small fries, one small drink and the toy.<br />
It is easier to take expectations rather than sum over states. To this end, multiply and<br />
divide the bundling equation (3.48) by probabilities,<br />
p(x) = X<br />
µ <br />
pc(s)<br />
π(s) x(s)<br />
π(s)<br />
s<br />
where π(s) is the probability that state s occurs. Then define m as the ratio of contingent<br />
claim price to probability<br />
m(s) = pc(s)<br />
π(s) .<br />
Now we can write the bundling equation as an expectation,<br />
p = X<br />
π(s)m(s)x(s) =E(mx).<br />
s<br />
Thus, in a complete market, the stochastic discount factor m in p = E(mx) exists, and it<br />
is just a set of contingent claims prices, scaled by probabilities. As a result of this interpretation,<br />
the combination of discount factor and probability is sometimes called a state-price<br />
density.<br />
The multiplication and division by probabilities seems very artificial in this finite-state<br />
context. In general, we posit states of nature ω that can take continuous (uncountably infinite)<br />
values in a space Ω. In this case, the sums become integrals, and we have to use some measure<br />
to integrate over Ω. Thus, scaling contingent claims prices by some probability-like object is<br />
unavoidable.<br />
3.2 Risk neutral probabilities<br />
I interpret the discount factor m as a transformation to risk-neutral probabilities such that<br />
p = E ∗ (x)/R f .<br />
Another common transformation of p = E(mx) results in “risk-neutral” probabilities.<br />
Define<br />
π ∗ (s) ≡ R f m(s)π(s) =R f pc(s)<br />
55
where<br />
CHAPTER 3 CONTINGENT CLAIMS MARKETS<br />
R f ≡ 1/ X pc(s) =1/E(m).<br />
The π ∗ (s) are positive, less than or equal to one and sum to one, so they are a legitimate set<br />
of probabilities. Then we can rewrite the asset pricing formula as<br />
p(x) = X<br />
s<br />
pc(s)x(s) = 1<br />
Rf X<br />
∗ E<br />
π (s)x(s) = ∗ (x)<br />
Rf .<br />
I use the notation E∗ to remind us that the expectation uses the risk neutral probabilities π∗ instead of the real probabilities π.<br />
Thus, we can think of asset pricing as if agents are all risk neutral, but with probabilities<br />
π∗ in the place of the true probabilities π. The probabilities π∗ gives greater weight to states<br />
with higher than average marginal utility m.<br />
There is something very deep in this idea: risk aversion is equivalent to paying more<br />
attention to unpleasant states, relative to their actual probability of occurrence. People who<br />
report high subjective probabilities of unpleasant events like plane crashes may not have<br />
irrational expectations, they may simply be reporting the risk neutral probabilities or the<br />
product m × π. This product is after all the most important piece of information for many<br />
decisions: pay a lot of attention to contingencies that are either highly probable or that are<br />
improbable but have disastrous consequences.<br />
The transformation from actual to risk-neutral probabilities is given by<br />
π ∗ (s) = m(s)<br />
E(m) π(s).<br />
We can also think of the discount factor m as the derivative or change of measure from the<br />
real probabilities π to the subjective probabilities π∗ . The risk-neutral probability representation<br />
of asset pricing is quite common, especially in derivative pricing where the results are<br />
independent of risk adjustments.<br />
The risk-neutral representation is particularly popular in continuous time diffusion processes,<br />
because we can adjust only the means, leaving the covariances alone. In discrete time,<br />
changing the probabilities typically changes first and second moments. Suppose we start with<br />
a process for prices and discount factor<br />
dp<br />
p = µp dt + σ p dz<br />
dΛ<br />
Λ = µΛ dt + σ Λ dz.<br />
56
The discount factor prices the assets,<br />
Et<br />
µ dp<br />
p<br />
SECTION 3.3 INVESTORS AGAIN<br />
<br />
+ D<br />
p dt − rf dt = −Et<br />
µ dΛ<br />
Λ<br />
<br />
dp<br />
= −σ<br />
p<br />
p σ Λ dt<br />
In the “risk-neutral measure” we just increase the drift of each price process by its covariance<br />
with the discount factor, and write a risk-neutral discount factor,<br />
dp<br />
p = ¡ µ p + σ p σ Λ¢ dt + σ p dz = µ p∗ dt + σ p dz<br />
dΛ<br />
Λ = µΛdt. Under this new set of probabilities, we can just write,<br />
with E ∗ t (dp/p) =µ p∗ dt.<br />
3.3 Investors again<br />
E ∗ t<br />
µ dp<br />
p<br />
<br />
+ D<br />
p dt − rf dt =0<br />
We look at investor’s first order conditions in a contingent claims market. The marginal<br />
rate of substitution equals the discount factor and the contingent claim price ratio.<br />
Though the focus of this chapter is on how to do without utility functions, It’s worth<br />
looking at the investor’s first order conditions again in the contingent claim context. The<br />
investor starts with a pile of initial wealth y and a state-contingent income y(s). He purchases<br />
contingent claims to each possible state in the second period. His problem is then<br />
max<br />
{c,c(s)} u(c)+X βπ(s)u[c(s)] s.t. c + X<br />
pc(s)c(s) =y + X<br />
pc(s)y(s).<br />
s<br />
Introducing a Lagrange multiplier λ on the budget constraint, the first order conditions are<br />
Eliminating the Lagrange multiplier λ,<br />
s<br />
u 0 (c) =λ<br />
βπ(s)u 0 [c(s)] = λpc(s).<br />
pc(s) =βπ(s) u0 [c(s)]<br />
u 0 (c)<br />
57<br />
s
or<br />
CHAPTER 3 CONTINGENT CLAIMS MARKETS<br />
m(s) = pc(s)<br />
π(s) = β u0 [c(s)]<br />
u0 (c)<br />
Coupled with p = E(mx), we obtain the consumption-based model again.<br />
The investor’s first order conditions say that marginal rates of substitution between states<br />
tomorrow equals the relevant price ratio,<br />
m(s1)<br />
m(s2) = u0 [c(s1)]<br />
u0 [c(s2)] .<br />
m(s1)/m(s2) gives the rate at which the investor can give up consumption in state 2 in return<br />
for consumption in state 1 through purchase and sales of contingent claims. u0 [c(s1)]/u0 [c(s2)]<br />
gives the rate at which the investor is willing to make this substitution. At an optimum, the<br />
marginal rate of substitution should equal the price ratio, as usual in economics.<br />
We learn that the discount factor m is the marginal rate of substitution between date and<br />
state contingent commodities. That’s why it, like c(s), is a random variable. Also, scaling<br />
contingent claims prices by probabilities gives marginal utility, and so is not so artificial as it<br />
may have seemed above.<br />
Figure 6 gives the economics behind this approach to asset pricing. We observe the investor’s<br />
choice of date or state-contingent consumption. Once we know his utility function,<br />
we can calculate the contingent claim prices that must have led to the observed consumption<br />
choice, from the derivatives of the utility function.<br />
State 2<br />
or date 2<br />
(c 1 , c 2 )<br />
Indifference curve<br />
State 1, or date 1<br />
Figure 6. Indifference curve and contingent claim prices<br />
The relevant probabilities are the investor’s subjective probabilities over the various states.<br />
58
SECTION 3.4 RISK SHARING<br />
<strong>Asset</strong> prices are set, after all, by investor’s demands for assets, and those demands are set<br />
by investor’s subjective evaluations of the probabilities of various events. We often assume<br />
rational expectations, namely that subjective probabilities are equal to objective frequencies.<br />
But this is an additional assumption that we may not always want to make.<br />
3.4 Risk sharing<br />
Risk sharing: In complete markets, consumption moves together. Only aggregate risk<br />
matters for security markets.<br />
We deduced that the marginal rate of substitution for any individual investor equals the<br />
contingent claim price ratio. But the prices are the same for all investors. Therefore, marginal<br />
utility growth should be the same for all investors<br />
u0 (ci t) = βj u0 (c j<br />
t+1 )<br />
β i u0 (c i t+1)<br />
u 0 (c j<br />
t)<br />
where i and j refer to different investors. If investors have the same homothetic utility function<br />
(for example, power utility), then consumption itself should move in lockstep,<br />
c i t+1<br />
c i t<br />
= cjt+1<br />
c j<br />
t<br />
More generally, shocks to consumption are perfectly correlated across individuals.<br />
This is so radical, it’s easy to misread it at first glance. It doesn’t say that expected<br />
consumptiongrowthshouldbeequal;itsaysthatconsumptiongrowthshouldbeequalexpost.<br />
If my consumption goes up 10%, yours goes up exactly 10% as well, and so does<br />
everyone else’s. In a complete contingent claims market, all investors share all risks, so<br />
when any shock hits, it hits us all equally (after insurance payments). It doesn’t say the<br />
consumption level is the same – this is risk-sharing, not socialism. The rich have higher<br />
levels of consumption, but rich and poor share the shocks equally.<br />
This risk sharing is Pareto-optimal. Suppose a social planner wished to maximize everyone’s<br />
utility given the available resources. For example, with two investors i and j,hewould<br />
maximize<br />
X X<br />
t i t j<br />
max λi β u(ct)+λj β u(ct) s.t. c i t + c j<br />
t = c a t<br />
where c a is the total amount available and λi and λj are i and j’s relative weights in the<br />
59<br />
.<br />
(49)
CHAPTER 3 CONTINGENT CLAIMS MARKETS<br />
planner’s objective. The first order condition to this problem is<br />
λiu 0 (c i t)=λju 0 (c j<br />
t)<br />
and hence the same risk sharing that we see in a complete market, equation (3.49).<br />
This simple fact has profound implications. First, it shows you why only aggregate shocks<br />
should matter for risk prices. Any idiosyncratic income risk will be equally shared, and so<br />
1/N of it becomes an aggregate shock. Then the stochastic discount factors m that determine<br />
asset prices are no longer affected by truly idiosyncratic risks. Much of this sense that only<br />
aggregate shocks matter stays with us in incomplete markets as well.<br />
Obviously, the real economy does not yet have complete markets or full risk sharing –<br />
individual consumptions do not move in lockstep. However, this observation tells us much<br />
about the function of securities markets. Security markets – state-contingent claims – bring<br />
individual consumptions closer together by allowing people to share some risks. In addition,<br />
better risk sharing is much of the force behind financial innovation. Many successful new<br />
securities can be understood as devices to more widely share risks.<br />
3.5 State diagram and price function<br />
I introduce the state space diagram and inner product representation for prices, p(x) =<br />
E(mx) =m · x.<br />
p(x) =E(mx) implies p(x) is a linear function.<br />
Think of the contingent claims price pc and asset payoffs x as vectors in R S , where each<br />
element gives the price or payoff to the corresponding state,<br />
pc = £ pc(1) pc(2) ··· pc(S) ¤ 0 ,<br />
x = £ x(1) x(2) ··· x(S) ¤ 0 .<br />
Figure 7 is a graph of these vectors in R S . Next, I deduce the geometry of Figure 7.<br />
The contingent claims price vector pc points in to the positive orthant. We saw in section<br />
3.3 that m(s) =u 0 [c(s)]/u 0 (c). Now, marginal utility should always be positive (people<br />
always want more), so the marginal rate of substitution and discount factor are always nonnegative,<br />
m>0 and pc > 0. Don’t forget, m and pc are vectors, or random variables. Thus,<br />
m>0 means the realization of m is positive in every state of nature, or, equivalently every<br />
element of the vector m is positive.<br />
The set of payoffs with any given price lie on a (hyper)plane perpendicular to the contin-<br />
60
State 2<br />
Payoff<br />
SECTION 3.5 STATE DIAGRAM AND PRICE FUNCTION<br />
pc<br />
Riskfree rate<br />
Price = 0 (excess returns)<br />
Price = 1 (returns)<br />
State 1 contingent claim<br />
Price = 2<br />
Figure 7. Contingent claims prices (pc) and payoffs.<br />
State 1 Payoff<br />
gent claim price vector. We reasoned above that the price of the payoff x must be given by its<br />
contingent claim value (3.48),<br />
p(x) = X<br />
pc(s)x(s). (50)<br />
s<br />
Interpreting pc and x as vectors, this means that the price is given by the inner product of the<br />
contingent claim price and the payoff.<br />
If two vectors are orthogonal – if they point out from the origin at right angles to each<br />
other – then their inner product is zero. Therefore, the set of all zero price payoffs must lie<br />
on a plane orthogonal to the contingent claims price vector, as shown in figure 7.<br />
More generally, the inner product of two vectors x and pc equals the product of the magnitude<br />
of the projection of x onto pc times the magnitude of pc. Using a dot to denote inner<br />
product,<br />
p(x) = X<br />
pc(s)x(s) =pc · x = |pc|×|proj(x|pc)| = |pc|×|x|×cos(θ)<br />
s<br />
where |x| means the length of the vector x and θ is the angle between the vectors pc and<br />
x. Since all payoffs on planes (such as the price planes in figure 7) that are perpendicular<br />
to pc havethesameprojectionontopc, they must have the same price. (Only the price = 0<br />
plane is, strictly speaking, orthogonal to pc. Lacking a better term, I’ve called the nonzero<br />
61
CHAPTER 3 CONTINGENT CLAIMS MARKETS<br />
price planes “perpendicular” to pc.) When vectors are finite-dimensional, the prime notation<br />
is commonly used for inner products, pc0x. This notation does not extend well to infinitedimensional<br />
spaces. The notation hpc|xi is also often used for inner products.<br />
Planes of constant price move out linearly, and the origin x =0must have a price of<br />
zero. If payoff y =2x, then its price is twice the price of x,<br />
p(y) = X<br />
pc(s)y(s) = X<br />
pc(s)2x(s) =2p(x).<br />
s<br />
Similarly, a payoff of zero must have a price of zero.<br />
We can think of p(x) as a pricing function, a map from the state space or payoff space<br />
in which x lies (RS in this case) to the real line. We have just deduced from the definition<br />
(3.50) that p(x) is a linear function, i.e. that<br />
p(ax + by) =ap(x)+bp(y).<br />
The constant price lines in Figure 7 are of course exactly what one expects from a linear<br />
function from RS to R. (One might draw the price on the z axis coming out of the page.<br />
Then the price function would be a plane going through the origin and sloping up with isoprice<br />
lines as given in Figure 7.)<br />
Figure 7 also includes the payoffs to a contingent claim to the first state. This payoff is<br />
one in the first state and zero in other states and thus located on the axis. The plane of price<br />
= 1 payoffs is the plane of asset returns; the plane of price = 0 payoffs is the plane of excess<br />
returns. A riskfree unit payoff (the payoff to a risk-free pure discount bond) lies on the (1, 1)<br />
point in Figure 7; the riskfree return lies on the intersection of the 45o line (same payoff in<br />
both states) and the price = 1 plane (the set of all returns).<br />
Geometry with m in place of pc.<br />
The geometric interpretation of Figure 7 goes through with the discount factor m in the<br />
place of pc. We can define an inner product between the random variables x and y by<br />
s<br />
x · y ≡ E(xy),<br />
and retain all the mathematical properties of an inner product. For this reason, random variables<br />
for which E(xy) =0are often called “orthogonal.”<br />
This language may be familiar from linear regressions. When we run a regression of y on<br />
x,<br />
y = b 0 x + ε<br />
we find the linear combination of x that is “closest” to y, by minimizing the variance or “size”<br />
of the residual ε. We do this by forcing the residual to be “orthogonal” to the right hand variable<br />
E(xε) = 0. The projection of y on x is defined as the fitted value, proj(y|x) =<br />
62
SECTION 3.5 STATE DIAGRAM AND PRICE FUNCTION<br />
b 0 x =E(xx 0 ) −1 E(yx 0 )x. This ideal is often illustrated by a residual vector ε that is perpendicular<br />
to a plane definedbytherighthandvariablesx. Thus, when the inner product is<br />
defined by a second moment, the operation “project y onto x” isaregression. (If x does not<br />
include a constant, you don’t add one.)<br />
The geometric interpretation of Figure 7 also is valid if we generalize the setup to an<br />
infinite-dimensional state space, i.e. if we think of continuously-valued random variables.<br />
Instead of vectors, which are functions from R S to R, random variables are (measurable)<br />
functions from Ω to R. Nonetheless, we can still think of them as vectors. The equivalent<br />
of R s is now a Hilbert space L 2 , which denotes spaces generated by linear combinations<br />
of square integrable functions from Ω to the real line, or the space of random variables with<br />
finite second moments. We can still define an “inner product” between two such elements<br />
by x · y = E(xy), andp(x) =E(mx) can still be interpreted as “m is perpendicular to<br />
(hyper)planes of constant price.” Proving theorems in this context is a bit harder. You can’t<br />
just say things like “we can take a line perpendicular to any plane,” such things have to be<br />
proved. Sometimes, finite-dimensional thinking can lead you to errors, so it’s important to<br />
prove things the right way, keeping the finite dimensional pictures in mind for interpretation.<br />
Hansen and Richard (1987) is a very good reference for the Hilbert space machinery.<br />
63
Chapter 4. The discount factor<br />
Now we look more closely at the discount factor. Rather than derive a specific discount factor<br />
as with the consumption-based model in the last chapter, I work backwards. A discount factor<br />
is just some random variable that generates prices from payoffs, p = E(mx). What does this<br />
expression mean? Can one always find such a discount factor? Can we use this convenient<br />
representation without implicitly assuming all the structure of the investors, utility functions,<br />
complete markets, and so forth?<br />
The chapter focuses on two famous theorems. The law of one price states that if two<br />
portfolios have the same payoffs (in every state of nature), then they must have the same<br />
price. A violation of this law would give rise to an immediate kind of arbitrage profit, as you<br />
could sell the expensive version and buy the cheap version of the same portfolio. The first<br />
theorem states that there is a discount factor that prices all the payoffs by p = E(mx) if and<br />
only if this law of one price holds.<br />
In finance, we reserve the term absence of arbitrage for a stronger idea, that if payoff A<br />
is always at least as good as payoff B, and sometimes A is better, then the price of A must<br />
be greater than the price of B. The second theorem is that there is a positive discount factor<br />
that prices all the payoffs by p = E(mx) if and only if there are no arbitrage opportunities,<br />
so defined.<br />
These theorems are useful to show that we can use stochastic discount factors without<br />
implicitly assuming anything about utility functions, aggregation, complete markets and so<br />
on. All we need to know about investors in order to represent prices and payoffs via a discount<br />
factor is that they won’t leave law of one price violations or arbitrage opportunities on the<br />
table. These theorems can be used to describe aspects of a payoff space (such as law of one<br />
price, absence of arbitrage) by restrictions on the discount factor (such as it exists and it is<br />
positive). Chapter 18 shows how it can be more convenient to impose and check restrictions<br />
on a single discount factor than it is to check the corresponding restrictions on all possible<br />
portfolios. Chapter 7 discusses these and other implications of the existence theorems.<br />
The theorems are credited to Ross (1978), and Harrison and Kreps (1979). My presentation<br />
follows Hansen and Richard (1987).<br />
4.1 Law of one price and existence of a discount factor<br />
Definition of law of one price; price is a linear function.<br />
p = E(mx) implies law of one price.<br />
The law of one price implies that a discount factor exists: There exists a unique x∗ in X<br />
such that p = E(x∗x) for all x ∈ X = space of all available payoffs.<br />
64
SECTION 4.1 LAW OF ONE PRICE AND EXISTENCE OF A DISCOUNT FACTOR<br />
Furthermore, for any valid discount factor m,<br />
x ∗ = proj(m | X).<br />
So far we have derived the basic pricing relation p = E(mx) from environments with a<br />
lot of structure: either the consumption-based model or complete markets.<br />
Suppose we observe a set of prices p and payoffs x, and that markets — either the markets<br />
faced by investors or the markets under study in a particular application — are incomplete,<br />
meaning they do not span the entire set of contingencies. In what minimal set<br />
of circumstances does some discount factor exists which represents the observed prices by<br />
p = E(mx)? This section and the following answer this important question. This treatment<br />
is a simplified version of Hansen and Richard (1987), which contains rigorous proofs and<br />
some technical assumptions.<br />
Payoff space<br />
The payoff space X is the set (or a subset) of all the payoffs that investors can purchase,<br />
or it is a subset of the tradeable payoffs that is used in a particular study. For example, if there<br />
are complete contingent claims to S states of nature, then X = RS . But the whole point is<br />
that markets are (as in real life) incomplete, so we will generally think of X as a proper subset<br />
of complete markets RS .<br />
The payoff space will include some set of primitive assets, but investors can also form<br />
new payoffs by forming portfolios. I assume that investors can form any portfolio of traded<br />
assets:<br />
A1: (Portfolio formation) x1,x2 ∈ X ⇒ ax1 + bx2 ∈ X for any real a, b.<br />
Of course, X = RS for complete markets satisfies the portfolio formation assumption. If<br />
there is a single basic payoff x, then the payoff space must be at least the ray from the origin<br />
through x. If there are two basic payoffs in R3 , then the payoff space X must include the<br />
plane defined by these two payoffs and the origin. Figure 8 illustrates these possibilities.<br />
The payoff space is not the space of returns. The return space is a subset of the payoff<br />
space; if a return R is in the payoff space, then you can pay a price $2 to get a payoff 2R,so<br />
the payoff 2R with price 2 is also in the payoff space. Also, −R is in the payoff space.<br />
Free portfolio formation is in fact an important and restrictive simplifying assumption. It<br />
rules out short sales constraints, bid/ask spreads, leverage limitations and so on. The theory<br />
can be modified to incorporate these frictions, but it is a substantial modification.<br />
If investors can form portfolios of a vector of basic payoffs x (say, the returns on the<br />
NYSE stocks), then the payoff space consists of all portfolios or linear combinations of these<br />
original payoffs X = {c0x} where c is a vector of portfolio weights. We also can allow truly<br />
infinite-dimensional payoff spaces. For example, investors might be able to trade nonlinear<br />
65
State 2<br />
CHAPTER 4 THE DISCOUNT FACTOR<br />
x<br />
Single Payoff in R 2<br />
X<br />
State 1<br />
State 2<br />
x 2<br />
State 3 (into page)<br />
Two Payoffs in R 3<br />
Figure 8. Payoff spaces X generated by one (left) and two (right) basis payoffs.<br />
x 1<br />
State 1<br />
functions of a basis payoff x, such as call options on x with strike price K, which have payoff<br />
max [x(s) − K, 0] .<br />
The law of one price.<br />
A2: (Law of one price, linearity) p(ax1 + bx2) =ap(x1)+bp(x2)<br />
It doesn’t matter how one forms the payoff x. The price of a burger, shake and fries must<br />
be the same as the price of a happy meal. Graphically, if the iso-price curves were not planes,<br />
then one could buy two payoffs on the same iso-price curve, form a portfolio whose payoff<br />
is on the straight line connecting the two original payoffs, and sell the portfolio for a higher<br />
price than it cost to assemble it.<br />
The law of one price basically says that investors can’t make instantaneous profits by<br />
repackaging portfolios. If investors can sell securities, this is a very weak characterization<br />
of preferences. It says there is at least one investor for whom marketing doesn’t matter, who<br />
values a package by its contents. The law is meant to describe a market that has already<br />
reached equilibrium. If there are any violations of the law of one price, traders will quickly<br />
eliminate them so they can’t survive in equilibrium.<br />
A1 and A2 also mean that the 0 payoff must be available, and must have price 0.<br />
The Theorem<br />
The existence of a discount factor implies the law of one price. This is obvious to the<br />
point of triviality: if x = y + z then E(mx) =E[m(y + z)]. The hard, and interesting part<br />
of the theorem reverses this logic. We show that the law of one price implies the existence of<br />
a discount factor.<br />
66
SECTION 4.1 LAW OF ONE PRICE AND EXISTENCE OF A DISCOUNT FACTOR<br />
Theorem: Given free portfolio formation A1, and the law of one price A2, there<br />
exists a unique payoff x ∗ ∈ X such that p(x) =E(x ∗ x) for all x ∈ X.<br />
x∗ is a discount factor. A1 and A2 imply that the price function on X looks like Figure<br />
7: parallel hyperplanes marching out from the origin. The only difference is that X may be a<br />
subspace of the original state space, as shown in Figure 8. The essence of the proof, then, is<br />
that any linear function on a space X can be represented by inner products with a vector that<br />
lies in X.<br />
Proof 1: (Geometric.) We have established that the price is a linear function as shown<br />
in Figure 9. (Figure 9 can be interpreted as the plane X of a larger dimensional space as in<br />
the right hand panel of Figure 8, laid flat on the page for clarity.) Now we can draw a line<br />
from the origin perpendicular to the price planes. Choose a vector x∗on this line. Since the<br />
line is orthogonal to the price zero plane we have 0=p(x) =E(x∗x) for price zero payoffs<br />
x immediately. The inner product between any payoff x on the price = 1 plane and x∗ is<br />
|proj(x|x∗ )|×|x∗ | Thus, every payoff on the price = 1 plane has the same inner product<br />
with x∗ . All we have to do is pick x∗ to have the right length, and we obtain p(x) =1=<br />
E(x∗x) for every x on the price = 1 plane. Then, of course we have p(x) =E(x∗x) for<br />
payoffs x on the other planes as well. Thus, the linear pricing function implied by the Law<br />
of One Price can be represented by inner products with x∗ . ¤<br />
x*<br />
Price = 1 (returns)<br />
Price = 0 (excess returns)<br />
Figure 9. Existence of a discount factor x ∗ .<br />
Price = 2<br />
The basic mathematical point is just that any linear function can be represented by an<br />
67
CHAPTER 4 THE DISCOUNT FACTOR<br />
inner product. The the Riesz representation theorem extends the proof to infinite-dimensional<br />
payoff spaces. See Hansen and Richard (1987).<br />
Proof 2: (Algebraic.) We can prove the theorem by construction when the payoff space<br />
X is generated by portfolios of a N basis payoffs (for example, N stocks). This is a common<br />
situation, so the formulas are also useful in practice. Organize the basis payoffs into a vector<br />
x = £ x1 x2 ... xN<br />
¤ 0 and similarly their prices p. The payoff space is then X = {c 0 x}.<br />
We want a discount factor that is in the payoff space, as the theorem requires. Thus, it must be<br />
of the form x ∗ = c 0 x. Construct c so that x ∗ prices the basis assets. We want p =E(x ∗ x)=<br />
E(xx 0 c). Thus we need c = E(xx 0 ) −1 p.IfE(xx 0 ) is nonsingular, this c exists and is unique.<br />
A2 implies that E(xx 0 ) is nonsingular (after pruning redundant rows of x). Thus,<br />
x ∗ = p 0 E(xx 0 ) −1 x (51)<br />
is our discount factor. It is a linear combination of x so it is in X. It prices the basis assets<br />
x by construction. It prices every x ∈ X : E[x ∗ (x 0 c)] = E[p 0 E(xx 0 ) −1 xx 0 c]=p 0 c. By<br />
linearity, p(c 0 x)=c 0 p.<br />
What the theorem does and does not say<br />
The theorem says there is a unique x∗ in X. There may be many other discount factors<br />
m not in X. In fact, unless markets are complete, there are an infinite number of random<br />
variables that satisfy p = E(mx). Ifp = E(mx) then p = E [(m + ε)x] for any ε orthogonal<br />
to x, E(εx) =0.<br />
Not only does this construction generate some additional discount factors, it generates<br />
all of them: Any discount factor m (any random variable that satisfies p = E(mx)) can be<br />
represented as m = x∗ +ε with E(εx) =0. Figure 10 gives an example of a one-dimensional<br />
X in a two-dimensional state space, in which case there is a whole line of possible discount<br />
factors m. If markets are complete, there is nowhere to go orthogonal to the payoff space X,<br />
so x∗ is the only possible discount factor.<br />
Reversing the argument, x∗ is the projection of any stochastic discount factor m on the<br />
space X of payoffs. This is a very important fact: the pricing implications of any discount<br />
factor m forasetofpayoffsXarethe same as those of the projection of m on X. This<br />
discount factor is known as the mimicking portfolio for m. Algebraically,<br />
p = E(mx) =E [(proj(m|X)+ε)x] =E [proj(m|X) x]<br />
Let me repeat and emphasize the logic. Above, we started with investors or a contingent<br />
claim market, and derived a discount factor. p = E(mx) implies the linearity of the pricing<br />
function and hence the law of one price, a pretty obvious statement in those contexts. Here<br />
we work backwards. Markets are incomplete in that contingent claims to lots of states of<br />
nature are not available. We found that the law of one price implies a linear pricing function,<br />
and a linear pricing function implies that there exists at least one and usually many discount<br />
factors.<br />
68
SECTION 4.2 NO-ARBITRAGE AND POSITIVE DISCOUNT FACTORS<br />
x *<br />
Payoff space X<br />
m = x * + ε space of discount factors<br />
Figure 10. Many discount facotors m can price a given set of assets in incomplete markets.<br />
We do allow arbitrary portfolio formation, and that sort of “completeness” is important<br />
to the result. If investors cannot form a portfolio ax + by, they cannot force the price of this<br />
portfolio to equal the price of its constituents. The law of one price is not innocuous; it is an<br />
assumption about preferences albeit a weak one. The point of the theorem is that this is just<br />
enough information about preferences to deduce the existence of a discount factor.<br />
4.2 No-Arbitrage and positive discount factors<br />
The definition of arbitrage: positive payoff implies positive price.<br />
There is a strictly positive discount factor m such that p = E(mx) ifandonlyifthereare<br />
no arbitrage opportunities.<br />
No arbitrage is another, slightly stronger, implication of marginal utility, that can be reversed<br />
to show that there is a positive discount factor. We need to start with the definition of<br />
arbitrage:<br />
Definition (Absence of arbitrage): A payoff space X and pricing function p(x) leave<br />
no arbitrage opportunities if every payoff x that is always non-negative, x ≥ 0<br />
(almost surely), and positive, x>0, with some positive probability, has positive<br />
69
price, p(x) > 0.<br />
CHAPTER 4 THE DISCOUNT FACTOR<br />
No-arbitrage says that you can’t get for free a portfolio that might pay off positively, but<br />
will certainly never cost you anything. This definition is different from the colloquial use of<br />
the word “arbitrage.” Most people use “arbitrage” to mean a violation of the law of one price<br />
– a riskless way of buying something cheap and selling it for a higher price. “Arbitrages” here<br />
might pay off, but then again they might not. The word “arbitrage” is also widely abused.<br />
“Risk arbitrage” is a Wall Street oxymoron that means making specific kinds of bets.<br />
An equivalent statement is that if one payoff dominates another, then its price must be<br />
higher – if x ≥ y, then p(x) ≥ p(y) (Or, a bit more carefully but more long-windedly, if<br />
x ≥ y almost surely and x>ywith positive probability, then p(x) >p(y). You can’t forget<br />
that x and y are random variables.)<br />
m>0 ⇒No-arbitrage<br />
The absence of arbitrage opportunities is clearly a consequence of a positive discount<br />
factor, and a positive discount factor naturally results from any sort of utility maximization.<br />
Recall,<br />
m(s) =β u0 [c(s)]<br />
u 0 (c)<br />
It is a sensible characterization of preferences that marginal utility is always positive. Few<br />
people are so satiated that they will throw away money. Therefore, the marginal rate of<br />
substitution is positive. The marginal rate of substitution is a random variable, so “positive”<br />
means “positive in every state of nature” or “in every possible realization.”<br />
Now, if contingent claims prices are all positive, a bundle of positive amounts of contingent<br />
claims must also have a positive price, even in incomplete markets. A little more<br />
formally,<br />
> 0.<br />
Theorem: p = E(mx) and m(s) > 0 imply no-arbitrage.<br />
Proof: m>0; x ≥ 0 and there are some states where x>0. Thus, in some states<br />
mx > 0 and in other states mx =0. Therefore E(mx) > 0. ¤<br />
No arbitrage ⇒ m>0<br />
Now we turn the observation around, which is again the hard and interesting part. As<br />
the law of one price property guaranteed the existence of a discount factor m, no-arbitrage<br />
guarantees the existence of a positive m.<br />
The basic idea is pretty simple. No-arbitrage means that the prices of any payoff in the<br />
positive orthant (except zero, but including the axes) must be strictly positive. The price =<br />
70
SECTION 4.2 NO-ARBITRAGE AND POSITIVE DISCOUNT FACTORS<br />
0 plane divides the region of positive prices from the region of negative prices. Thus, if the<br />
region of negative prices is not to intersect the positive orthant, the iso-price lines must march<br />
up and to the right, and the discount factor m, must point up and to the right. This is how<br />
we have graphed it all along, most recently in figure 9. Figure 11 illustrates the case that is<br />
ruled out: a whole region of negative price payoffs lies in the positive orthant. For example,<br />
the payoff x is strictly positive, but has a negative price. As a result, the (unique, since this<br />
market is complete) discount factor m is negative in the y-axis state.<br />
x * , m<br />
x<br />
p = -1<br />
p = 0<br />
p = +1<br />
Figure 11. Counter-example for no-arbitrage ⇒ m>0 theorem. The payoff x is positive,<br />
but has negative price. The discount factor is not strictly positive<br />
The theorem is easy to prove in complete markets. There is only one m, x ∗ .Ifitisn’t<br />
positive in some state, then the contingent claim in that state has a positive payoff and a<br />
negative price, which violates no arbitrage. More formally,<br />
Theorem: In complete markets, no-arbitrage implies that there exists a unique m><br />
0 such that p = E(mx).<br />
Proof: No-arbitrage implies the law of one price, so there is an x ∗ such that p =<br />
E(x ∗ x), and in a complete market this is the unique discount factor. Suppose that<br />
x ∗ ≤ 0 for some states. Then, form a payoff x that is 1 in those states, and zero<br />
elsewhere. This payoff is strictly positive, but its price, P<br />
s:x ∗ (s)
CHAPTER 4 THE DISCOUNT FACTOR<br />
negative, negating the assumption of no-arbitrage. ¤<br />
The tough part comes if markets are incomplete. There are now many m’s that price<br />
assets. Any m of the form m = x ∗ + ², with E(²x) =0will do. We want to show that at<br />
least one of these is positive. But that one may not be x ∗ . Since the discount factors other<br />
than x ∗ are not in the payoff space X, we can’t use the construction of the last argument,<br />
since that construction may yield a payoff that is not in X, and hence to which we don’t<br />
know how to assign a price. To handle this case, I adopt a different strategy of proof. (This<br />
strategy is due to Ross 1978. Duffie 1992 has a more formal textbook treatment.) The basic<br />
idea is another “to every plane there is a perpendicular line” argument, but applied to a space<br />
that includes prices and payoffs together. As you can see, the price = 0 plane is a separating<br />
hyperplane between the positive orthant and the negative payoffs, and the proof builds on this<br />
idea.<br />
Theorem: No arbitrage implies the existence of a strictly positive discount factor,<br />
m>0,p= E(mx) ∀ x ∈ X.<br />
Proof : Join (−p(x),x) together to form vectors in R S+1 . Call M the set of all<br />
(−p(x), x) pairs,<br />
M = {(−p(x),x); x ∈ X}<br />
M is still a linear space: m1 ∈ M, m2 ∈ M ⇒ am1 + bm2 ∈ M. No-arbitrage<br />
meansthatelementsofM can’t have all positive elements. If x is positive, −p(x)<br />
must be negative. Thus, M is a hyperplane that only intersects the positive orthant<br />
R S+1<br />
+ at the point 0. We can then create a linear function F : RS+1 ⇒ R such that<br />
F (−p, x) =0for (−p, x) ∈ M, andF (−p, x) > 0 for (−p, x) ∈ R S+1<br />
+ except<br />
the origin. Since we can represent any linear function by a perpendicular vector,<br />
there is a vector (1,m) such that F (−p, x) =(1,m) · (−p, x) =−p + m · x or<br />
−p + E(mx) using the second moment inner product. Finally, since F (−p, x) is<br />
positive for (−p, x) > 0,mmust be positive.<br />
¤<br />
In a larger space than R S+1<br />
+ , as generated by continuously valued random variables, the<br />
separating hyperplane theorem assures us that there is a linear function that separates the two<br />
convex sets M and the equivalent of R S+1<br />
+ , and the Riesz representation theorem tells us that<br />
we can represent F as an inner product with some vector by F (−p, x) =−p + m · x.<br />
What the theorem does and does not say<br />
The theorem says that a discount factor m>0 exists, but it does not say that m>0 is<br />
unique. The left hand panel of Figure <strong>12</strong> illustrates the situation. Any m on the line through<br />
x ∗ perpendicular to X also prices assets. Again, p = E[(m + ε)x] if E(εx) =0. All of<br />
these discount factors that lie in the positive orthant are positive, and thus satisfy the theorem.<br />
There are lots of them! In a complete market, m is unique, but not otherwise.<br />
72
SECTION 4.2 NO-ARBITRAGE AND POSITIVE DISCOUNT FACTORS<br />
The theorem says that a positive m exists, but it also does not say that every discount<br />
factor m must be positive. The discount factors in the left hand panel of Figure <strong>12</strong> outside the<br />
positive orthant are perfectly valid – they satisfy p = E(mx), and the prices they generate<br />
on X are arbitrage free, but they are not positive in every state of nature. In particular, the<br />
discount factor x ∗ in the payoff space is still perfectly valid — p(x) =E(x ∗ x) — but it need<br />
not be positive, again as illustrated in the left hand panel of Figure <strong>12</strong>.<br />
x *<br />
m > 0<br />
p = 1<br />
X<br />
p = 2<br />
Figure <strong>12</strong>. Existence of a discount factor and extensions. The left graph shows that the<br />
positive discount factor is not unique, and that discount factors may also exist that are not<br />
strictly positive. In particular, x ∗ need not be positive. The right hand graph shows that<br />
each particular choice of m>0 induces an arbitrage free extension of the prices on X to all<br />
contingent claims.<br />
This theorem shows that we can extend the pricing function defined on X to all possible<br />
payoffs RS , and not imply any arbitrage opportunities on that larger space of payoffs. It says<br />
that there is a pricing function p(x) defined over all of RS , that assigns the same (correct, or<br />
observed) prices on X and that displays no arbitrage on all of RS . Graphically, it says that<br />
we can draw parallel planes to represent prices on all of RS in such a way that the planes<br />
intersect X in the right places, and the price planes march up and to the right so the positive<br />
orthant always has positive prices. Any positive m generates such a no-arbitrage extension,<br />
as illustrated in the right hand panel of Figure <strong>12</strong>. In fact, there are many ways to do this.<br />
Each different choice of m>0 generates a different extension of the pricing function.<br />
We can think of strictly positive discount factors as possible contingent claims prices.<br />
We can think of the theorem as answering the question: is it possible that an observed and<br />
incomplete set of prices and payoffs is generated by some complete markets, contingent claim<br />
economy? The answer is, yes, if there is no arbitrage on the observed prices and payoffs. In<br />
fact, since there are typically many positive m’s consistent with a {X, p(x)}, thereexist<br />
73<br />
p = 1<br />
x *<br />
p = 2<br />
m<br />
X
CHAPTER 4 THE DISCOUNT FACTOR<br />
many contingent claims economies consistent with our observations.<br />
Finally, the absence of arbitrage is another very weak characterization of preferences. The<br />
theorem tells us that this is enough to allow us to use the p = E(mx) formalism with m>0.<br />
As usual, this theorem and proof do not require that the state space is RS . State spaces<br />
generated by continuous random variables work just as well.<br />
4.3 An alternative formula, and x ∗ in continuous time<br />
In terms of the covariance matrix of payoffs,<br />
Just like x ∗ in discrete time,<br />
x ∗ = E(x ∗ )+[p−E(x ∗ )E(x)] 0 Σ −1 (x−E(x)).<br />
dΛ ∗<br />
Λ ∗ = −rf dt −<br />
prices assets by construction in continuous time.<br />
µ<br />
µ + D<br />
0<br />
− r Σ<br />
p −1 dz.<br />
Being able to compute x∗ is useful in many circumstances. This section gives an alternative<br />
formula in discrete time, and the continuous time counterpart.<br />
A formula that uses covariance matrices<br />
E(xx0 ) in our previous formula (4.51) is a second moment matrix. We typically summarize<br />
data in terms of covariance matrices instead. Therefore, a convenient alternative formula<br />
is<br />
where<br />
x ∗ = E(x ∗ )+[p−E(x ∗ )E(x)] 0 Σ −1 (x−E(x)) (52)<br />
Σ ≡ E ¡ [x−E(x)] [x−E(x)] 0¢<br />
denotes the covariance matrix of the x payoffs. (We could just substitute E(xx 0 )=Σ +<br />
E(x)E(x 0 ), but the inverse of the sum is not very useful.) We can derive this formula by<br />
postulating a discount factor that is a linear function of the shocks to the payoffs,<br />
x ∗ = E(x ∗ )+(x−E(x)) 0 b,<br />
and then finding b to ensure that x ∗ prices the assets x :<br />
p = E(x ∗ )E(x)+E £ (x−Ex)x 0¤ b<br />
74
so<br />
SECTION 4.3 AN ALTERNATIVE FORMULA, AND X ∗ IN CONTINUOUS TIME<br />
b = Σ −1 [p−E(x ∗ )E(x)] .<br />
Ifariskfreerateistraded,thenweknowE(x ∗ )=1/R f . If a riskfree rate is not traded –<br />
if 1 is not in X – then this formula does not necessarily produce a discount factor x ∗ that is<br />
in X. In many applications, however, all that matters is producing some discount factor, and<br />
the arbitrariness of the risk-free or zero beta rate is not a problem.<br />
This formula is particularly useful when the payoff space consists solely of excess returns<br />
or price-zero payoffs. In that case, x ∗ = p 0 E(xx 0 ) −1 x gives x ∗ =0. x ∗ =0is in fact the<br />
only discount factor in X that prices all the assets, but in this case it’s more interesting (and<br />
avoids 1/0 difficulties when we want to transform to expected return/beta or other representations)<br />
to pick a discount factor not in X by picking a zero-beta rate or price of the riskfree<br />
payoff. In the case of excess returns, for arbitrarily chosen R f , then, (4.52) gives us<br />
x ∗ = 1 1<br />
−<br />
Rf Rf E(Re ) 0 Σ −1 (R e −E(R e )); Σ ≡ cov(R e )<br />
Continuous time<br />
The law of one price implies the existence of a discount factor process, and absence of<br />
arbitrage a positive discount factor process in continuous time as well as discrete time. At<br />
one level, this statement requires no new mathematics. If we reinvest dividends for simplicity,<br />
then a discount factor must satisfy<br />
ptΛt = Et (Λt+spt+s) .<br />
Calling pt+s = xt+s, this is precisely the discrete time p = E(mx) that we have studied all<br />
along. Thus, the law of one price or absence of arbitrage are equivalent to the existence of a<br />
or a positive Λt+s. The same conditions at all horizons s are thus equivalent to the existence<br />
of a discount factor process, or a positive discount factor process Λt for all time t.<br />
For calculations it is useful to find explicit formulas for a discount factors. Suppose a set<br />
of securities pays dividends<br />
and their prices follow<br />
Dtdt<br />
dpt<br />
= µ tdt + σtdzt<br />
pt<br />
where p and z are N × 1 vectors, µ t and σtmay vary over time, µ(pt ,t,other variables),<br />
E (dztdz0 t)=I and the division on the left hand side is element-by element. (As usual, I’ll<br />
drop the t subscripts when not necessary for clarity, but everything can vary over time.)<br />
We can form a discount factor that prices these assets from a linear combination of the<br />
75
CHAPTER 4 THE DISCOUNT FACTOR<br />
shocks that drive the original assets,<br />
dΛ∗ Λ∗ = −rf µ<br />
dt − µ + D<br />
0<br />
− rf Σ<br />
p −1 σdz. (53)<br />
where Σ ≡ σσ0 again is the covariance matrix of returns. You can easily check that this<br />
equation solves<br />
and<br />
Et<br />
µ <br />
dp<br />
+<br />
p<br />
D<br />
p dt − rf µ ∗ dΛ<br />
dt = −Et<br />
Λ∗ Et<br />
µ ∗ dΛ<br />
= −r f dt,<br />
Λ ∗<br />
<br />
dp<br />
p<br />
or you can show that this is the only diffusion driven by dz, dt with these properties. If there<br />
is a risk free rate r f<br />
t<br />
(54)<br />
(also potentially time-varying), then that rate determines rf<br />
t .Ifthereis<br />
no risk free rate, (4.53) will price the risky assets for any arbitrary (or convenient) choice of<br />
r f<br />
t . As usual, this discount factor is not unique; Λ∗ plus orthogonal noise will also act as a<br />
discount factor:<br />
dΛ<br />
Λ<br />
dΛ∗<br />
= + dw; E(dw) =0; E(dzdw) =0.<br />
Λ∗ You can see that (4.53) is exactly analogous to the discrete time formula (4.52). (If you don’t<br />
like answers popping out of hats like this, guess a solution of the form<br />
dΛ<br />
Λ = µ Λdt + σΛdz.<br />
Then find µ Λ and σΛ to satisfy (4.54) for the riskfree and risky assets.)<br />
4.4 Problems<br />
1. Show that the law of one price loop implies that price is a linear function of payoff and<br />
vice versa<br />
2. Does the absence of arbitrage imply the law of one price? Does the law of one price<br />
imply the absence of arbitrage? Answer directly using portfolio arguments, and indirectly<br />
using the corresponding discount factors.<br />
3. If the law of one price or absence of arbitrage hold in population, must they hold in a<br />
sample drawn from that population?<br />
76
Chapter 5. Mean-variance frontier and<br />
beta representations<br />
Much empirical work in asset pricing is couched in terms of expected return - beta representations<br />
and mean-variance frontiers. This chapter introduces expected return - beta representations<br />
and mean-variance frontiers.<br />
I discuss here the beta representation, most commonly applied to factor pricing models.<br />
Chapter 6 shows how an expected return/beta model is equivalent to a linear model for the<br />
discount factor, i.e. m = b0f where f are the right hand variables in the time-series regressions<br />
that define betas. Chapter 9 then discusses the derivation of popular factor models such<br />
as the CAPM, ICAPM and APT, i.e. under what assumptions the discount factor is a linear<br />
function of other variables f such as the market return.<br />
I summarize the classic Lagrangian approach to the mean-variance frontier. I then introduce<br />
a powerful and useful representation of the mean-variance frontier due to Hansen and<br />
Richard (1987). This representation uses the state-space geometry familiar from the existence<br />
theorems. It is also useful because it is valid and useful in infinite-dimensional payoff spaces,<br />
which we shall soon encounter when we add conditioning information, dynamic trading or<br />
options.<br />
5.1 Expected return - Beta representations<br />
The expected return-beta expression of a factor pricing model is<br />
E(R i )=α + β i,aλa + β i,bλb + ...<br />
The model is equivalent to a restriction that the intercept is the same for all assets in<br />
time-series regressions.<br />
When the factors are returns excess returns, then λa = E(f a ). If the test assets are also<br />
excess returns, then the intercept should be zero, α =0.<br />
Much empirical work in finance is cast in terms of expected return - beta representations<br />
of linear factor pricing models, of the form<br />
E(R i )=α + β i,aλa + β i,bλb + ... , i=1, 2, ...N. (55)<br />
77
CHAPTER 5 MEAN-VARIANCE FRONTIER AND BETA REPRESENTATIONS<br />
The β terms are defined as the coefficients in a multiple regression of returns on factors,<br />
R i t = ai + β i,af a t + β i,bf b t + ...+ ε i t; t =1, 2, ...T. (56)<br />
This is often called a time-series regression, since one runs a regression across time for each<br />
security i. The “factors” f are proxies for marginal utility growth. I discuss the stories used<br />
to select factors at some length in chapter 9. For the moment keep in mind the canonical ex-<br />
amples, f = consumption growth, or f = the return on the market portfolio (CAPM). Notice<br />
that we run returns R i t on contemporaneous factors f j<br />
t . This regression is not about predicting<br />
returns from variables seen ahead of time. Its objective is to measure contemporaneous<br />
relations or risk exposure; whether returns are typically high in “good times” or “bad times”<br />
as measured by the factors.<br />
The point of the beta model(5.55) is to explain the variation in average returns across<br />
assets. I write i =1, 2, ...N in (5.55) to emphasize this fact. The model says that assets with<br />
higher betas should get higher average returns. Thus the betas in (5.55) are the explanatory (x)<br />
variables, which vary asset by asset. The α and λ – common for all assets – are the intercept<br />
and slope in this cross-sectional relation. For example, equation (5.55) says that if we plot<br />
expected returns versus betas in a one-factor model, we should expect all (E(Ri ), βi,a) pairs<br />
to line up on a straight line with slope λa and intercept α.<br />
βi,a is interpreted as the amount of exposure of asset i to factor a risks, and λa is interpreted<br />
as the price of such risk-exposure. Read the beta pricing model to say: “for each unit<br />
of exposure β to risk factor a, you must provide investors with an expected return premium<br />
λa.” <strong>Asset</strong>s must give investors higher average returns (low prices) if they pay off well in<br />
times that are already good, and pay off poorly in times that are already bad, as measured by<br />
the factors.<br />
One way to estimate the free parameters (α, λ) and to test the model (5.55) is to run a<br />
cross sectional regression of average returns on betas,<br />
E(R i )=α + β i,aλa + β i,bλb + ...+ αi, i=1, 2, ...N. (57)<br />
Again, the βi are the right hand variables, and the α and λ are the intercept and slope coefficients<br />
that we estimate in this cross-sectional regression. The errors αi are pricing errors.<br />
The model predicts αi =0, and they should be statistically insignificant in a test. (I intentionally<br />
use the same symbol for the intercept, or mean of the pricing errors, and the individual<br />
pricing errors αi.) In the chapters on empirical technique, we will see test statistics based on<br />
the sum of squared pricing errors.<br />
The fact that the betas are regression coefficients is crucially important. If the betas are<br />
also free parameters then there is no content to the equation. More importantly (and this is<br />
an easier mistake to make), the betas cannot be asset-specificorfirm-specific characteristics,<br />
such as the size of the firm, book to market ratio, or (to take an extreme example) the letter of<br />
the alphabet of its ticker symbol. It is true that expected returns are associated with or correlated<br />
with many such characteristics. Stocks of small companies or of companies with high<br />
78
SECTION 5.1 EXPECTED RETURN -BETA REPRESENTATIONS<br />
book/market ratios do have higher average returns. But this correlation must be explained by<br />
some beta. The proper betas should drive out any characteristics in cross-sectional regressions.<br />
If, for example, expected returns were truly related to size, one could buy many small<br />
companies to form a large holding company. It would be a “large” company, and hence pay<br />
low average returns to the shareholders, while earning a large average return on its holdings.<br />
The managers could enjoy the difference. What ruins this promising idea? . The “large”<br />
holding company will still behave like a portfolio of small stocks. Thus, only if asset returns<br />
depend on how you behave, notwho you are – on betas rather than characteristics – can a<br />
market equilibrium survive such simple repackaging schemes.<br />
Some common special cases<br />
If there is a risk free rate, its betas in (5.55) are all zero, 2 so the intercept is equal to the<br />
risk free rate,<br />
R f = α.<br />
We can impose this condition rather than estimate α in the cross-sectional regression (5.57).<br />
If there is no risk-free rate, then α must be estimated in the cross-sectional regression. Since<br />
it is the expected return of a portfolio with zero betas on all factors, α is called the (expected)<br />
zero-beta rate in this circumstance.<br />
We often examine factor pricing models using excess returns directly. (There is an implicit,<br />
though not necessarily justified, division of labor between models of interest rates and<br />
models of equity risk premia.) Differencing (5.55) between any two returns Rei = Ri − Rj (Rj does not have to be risk free), we obtain<br />
E(R ei )=β i,aλa + β i,bλb + ... , i=1, 2, ...N. (58)<br />
Here, βia represents the regression coefficient of the excess return Rei on the factors.<br />
It is often the case that the factors are also returns or excess returns. For example, the<br />
CAPM uses the return on the market portfolio as the single factor. In this case, the model<br />
should apply to the factors as well, and this fact allows us to directly measure the λ coefficients.<br />
Each factor has beta of one on itself and zero on all the other factors, of course.<br />
Therefore, if the factors are excess returns, we have E(f a )=λa, and so forth. We can then<br />
write the factor model as<br />
E(R ei )=β i,a E(f a )+β i,b E(f b )+... , i=1, 2, ...N.<br />
The cross-sectional beta pricing model (5.55)-(5.58) and the time-series regression definition<br />
of the betas in (5.56) look very similar. It seems that one can take expectations of<br />
2 The betas are zero because the risk free rate is known ahead of time. When we consider the effects of<br />
conditioning information, i.e. that the interest rate could vary over time, we have to interpret the means and betas as<br />
conditional moments. Thus, if you are worried about time-varying risk free rates, betas, and so forth, either assume<br />
all variables are i.i.d. (and thus that the risk free rate is constant), or interpret all moments as conditional on time<br />
t information.<br />
79
CHAPTER 5 MEAN-VARIANCE FRONTIER AND BETA REPRESENTATIONS<br />
the time-series regression (5.56) and arrive at the beta model (5.55), in which case the latter<br />
would be vacuous since one can always run a regression of anything on anything. The difference<br />
is subtle but crucial: the time-series regressions (5.56) will in general have a different<br />
intercept ai for each return i, while the intercept α is the same for all assets in the beta pricing<br />
equation (5.55). The beta pricing equation is a restriction on expected returns, and thus<br />
imposes a restriction on intercepts in the time-series regression.<br />
In the special case that the factors are themselves excess returns, the restriction is particularly<br />
simple: the time-series regression intercepts should all be zero. In this case, we can<br />
avoid the cross-sectional regression entirely, since there are no free parameters left.<br />
5.2 Mean-variance frontier: Intuition and Lagrangian<br />
characterization<br />
The mean-variance frontier of a given set of assets is the boundary of the set of means and<br />
variances of the returns on all portfolios of the given assets. One can find or define this boundary<br />
by minimizing return variance for a given mean return. Many asset pricing propositions<br />
and test statistics have interpretations in terms of the mean-variance frontier.<br />
Figure 13 displays a typical mean-variance frontier. As displayed in Figure 13, it is common<br />
to distinguish the mean-variance frontier of all risky assets, graphed as the hyperbolic<br />
region, and the mean-variance frontier of all assets, i.e. including a risk free rate if there is<br />
one, which is the larger wedge-shaped region. Some authors reserve the terminology “meanvariance<br />
frontier” for the upper portion, calling the whole thing the minimum variance frontier.<br />
The risky asset frontier is a hyperbola, which means it lies between two asymptotes,<br />
shown as dotted lines. The risk free rate is typically drawn below the intersection of the<br />
asymptotes and the vertical axis, or the point of minimum variance on the risky frontier. If it<br />
were above this point, investors with a mean-variance objective would try to short the risky<br />
assets, which cannot represent an equilibrium.<br />
In general, portfolios of two assets or portfolios fill out a hyperbolic curve through the<br />
two assets. The curve is sharper the less correlated are the two assets, because the portfolio<br />
variance benefits from increasing diversification. Portfolios of a risky asset and risk free rate<br />
give rise to straight lines in mean-standard deviation space.<br />
In Chapter 1, we derived a similar wedge-shaped region as the set of means and variances<br />
of all assets that are priced by a given discount factor. This chapter is about incomplete<br />
markets, so we think of a mean-variance frontier generated by a given set of assets, typically<br />
less than complete.<br />
When does the mean-variance frontier exist? I.e., when is the set of portfolio means and<br />
variances less than the whole {E,σ} space? We basically have to rule out a special case: two<br />
returns are perfectly correlated but yield different means. In that case one could short one,<br />
long the other, and achieve infinite expected returns with no risk. More formally, eliminate<br />
purely redundant securities from consideration, then<br />
80
SECTION 5.2 MEAN-VARIANCE FRONTIER: INTUITION AND LAGRANGIAN CHARACTERIZATION<br />
Theorem: So long as the variance-covariance matrix of returns is non-singular, there<br />
is a mean-variance frontier.<br />
To prove this theorem, just follow the construction below. This theorem should sound<br />
very familiar: Two perfectly correlated returns with different mean are a violation of the law<br />
of one price. Thus, the law of one price implies that there is a mean variance frontier as well<br />
as a discount factor.<br />
R f<br />
E(R)<br />
Tangency portfolio<br />
of risky assets<br />
Mean-variance frontier<br />
Original assets<br />
Risky asset frontier<br />
σ(R)<br />
Figure 13. Mean-variance frontier<br />
5.2.1 Lagrangian approach to mean-variance frontier<br />
The standard definition and the computation of the mean-variance frontier follows a brute<br />
force approach.<br />
Problem: Start with a vector of asset returns R. Denote by E the vector of mean returns,<br />
E ≡ E(R), and denote by Σ the variance-covariance matrix Σ = E £ (R − E)(R − E) 0¤ .<br />
A portfolio is defined by its weights w on the initial securities. The portfolio return is w0R where the weights sum to one, w01=1. The problem “choose a portfolio to minimize variance<br />
for a given mean” is then<br />
Solution: Let<br />
min {w} w 0 Σw s.t. w 0 E = µ; w 0 1=1. (59)<br />
A = E 0 Σ −1 E; B = E 0 Σ −1 1; C =1 0 Σ −1 1.<br />
81
CHAPTER 5 MEAN-VARIANCE FRONTIER AND BETA REPRESENTATIONS<br />
Then, for a given mean portfolio return µ, the minimum variance portfolio has variance<br />
var (R p )= Cµ2 − 2Bµ + A<br />
AC − B2 (60)<br />
and is formed by portfolio weights<br />
−1 E (Cµ − B)+1(A− Bµ)<br />
w = Σ<br />
(AC − B2 .<br />
)<br />
Equation (5.60) shows that the variance is a quadratic function of the mean. The square<br />
root of a parabola is a hyperbola, which is why we draw hyperbolic regions in mean-standard<br />
deviation space.<br />
The minimum-variance portfolio is interesting in its own right. It appears as a special case<br />
in many theorems and it appears in several test statistics. We can find it by minimizing (5.60)<br />
over µ, giving µ min var = B/C. The weights of the minimum variance portfolio are thus<br />
w = Σ −1 1/(1 0 Σ −1 1).<br />
We can get to any point on the mean-variance frontier by starting with two returns on<br />
the frontier and forming portfolios. The frontier is spanned by any two frontier returns.<br />
Toseethisfact,noticethatwis a linear function of µ. Thus, if you take the portfolios<br />
corresponding to any two distinct mean returns µ 1 and µ 2, the weights on a third portfolio<br />
with mean µ 3 = λµ 1 +(1−λ)µ 2 are given by w3 = λw1 +(1−λ)w2. Derivation: To derive the solution, introduce Lagrange multipliers 2λ and 2δ on the constraints.<br />
The first order conditions to (5.59) are then<br />
Σw−λE − δ1 =0<br />
We find the Lagrange multipliers from the constraints,<br />
or<br />
w = Σ −1 (λE + δ1). (61)<br />
E 0 w = E 0 Σ −1 (λE + δ1) = µ<br />
1 0 w =1 0 Σ −1 (λE + δ1) = 1<br />
· E 0 Σ −1 E E 0 Σ −1 1<br />
1 0 Σ −1 E 1 0 Σ −1 1<br />
· A B<br />
B C<br />
¸· λ<br />
δ<br />
82<br />
¸· λ<br />
δ<br />
¸<br />
=<br />
¸<br />
=<br />
· µ<br />
1<br />
¸<br />
· µ<br />
1<br />
¸
SECTION 5.3 AN ORTHOGONAL CHARACTERIZATION OF THE MEAN-VARIANCE FRONTIER<br />
Hence,<br />
λ = Cµ−B<br />
AC−B 2<br />
δ = A−Bµ<br />
AC − B 2<br />
Plugging in to (5.61), we get the portfolio weights and variance.<br />
5.3 An orthogonal characterization of the mean-variance frontier<br />
Every return can be expressed as Ri = R∗ + wiRe∗ + ni .<br />
Themean-variancefrontierisRmv = R∗ + wRe∗ R e∗ is defined as R e∗ = proj(1|R e ). It represents mean excess returns, E(R e )=E(R e∗ R e )<br />
∀R e ∈ R e<br />
The Lagrangian approach to the mean-variance frontier is straightforward but cumbersome.<br />
Our further manipulations will be easier if we follow an alternative approach due to<br />
Hansen and Richard (1987). Technically, Hansen and Richard’s approach is also valid when<br />
we can’t generate the payoff space by portfolios of a finite set of basis payoffs c 0 x.Thishappens,<br />
for example, when we think about conditioning information in Chapter 8. Also, it is the<br />
natural geometric way to think about the mean-variance frontier given that we have started<br />
to think of payoffs, discount factors and other random variables as vectors in the space of<br />
payoffs. Rather than write portfolios as combinations of basis assets, and pose and solve a<br />
minimization problem, we first describe any return by a three-way orthogonal decomposition.<br />
The mean-variance frontier then pops out easily without any algebra.<br />
5.3.1 Definitions of R ∗ ,R e∗<br />
Istartbydefining two special returns. R ∗ is the return corresponding to the payoff x ∗ that<br />
can act as the discount factor. The price of x ∗ , is, like any other price, p(x ∗ )=E(x ∗ x ∗ ).<br />
Thus,<br />
The definition of R ∗ is<br />
R ∗ ≡ x∗<br />
p(x∗ x∗<br />
=<br />
) E(x∗2 )<br />
83<br />
(62)
CHAPTER 5 MEAN-VARIANCE FRONTIER AND BETA REPRESENTATIONS<br />
The definition of R e∗ is<br />
R e∗ ≡ proj(1 | R e ) (63)<br />
R e ≡ space of excess returns = {x ∈ X s.t. p(x) =0}<br />
Why R e∗ ? We are heading towards a mean-variance frontier, so it is natural to seek a<br />
special return that changes means. R e∗ is an excess return that represents means on R e with<br />
an inner product in the same way that x ∗ is a payoff in X that represents prices with an inner<br />
product. As<br />
so<br />
p(x) =E(mx) =E[proj(m|X)x] =E(x ∗ x),<br />
E(R e )=E(1 × R e )=E [proj(1 | R e ) × R e ]=E(R e∗ R e ).<br />
If R∗ and Re∗ are still a bit mysterious at this point, they will make more sense as we use<br />
them, and discover their many interesting properties.<br />
Now we can state a beautiful orthogonal decomposition.<br />
Theorem: Every return R i can be expressed as<br />
R i = R ∗ + w i R e∗ + n i<br />
where w i is a number, and n i is an excess return with the property<br />
The three components are orthogonal,<br />
E(n i )=0.<br />
E(R ∗ R e∗ )=E(R ∗ n i )=E(R e∗ n i )=0.<br />
This theorem quickly implies the characterization of the mean variance frontier which we<br />
are after:<br />
Theorem: R mv is on the mean-variance frontier if and only if<br />
for some real number w.<br />
R mv = R ∗ + wR e∗<br />
As you vary the number w, you sweep out the mean-variance frontier. E(R e∗ ) 6= 0, so<br />
adding more w changes the mean and variance of R mv . You can interpret (5.64) as a “two-<br />
84<br />
(64)
SECTION 5.3 AN ORTHOGONAL CHARACTERIZATION OF THE MEAN-VARIANCE FRONTIER<br />
fund” theorem for the mean-variance frontier. It expresses every frontier return as a portfolio<br />
of R∗ and Re∗ , with varying weights on the latter.<br />
As usual, first I’ll argue why the theorems are sensible, then I’ll offer a simple algebraic<br />
proof. Hansen and Richard (1987) give a much more careful algebraic proof.<br />
5.3.2 Graphical construction<br />
Figure 14 illustrates the decomposition. Start at the origin (0). Recall that the x∗ vector is<br />
perpendicular to planes of constant price; thus the R∗ vector lies perpendicular to the plane<br />
of returns as shown. Go to R∗ .<br />
Re∗ is the excess return that is closest to the vector 1; it lies at right angles to planes (in<br />
Re )ofconstantmean return, shown in the E =1,E =2lines, just as the return R∗ lies at<br />
right angles to planes of constant price. Since Re∗ is an excess return, it is orthogonal to R∗ .<br />
Proceed an amount wi in the direction of Re∗ , getting as close to Ri as possible.<br />
Now move, again in an orthogonal direction, by an amount ni to get to the return Ri .We<br />
have thus expressed Ri = R∗ +wiRe∗ +ni in a way that all three components are orthogonal.<br />
Returns with n =0, R ∗ + wR e∗ , are the mean-variance frontier. Here’s why. Since<br />
E(R 2 )=σ 2 (R)+E(R) 2 , we can define the mean-variance frontier by minimizing second<br />
moment for a given mean. The length of each vector in Figure 14 is its second moment, so<br />
we want the shortest vector that is on the return plane for a given mean. The shortest vectors<br />
in the return plane with given mean are on the R ∗ + wR e∗ line.<br />
The graph also shows how R e∗ represents means in the space of excess returns. Expectation<br />
is the inner product with 1. Planes of constant expected value in Figure 14 are<br />
perpendicular to the 1 vector, just as planes of constant price are perpendicular to the x ∗ or<br />
R ∗ vectors. I don’t show the full extent of the constant expected payoff planes for clarity; I<br />
do show lines of constant expected excess return in R e , which are the intersection of constant<br />
expected payoff planes with the R e plane. Therefore, just as we found an x ∗ in X to represent<br />
prices in X by projecting m onto X,wefind R e∗ in R e by projecting of 1 onto R e .Yes,<br />
a regression with one on the left hand side. Planes perpendicular to R e∗ in R e are payoffs<br />
with constant mean, just as planes perpendicular to x ∗ in X are payoffs with the same price.<br />
5.3.3 Algebraic argument<br />
Now, an algebraic proof of the decomposition and characterization of mean variance frontier.<br />
The algebra just represents statements about what is at right angles to what with second<br />
moments.<br />
Proof: Straight from their definitions, (5.62) and (5.63) we know that R e∗ is an<br />
85
CHAPTER 5 MEAN-VARIANCE FRONTIER AND BETA REPRESENTATIONS<br />
R=space of returns (p=1)<br />
R*<br />
0<br />
E=0<br />
R e *<br />
R*+w i R e *<br />
1<br />
E=1<br />
R e = space of excess returns (p=0)<br />
n i<br />
R i =R*+w i R e* +n i<br />
Figure 14. Orthogonal decomposition and mean-variance frontier.<br />
excess return (price zero), and hence that R ∗ and R e∗ are orthogonal,<br />
E(R ∗ R e∗ )= E(x∗ R e∗ )<br />
E(x ∗2 ) =0.<br />
We define n i so that the decomposition adds up to R i as claimed, and we define<br />
w i to make sure that n i is orthogonal to the other two components. Then we prove<br />
that E(n i )=0.Pickanyw i andthendefine<br />
n i ≡ R i − R ∗ − w i R e∗ .<br />
n i is an excess return so already orthogonal to R ∗ ,<br />
E(R ∗ n i )=0.<br />
To show E(n i )=0and n i orthogonal to R e∗ , we exploit the fact that since n i is an<br />
excess return,<br />
E(n i )=E(R e∗ n i ).<br />
Therefore, R e∗ is orthogonal to n i ifandonlyifwepickw i so that E(n i )=0.We<br />
86
SECTION 5.4 SPANNING THE MEAN-VARIANCE FRONTIER<br />
don’t have to explicitly calculate w i for the proof. 3<br />
Once we have constructed the decomposition, the frontier drops out. Since E(n i )=<br />
0 and the three components are orthogonal,<br />
E(R i )=E(R ∗ )+w i E(R e∗ )<br />
σ 2 (R i )=σ 2 (R ∗ + w i R e∗ )+σ 2 (n i ).<br />
Thus, for each desired value of the mean return, there is a unique w i . Returns with<br />
n i =0minimize variance for each mean. ¥<br />
5.3.4 Decomposition in mean-variance space<br />
Figure 15 illustrates the decomposition in mean-variance space rather than in state-space.<br />
First, let’s locate R ∗ . R ∗ is the minimum second moment return. One can see this fact<br />
from the geometry of Figure 14: R ∗ is the return closest to the origin, and thus the return<br />
with the smallest “length” which is second moment. As with OLS regression, minimizing<br />
the length of R ∗ andcreatinganR ∗ orthogonal to all excess returns is the same thing. One<br />
can also verify this property algebraically. Since any return can be expressed as R = R ∗ +<br />
wR e∗ + n, E(R 2 )=E(R ∗2 )+w 2 E(R e∗2 )+E(n 2 ). n =0and w =0thus give the<br />
minimum second moment return.<br />
In mean-standard deviation space, lines of constant second moment are circles. Thus,<br />
the minimum second-moment return R∗ is on the smallest circle that intersects the set of all<br />
assets, which lie in the mean-variance frontier in the right hand panel of Figure 19. Notice<br />
that R∗ is on the lower, or “inefficient” segment of the mean-variance frontier. It is initially<br />
surprising that this is the location of the most interesting return on the frontier! R∗ is not<br />
the “market portfolio” or “wealth portfolio,” which typically lie on the upper portion of the<br />
frontier.<br />
Adding more Re∗ moves one along the frontier. Adding n does not change mean but does<br />
change variance, so it is an idiosyncratic return that just moves an asset off the frontier as<br />
graphed. α is the “zero-beta rate” corresponding to R∗ . It is the expected return of any return<br />
that is uncorrelated with R∗ . I demonstrate these properties in section 6.5.<br />
3 Its value<br />
is not particularly enlightening.<br />
w i = E(Ri ) − E(R ∗ )<br />
E(R e∗ )<br />
87
CHAPTER 5 MEAN-VARIANCE FRONTIER AND BETA REPRESENTATIONS<br />
E(R)<br />
R* + w i R e*<br />
R*<br />
σ(R)<br />
Figure 15. Orthogonal decomposition of a return R i in mean-standard deviation space.<br />
5.4 Spanning the mean-variance frontier<br />
The characterization of the mean-variance frontier in terms of R ∗ and R e∗ is most natural<br />
in our setup. However, you can equivalently span the mean-variance frontier with any two<br />
portfolios that are on the frontier – any two distinct linear combinations of R ∗ and R e∗ .In<br />
particular, take any return<br />
UsingthisreturninplaceofR e∗ ,<br />
R α = R ∗ + γR e∗ , γ 6= 0. (65)<br />
R e∗ = Rα − R ∗<br />
γ<br />
you can express the mean variance frontier in terms of R ∗ and R α :<br />
where I have defined a new weight y = w/γ.<br />
R ∗ + wR e∗ = R ∗ + y (R α − R ∗ ) (5.66)<br />
= (1− y)R ∗ + yR α<br />
88<br />
n i<br />
R i
SECTION 5.5 A COMPILATION OF PROPERTIES OF R ∗ ,R e∗ AND x ∗<br />
The most common alternative approach is to use a risk free rate or a risky rate that somehow<br />
behaves like the risk free rate in place of R e∗ to span the frontier. When there is a risk<br />
free rate, it is on the frontier with representation<br />
R f = R ∗ + R f R e∗<br />
I derive this expression in equation (5.72) below. Therefore, we can use (5.66) with R a = R f .<br />
When there is no risk free rate, several risky returns that retain some properties of the risk free<br />
rate are often used. In section 5.3 below I present a “zero beta” return, which is uncorrelated<br />
with R ∗ , a “constant-mimicking portfolio” return, which is the return on the traded payoff<br />
closest to unity, ˆR = proj(1|X)/p[proj(1|X)] and the minimum variance return. Each of<br />
these returns is on the mean-variance frontier, with form 5.65, though different values of α.<br />
Therefore, we can span the mean-variance frontier with R ∗ and any of these risk-free rate<br />
proxies.<br />
5.5 A compilation of properties of R ∗ ,R e∗ and x ∗<br />
The special returns R∗ , Re∗ that generate the mean variance frontier have lots of interesting<br />
and useful properties. Some I derived above, some I will derive and discuss below in more<br />
detail, and some will be useful tricks later on. Most properties and derivations are extremely<br />
obscure if you don’t look at the picture!<br />
1)<br />
E(R ∗2 1<br />
)=<br />
E(x∗2 . (67)<br />
)<br />
To derive this fact, multiply both sides of (5.62) by R∗ , take expectations, and remember<br />
R∗ is a return so 1=E(x∗R∗ ).<br />
2) We can reverse the definition and recover x∗ from R∗ via<br />
x ∗ = R∗<br />
E(R∗2 . (68)<br />
)<br />
To derive this formula, start with the definition R∗ = x∗ /E(x∗2 ) and substitute from (5.67)<br />
for E(x∗2 )<br />
3) R∗ can be used to represent prices just like x∗ . This is not surprising, since they both<br />
point in the same direction, orthogonal to planes of constant price. Most obviously, from 5.68<br />
p(x) =E(x ∗ x)= E (R∗x) E(R∗2 ∀x ∈ X<br />
)<br />
For returns, we can nicely express this result as<br />
E(R ∗2 )=E(R ∗ R) ∀R ∈ R. (69)<br />
89
CHAPTER 5 MEAN-VARIANCE FRONTIER AND BETA REPRESENTATIONS<br />
This fact can also serve as an alternative defining property of R∗ .<br />
4) Re∗ represents means on Re via an inner product in the same way that x∗ represents<br />
prices on X via an inner product. Re∗ is orthogonal to planes of constant mean in Re as x∗ is<br />
orthogonal to planes of constant price. Algebraically, in analogy to p(x) =E(x∗x) we have<br />
E(R e )=E(R e∗ R e ) ∀R e ∈ R e . (70)<br />
This fact can serve as an alternative defining property of Re∗ .<br />
5) Re∗ and R∗ are orthogonal,<br />
E(R ∗ R e∗ )=0.<br />
More generally, R∗ is orthogonal to any excess return.<br />
6) The mean variance frontier is given by<br />
R mv = R ∗ + wR e∗ .<br />
To prove this, E(R2 )=E £ (R∗ + wRe∗ + n) 2¤ = E(R∗2 )+w2E(Re2 )+E(n2 ),and<br />
E(n) =0, so set n to zero. The conditional mean-variance frontier allows w in the conditioning<br />
information set. The unconditional mean variance frontier requires w to equal a<br />
constant.<br />
7) R∗ is the minimum second moment return. Graphically, R∗ is the return closest to<br />
the origin. To see this, using the decomposition in #6, and set w2 and n to zero to minimize<br />
second moment.<br />
8) Re∗ has the same first and second moment,<br />
Just apply fact (5.70) to R e∗ itself. Therefore<br />
E(R e∗ )=E(R e∗2 ).<br />
var(R e∗ )=E(R e∗2 ) − E(R e∗ ) 2 = E(R e∗ )[1− E(R e∗ )] .<br />
9) If there is a riskfree rate, then Re∗ can also be defined as the residual in the projection<br />
of 1 on R∗ :<br />
R e∗ =1− proj(1|R ∗ )=1− E(R∗ )<br />
E(R∗2 ) R∗ =1− 1<br />
R∗<br />
(71)<br />
Rf You’d never have thought of this without looking at Figure 14! Since R ∗ and R e are orthogonal<br />
and together span X, 1=proj(1|R e )+proj(1|R ∗ ). You can also verify this statement<br />
analytically. Check that R e∗ so defined is an excess return in X – its price is zero–, and<br />
E(R e∗ R e )=E(R e ); E(R ∗ R e∗ )=0.<br />
90
SECTION 5.5 A COMPILATION OF PROPERTIES OF R ∗ ,R e∗ AND x ∗<br />
As a result, R f has the decomposition<br />
R f = R ∗ + R f R e∗ . (72)<br />
Since Rf > 1 typically, this means that R∗ +Re∗ is located on the lower portion of the meanvariance<br />
frontier in mean-variance space, just a bit to the right of Rf . If the risk free rate were<br />
one, then the unit vector would lie in the return space, and Rf = R∗ + Re∗ . Typically, the<br />
space of returns is a little bit above the unit vector. As you stretch the unit vector by the<br />
amount Rf to arrive at the return Rf , so you stretch the amount Re∗ that you add to R∗ to<br />
get to Rf .<br />
If there is no riskfree rate, then we can use<br />
proj(1|X) = proj(proj (1|X) |R e )+proj(proj (1|X) |R ∗ )<br />
= proj(1|R e )+proj(1|R ∗ )<br />
to deduce an analogue to equation (5.71),<br />
R e∗ = proj(1|X) − proj(1|R ∗ )=proj(1|X) − E(R∗ )<br />
E(R ∗2 ) R∗<br />
10) If a riskfree rate is traded, we can construct R f from R ∗ via<br />
(73)<br />
R f = 1<br />
E(x∗ ) = E(R∗2 )<br />
E(R∗ . (74)<br />
)<br />
If not, this gives a “zero beta rate” interpretation of the right hand expression.<br />
11) Since we have a formula x ∗ = p 0 E(xx 0 ) −1 x for constructing x ∗ from basis assets<br />
(see section 4.1), we can construct R ∗ in this case from<br />
R ∗ = x∗<br />
p(x ∗ ) = p0 E(xx 0 ) −1 x<br />
p 0 E(xx 0 ) −1 p .<br />
(p(x∗ )=E(x∗x∗ ) leading to the denominator.)<br />
<strong>12</strong>) We can construct Re∗ from a set of basis assets as well. Following the definition to<br />
project one on the space of excess returns,<br />
R e∗ = E(R e ) 0 E(R e R e0 ) −1 R e<br />
where R e is the basis set of excess returns. (You can always use R e = R−R ∗ if you want).<br />
This construction obviously mirrors the way we constructed x ∗ in section 4.1, and you can<br />
see the similarity in the result, with E in place of p, sinceR e∗ represents means rather than<br />
prices. .<br />
91
CHAPTER 5 MEAN-VARIANCE FRONTIER AND BETA REPRESENTATIONS<br />
If there is a riskfree rate, we can also use (5.71),<br />
R e∗ =1− 1<br />
R f R∗ =1− 1<br />
R f<br />
p0E(xx0 ) −1x p0E(xx0 ) −1 . (75)<br />
p<br />
If there is no riskfree rate, we can use (5.73) to construct R e∗ . The central ingredient is<br />
proj(1|X) =E(x) 0 E(xx 0 ) −1 x.<br />
5.6 Mean-variance frontiers for m: the Hansen-Jagannathan<br />
bounds<br />
The mean-variance frontier of all discount factors that price a given set of assets is related<br />
to the mean-variance frontier of asset returns by<br />
and hence<br />
σ(m)<br />
E(m) ≥ |E(Re )|<br />
σ(Re ) .<br />
σ(m)<br />
min<br />
= max<br />
{all m that price x∈X} E(m) {all excess returns Re E(R<br />
in X}<br />
e )<br />
σ(Re )<br />
The discount factors on the frontier can be characterized analogously to the mean-variance<br />
frontier of asset returns,<br />
m = x ∗ + we ∗<br />
e ∗ ≡ 1 − proj(1|X) =proj(1|E) =1− E(x) 0 E(xx 0 ) −1 x<br />
E = {m − x ∗ } .<br />
We derived in Chapter 1 a relation between the Sharpe ratio of an excess return and the<br />
volatility of discount factors necessary to price that return,<br />
Quickly,<br />
σ(m)<br />
E(m) ≥ |E(Re )|<br />
σ(Re ) .<br />
0=E(mR e )=E(m)E(R e )+ρ m,R eσ(m)σ(R e ),<br />
92
SECTION 5.6 MEAN-VARIANCE FRONTIERS FOR m: THE HANSEN-JAGANNATHAN BOUNDS<br />
and |ρ| ≤ 1. If we had a riskfree rate, then we know in addition<br />
E(m) =1/R f .<br />
Hansen and Jagannathan (1991) had the brilliant insight to read this equation as a restriction<br />
on the set of discount factors that can price a given set of returns, as well as a restriction on<br />
the set of returns we will see given a specific discount factor. This calculation teaches us<br />
that we need very volatile discount factors with a mean near one to understand stock returns.<br />
This and more general related calculations turn out to be a central tool in understanding and<br />
surmounting the equity premium puzzle, surveyed in Chapter 21.<br />
We would like to derive a bound that uses a large number of assets, and that is valid if<br />
there is no riskfree rate. What is the set of {E(m), σ(m)} consistent with a given set of asset<br />
prices and payoffs? What is the mean-variance frontier for discount factors?<br />
Obviously, the higher the Sharpe ratio, the tighter the bound. This suggests a way to<br />
construct the frontier we’re after. For any hypothetical risk-free rate, find the highest Sharpe<br />
ratio. That is, of course the tangency portfolio. Then the slope to the tangency portfolio gives<br />
the ratio σ(m)/E(m). Figure 16 illustrates.<br />
E(R)<br />
1/E(m) E(R e )/σ(R e )<br />
σ(R)<br />
σ(m) =<br />
Ε(R e )/σ(R e )<br />
E(m)<br />
Figure 16. Graphical construction of the Hansen-Jagannathan bound.<br />
As we sweep through values of E(m), the slope to the tangency becomes lower, and<br />
the Hansen-Jagannathan bound declines. At the mean return corresponding to the minimum<br />
variance point, the HJ bound attains its minimum. Continuing, the Sharpe ratio rises again<br />
and so does the bound. If there were a riskfree rate, then we know E(m), the return frontier<br />
is a V shape, and the HJ bound is purely a bound on variance.<br />
This discussion implies a beautiful duality between discount factor volatility and Sharpe<br />
ratios.<br />
σ(m)<br />
min<br />
= max<br />
{all m that price x∈X} E(m) {all excess returns Re in X}<br />
93<br />
E(Re )<br />
σ(Re . (76)<br />
)
CHAPTER 5 MEAN-VARIANCE FRONTIER AND BETA REPRESENTATIONS<br />
We need formulas for an explicit calculation. In equation (), we found a representation<br />
for the set of discount factors that price a given set of asset returns – that satisfy p = E(mx) :<br />
m = E(m)+[p − E(m)E(x)] Σ −1 [x − E(x)] + ε (77)<br />
where Σ ≡ cov(x, x 0 ) and E(ε) =0, E(εx) =0. You can think of this as a regression or<br />
projection of any discount factor on the space of payoffs, plus an error. Since σ 2 (ε) > 0,<br />
this representation leads immediately to an explicit expression for the Hansen-Jagannathan<br />
bound,<br />
σ 2 (m) ≥ (p − E(m)E(x)) 0 Σ −1 (p − E(m)E(x)) . (78)<br />
As all asset returns must lie in a cup-shaped region in {E(R), σ(R)} space, all discount<br />
factors must lie in a parabolic region in © E(m), σ2 (m) ª space, as illustrated in the right<br />
hand panel of Figure 16.<br />
We would like an expression for the discount factors on the bound, as we wanted an<br />
expression for the returns on the mean variance frontier instead of just a formula for the<br />
means and variances. As we found a three way decomposition of all returns, two of which<br />
generated the mean-variance frontier of returns, so we can find a three way decomposition of<br />
discount factors, two of which generate the mean-variance frontier of discount factors (5.78).<br />
I illustrate the construction in Figure 17.<br />
Any m must line in the plane marked M, perpendicular to X through x∗ .Anymmust be of the form<br />
m = x ∗ + we ∗ + n.<br />
Here, I have just broken up the residual ε in the familiar representation m = x ∗ + ε into two<br />
components. e ∗ is defined as the residual from the projection of 1 onto X or, equivalently the<br />
projection of 1 on the space E of “excess m’s,” random variables of the form m − x ∗ .<br />
e ∗ ≡ 1 − proj(1|X) =proj(1|E).<br />
e ∗ generatesmeansofm just as R e∗ did for returns:<br />
E(m − x ∗ )=E[1 × (m − x ∗ )] = E[proj(1|E)(m − x ∗ )].<br />
Finally n,definedas the leftovers, has mean zero since it’s orthogonal to 1 and is orthogonal<br />
to X.<br />
As with returns, then, the mean-variance frontier of m0sisgivenby m ∗ = x ∗ + we ∗ . (79)<br />
If the unit payoff is in the payoff space, then we know E(m), and the frontier and bound<br />
are just m = x ∗ , σ 2 (m) ≥ σ 2 (x ∗ ). This is exactly like the case of risk-neutrality for return<br />
mean-variance frontiers.<br />
94
SECTION 5.6 MEAN-VARIANCE FRONTIERS FOR m: THE HANSEN-JAGANNATHAN BOUNDS<br />
proj(1| X)<br />
x*<br />
0<br />
X = payoff space<br />
E(.)=0<br />
e*<br />
1<br />
E = space of m-x*<br />
M = space of discount factors<br />
x*+we*<br />
E(.)=1<br />
n<br />
m = x*+we * +n<br />
Figure 17. Decomposition of any discount factor m = x ∗ + we + n.<br />
95
CHAPTER 5 MEAN-VARIANCE FRONTIER AND BETA REPRESENTATIONS<br />
The construction (5.79) can be used to derive the formula (5.78) for the Hansen-Jagannathan<br />
bound for the finite-dimensional cases discussed above. It’s more general, since it can be used<br />
in infinite-dimensional payoff spaces as well. Along with the corresponding return formula<br />
Rmv = R∗ + wRe∗ , we see in Chapter 8 that it extends more easily to the calculation of<br />
conditional vs. unconditional mean-variance frontiers (Gallant, Hansen and Tauchen 1995).<br />
It will make construction (5.79) come alive if we find equations for its components. We<br />
find x∗ as before, it is the portfolio c0x in X that prices x:<br />
x ∗ = p 0 E(xx 0 ) −1 x.<br />
Similarly, let’s find e ∗ . The projection of 1 on X is<br />
proj(1|X) =E(x) 0 E(xx 0 ) −1 x.<br />
(After a while you get used to the idea of running regressions with 1 on the left hand side and<br />
random variables on the right hand side!) Thus,<br />
e ∗ =1− E(x) 0 E(xx 0 ) −1 x.<br />
Again, you can construct time-series of x∗and e∗ from these definitions.<br />
Finally, we now can construct the variance-minimizing discount factors<br />
m ∗ = x ∗ + we ∗ = p 0 E(xx 0 ) −1 x + w £ 1 − E(x) 0 E(xx 0 ) −1 x ¤<br />
or<br />
m ∗ = w +[p − wE(x)] 0 E(xx 0 ) −1 x (80)<br />
As w varies, we trace out discount factors m ∗ on the frontier with varying means and variances.<br />
It’s easiest to find mean and second moment:<br />
E(m ∗ )=w +[p − wE(x)] 0 E(xx 0 ) −1 E(x)<br />
E(m ∗2 )=[p − wE(x)] 0 E(xx 0 ) −1 [p − wE(x)] ;<br />
variance follows from σ2 (m) =E(m2 ) − E(m) 2 . With a little algebra one can also show<br />
that these formulas are equivalent to equation (5.78).<br />
As you can see, Hansen-Jagannathan frontiers are equivalent to mean-variance frontiers.<br />
For example, an obvious exercise is to see how much the addition of assets raises the Hansen-<br />
Jagannathan bound. This is exactly the same as asking how much those assets expand<br />
the mean-variance frontier. It was, in fact, this link between Hansen-Jagannathan bounds<br />
and mean-variance frontiers rather than the logic I described that inspired Knez and Chen<br />
(1996) and DeSantis (1994) to test for mean-variance efficiency using, essentially, Hansen-<br />
Jagannathan bounds.<br />
96
SECTION 5.7 PROBLEMS<br />
Hansen-Jagannathan bounds have the potential to do more than mean-variance frontiers.<br />
Hansen and Jagannathan show how to solve the problem<br />
min σ 2 (m) s.t. p = E(mx),m>0.<br />
This is the “Hansen-Jagannathan bound with positivity,” and is strictly tighter than the Hansen-<br />
Jagannathan bound. It allows you to impose no-arbitrage conditions. In stock applications,<br />
this extra bound ended up not being that informative. However, in the option application of<br />
this idea of Chapter (18), positivity is really important. That chapter shows how to solve for<br />
a bound with positivity.<br />
Hansen, Heaton and Luttmer (1995) develop a distribution theory for the bounds. Luttmer<br />
(1996) develops bounds with market frictions such as short-sales constraints and bid-ask<br />
spreads, to account for ludicrously high apparent Sharpe ratios and bounds in short term<br />
bond data. <strong>Cochrane</strong> and Hansen (1992) survey a variety of bounds, including bounds that<br />
incorporate information that discount factors are poorly correlated with stock returns (the<br />
HJ bounds use the extreme ρ =1), bounds on conditional moments that illustrate how many<br />
models imply excessive interest rate variation, bounds with short-sales constraints and market<br />
frictions, etc.<br />
Chapter 21 discusses what the results of Hansen Jagannathan bound calculations and what<br />
they mean for discount factors that can price stock and bond return data.<br />
5.7 Problems<br />
1. Prove that Re∗ lies at right angles to planes (in Re )ofconstantmean return, as shown in<br />
figure 14.<br />
2. Should we typically draw x∗ above, below or on the plane of returns? Must x∗always lie<br />
in this position?<br />
3. Can you construct Re∗ from knowledge of m, x∗ ,orR∗ ?<br />
4. What happens to R∗ ,Re∗ and the mean-variance frontier if investors are risk neutral?<br />
(a) If a riskfree rate is traded.<br />
(b) Ifnoriskfreerateistraded?<br />
5.<br />
(Hint: make a drawing or think about the case that payoffs are generated by an N<br />
dimensional vector of basis assets x)<br />
x∗ = proj(m|X). IsR∗ = proj(m|R)?<br />
6. We showed that all m are of the form x∗ + ε. What about R−1R? 7. Show that if there is a risk-free rate—if the unit payoff is in the payoff space X—then<br />
Re∗ =(Rf − R∗ )/Rf .<br />
97
Chapter 6. Relation between discount<br />
factors, betas, and mean-variance frontiers<br />
In this chapter, I draw the connection between discount factors, mean-variance frontiers, and<br />
beta representations. In the first chapter, I showed how mean-variance and a beta representation<br />
follow from p = E(mx) and (in the mean-variance case) complete markets. Here, I<br />
discuss the connections in both directions and in incomplete markets, drawing on the representations<br />
studied in the last chapter.<br />
The central theme of the chapter is that all three representations are equivalent. Figure<br />
18 summarizes the ways one can go from one representation to another. A discount factor, a<br />
reference variable for betas – the thing you put on the right hand side in the regressions that<br />
give betas – and a return on the mean-variance frontier all carry the same information, and<br />
given any one of them, you can find the others. More specifically,<br />
1. p = E(mx) ⇒ β: Givenm such that p = E(mx), m, x ∗ ,R ∗ ,orR ∗ + wR e∗ all can<br />
serve as reference variables for betas.<br />
2. p = E(mx) ⇒ mean-variance frontier. You can construct R ∗ from x ∗ = proj(m|X),<br />
R ∗ = x ∗ /E(x ∗2 ),andthenR ∗ , R ∗ + wR e∗ are on the mean-variance frontier.<br />
3. Mean-variance frontier ⇒ p = E(mx). IfR mv is on the mean-variance frontier, then<br />
m = a + bR mv linear in that return is a discount factor; it satisfies p = E(mx).<br />
4. β ⇒ p = E(mx). If we have an expected return/beta model with factors f, then<br />
m = b 0 f linear in the factors satisfies p = E(mx) (and vice-versa).<br />
5. If a return is on the mean-variance frontier, then there is an expected return/beta model<br />
with that return as reference variable.<br />
The following subsections discuss the mechanics of going from one representation to the<br />
other in detail. The last section of the chapter collects some special cases when there is<br />
no riskfree rate. The next chapter discusses some of the implications of these equivalence<br />
theorems, and why they are important.<br />
Roll (197x) pointed out the connection between mean-variance frontiers and beta pricing.<br />
Ross (1978) and Dybvig and Ingersoll (1982) pointed out the connection between linear<br />
discount factors and beta pricing. Hansen and Richard (1987) pointed out the connection<br />
between a discount factor and the mean-variance frontier.<br />
6.1 From discount factors to beta representations<br />
m, x ∗ , and R ∗ can all be the single factor in a single beta representation.<br />
98
SECTION 6.1 FROM DISCOUNT FACTORS TO BETA REPRESENTATIONS<br />
f = m, x*, R*<br />
E(R i ) = α + β i’λ<br />
m = b’f<br />
proj(f|R) on m.v.f.<br />
f = R mv<br />
LOOP m exists<br />
p = E(mx)<br />
m = a + bR<br />
R* is on m.v.f.<br />
mv<br />
R mv on m.v.f.<br />
E(RR’) nonsingular R mv exists<br />
Figure 18. Relation between three views of asset pricing.<br />
6.1.1 Beta representation using m<br />
p = E(mx) implies E(R i )=α + β i,mλm. Startwith<br />
Thus,<br />
1=E(mR i )=E(m)E(R i )+cov(m, R i ).<br />
E(R i )= 1<br />
E(m) − cov(m, Ri )<br />
.<br />
E(m)<br />
Multiply and divide by var(m),define α ≡ 1/E(m) to get<br />
E(R i µ µ i cov(m, R )<br />
)=α +<br />
−<br />
var(m)<br />
var(m)<br />
<br />
= α + β<br />
E(m)<br />
i,mλm.<br />
As advertised, we have a single beta representation.<br />
For example, we can equivalently state the consumption-based model as: mean asset<br />
returns should be linear in the regression betas of asset returns on (ct+1/ct) −γ .Furthermore,<br />
the slope of this cross-sectional relationship λm is not a free parameter, though it is usually<br />
treated as such in empirical evaluation of factor pricing models. λm should equal the ratio of<br />
99
CHAPTER 6 RELATION BETWEEN DISCOUNT FACTORS, BETAS, AND MEAN-VARIANCE FRONTIERS<br />
variance to mean of (ct+1/ct) −γ .<br />
The factor risk premium λm for marginal utility growth is negative. Positive expected<br />
returns are associated with positive correlation with consumption growth, and hence negative<br />
correlation with marginal utility growth and m. Thus, we expect λm < 0.<br />
6.1.2 β representation using x ∗ and R ∗<br />
It is often useful to express a pricing model in a way that the factor is a payoff rather than a<br />
real factor such as consumption growth. In applications, we can then avoid measurement difficulties<br />
of real data. We have already seen the idea of “factor mimicking portfolios” formed<br />
by projection: project m on to X, and the resulting payoff x ∗ also serves as a discount factor.<br />
Unsurprisingly, x ∗ can also serve as the factor in an expected return-beta representation.<br />
It’s even more useful if the reference payoff is a return. Unsurprisingly, the return<br />
R ∗ = x ∗ /E(x ∗2 ) can also serve as the factor in a beta pricing model. When the factor is also<br />
a return, the model is particularly simple, since the factor risk premium is also the expected<br />
excess return.<br />
Theorem. 1 = E(mRi ) implies an expected return - beta model with x∗ =<br />
proj(m|X) or R∗ ≡ x∗ /E(x∗2 ) as factors, e.g. E(Ri ) = α + βi,x∗λx ∗ and<br />
E(Ri )=α + βi,R∗[E(R ∗ ) − α].<br />
Proof: Recall that p = E(mx) implies p = E [proj(m | X) x], orp = E(x∗x). Then<br />
1=E(mR i )=E(x ∗ R i )=E(x ∗ )E(R i )+cov(x ∗ ,R i ).<br />
Solving for the expected return,<br />
E(R i )= 1<br />
E(x∗ ) − cov(x∗ ,Ri )<br />
E(x∗ 1<br />
=<br />
)<br />
which we can write as the desired single-beta model,<br />
E(R i )=α + β i,x ∗λx ∗.<br />
E(x∗ ) − cov(x∗ ,Ri )<br />
var(x∗ )<br />
var(x ∗ )<br />
E(x ∗ )<br />
Notice that the zero-beta rate 1/E(x ∗ ) appears when there is no riskfree rate.<br />
To derive a single beta representation with R ∗ , recall the definition,<br />
R ∗ = x∗<br />
E(x∗2 )<br />
Substituting R∗ for x∗ , equation (6.81) implies that we can in fact construct a return<br />
R∗ from m that acts as the single factor in a beta model,<br />
E(R i )= E(R∗2 )<br />
E(R∗ ) − cov(R∗ ,Ri )<br />
E(R∗ ) = E(R∗2 )<br />
E(R∗ ) +<br />
µ ∗ i cov(R ,R )<br />
var(R∗ µ<br />
−<br />
)<br />
var(R∗ )<br />
E(R∗ <br />
)<br />
100<br />
(81)