2005 - Door County Web Map
2005 - Door County Web Map
2005 - Door County Web Map

You also want an ePaper? Increase the reach of your titles
YUMPU automatically turns print PDFs into web optimized ePapers that Google loves.
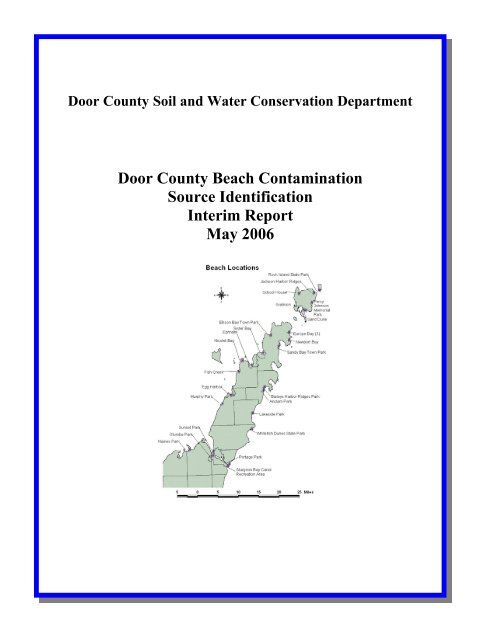
<strong>Door</strong> <strong>County</strong> Soil and Water Conservation Department<br />
<strong>Door</strong> <strong>County</strong> Beach Contamination<br />
Source Identification<br />
Interim Report<br />
May 2006
The <strong>Door</strong> <strong>County</strong> Beach Contamination Source Identification Project would not be possible<br />
without the help of the contributors.<br />
Principle Report Editor:<br />
Vinni Chomeau - <strong>Door</strong> <strong>County</strong> Soil and Water Conservation Department<br />
Report Contributors:<br />
Vinni Chomeau – <strong>Door</strong> <strong>County</strong> Soil and Water Conservation Department<br />
Greg Kleinheinz - UW – Oshkosh Microbiology<br />
Rhonda Kolberg - <strong>Door</strong> <strong>County</strong> Public Health Department<br />
Colleen McDermott - UW – Oshkosh Microbiology<br />
Meredith B. Nevers - US Geological Survey<br />
Lake Michigan Ecological Research Station<br />
William Schuster - <strong>Door</strong> <strong>County</strong> Soil and Water Conservation Department<br />
Richard L. Whitman -US Geological Survey<br />
Lake Michigan Ecological Research Station<br />
Primary Financial Contributor:<br />
Wisconsin Coastal Management Program<br />
Additional Financial Contributors:<br />
City of Sturgeon Bay<br />
Clark Lake Advancement Association<br />
<strong>Door</strong> <strong>County</strong> Chamber of Commerce<br />
<strong>Door</strong> <strong>County</strong> Economic Development Corporation<br />
<strong>Door</strong> <strong>County</strong> Public Health Department<br />
<strong>Door</strong> <strong>County</strong> Property Owners<br />
Town of Liberty Grove<br />
Town of Sevastopol<br />
Town of Sturgeon Bay<br />
Village of Ephraim<br />
Sturgeon Bay Jaycees<br />
In-kind Supporters:<br />
Bay Shore Property Owners Association<br />
Bay Shore Outdoor Store<br />
Lyle Burnt<br />
Crossroads at Big Creek<br />
<strong>Door</strong> <strong>County</strong> Sanitarian Department<br />
<strong>Door</strong> <strong>County</strong> Parks Department<br />
Fish Creek Watershed Study Group<br />
Newport State Park<br />
Peninsula State Park<br />
Rock Island State Park<br />
Judy and Albert Scherb<br />
Ship Yard Marina<br />
University of Wisconsin Oshkosh Microbiology Department<br />
University of Wisconsin Milwaukee – Water Institute<br />
US Coast Guard – Sturgeon Bay Station<br />
US Geological Survey - Lake Michigan Ecological Research Station<br />
Whitefish Dunes State Park
UW Oshkosh Beach Data Collection and Analysis Team<br />
Amanda Griesbach<br />
Tabitha Zehms<br />
Katie Voss<br />
Dustin Gross<br />
Jason Mankowski<br />
Dale Lange<br />
Amanda Brown<br />
Joe Felt<br />
Brenda Larson<br />
Candace Otte<br />
Angela Kiefer
Table of Contents<br />
Introduction......................................................................................................................................1<br />
Results and Recommendations per Beach .......................................................................................2<br />
<strong>Door</strong> <strong>County</strong> Beaches Located in the Sturgeon Bay Canal ........................................................ 2<br />
Otumba Park Beach .................................................................................................................2<br />
Sunset Park Beach (Sturgeon Bay) ..........................................................................................4<br />
<strong>Door</strong> <strong>County</strong> Beaches Located on Green Bay ............................................................................ 6<br />
Fish Creek Beach .....................................................................................................................6<br />
Ephraim Beach.........................................................................................................................8<br />
Sister Bay Park Beach..............................................................................................................9<br />
Ellison Bay Park Beach .........................................................................................................11<br />
Egg Harbor Park Beach .........................................................................................................12<br />
Murphy Park Beach ...............................................................................................................14<br />
Nicolet Bay Beach – Peninsula State Park ............................................................................15<br />
Haines Park Beach .................................................................................................................17<br />
<strong>Door</strong> <strong>County</strong> Beaches on Lake Michigan................................................................................. 17<br />
Whitefish Dunes State Park Beach ........................................................................................18<br />
Baileys Harbor Ridges Beach ................................................................................................19<br />
Portage Park Beach................................................................................................................21<br />
Newport State Park Beach .....................................................................................................22<br />
Lakeside Beach ......................................................................................................................22<br />
Europe Bay Park Beach .........................................................................................................24<br />
Sturgeon Bay Recreational Area Canal Beach ......................................................................25<br />
Sandy Bay Beach ...................................................................................................................26<br />
Anclam Park Beach................................................................................................................27<br />
Whitefish Bay ........................................................................................................................28<br />
<strong>Door</strong> <strong>County</strong> Beaches on Washington and Rock Island........................................................... 28<br />
Sand Dunes Beach .................................................................................................................28<br />
School House Beach ..............................................................................................................29<br />
Percy Johnson Memorial Park Beach ....................................................................................30<br />
Gialison Park Beach...............................................................................................................31<br />
Jackson Harbor Beach............................................................................................................32<br />
Rock Island Beach .................................................................................................................33<br />
Inland Lake Beaches................................................................................................................. 34<br />
Clark Lake..............................................................................................................................34<br />
Kangaroo Lake.......................................................................................................................35<br />
Europe Lake...........................................................................................................................36<br />
Beach Project Methodology and Results 2003-<strong>2005</strong>.....................................................................37<br />
Beach Monitoring Program....................................................................................................... 37<br />
Monitoring Methodology .......................................................................................................37<br />
Monitoring Results.................................................................................................................38<br />
Beach Contamination Source Identification Program ...................................................................42<br />
Overall Beach Contamination Source Identification Methodology.......................................... 42<br />
Specific Source Identification Methodology and Results......................................................... 43<br />
Impact of Physical Features/Conditions ................................................................................43<br />
Impact of Beach Location................................................................................................. 43<br />
Seasonal Impact ................................................................................................................ 44<br />
Spatial E. coli Sampling Methodology ............................................................................. 46<br />
Spatial E. coli Sampling Results....................................................................................... 46<br />
Rainfall Quantity Methodology ........................................................................................ 48<br />
i
Rainfall Quantity Results.................................................................................................. 48<br />
Rain Event Beach Water Sampling Methodology............................................................ 50<br />
Rain Event Beach Water Sampling Results...................................................................... 50<br />
Wind Methodology ........................................................................................................... 57<br />
Wind Results..................................................................................................................... 57<br />
Wave Height Methodology............................................................................................... 59<br />
Wave Height Results......................................................................................................... 59<br />
E. coli Concentrations in Beach Sand....................................................................................60<br />
Sand Sampling Methodology............................................................................................ 60<br />
Sand Sampling Results ..................................................................................................... 60<br />
Impact of Biological Factors..................................................................................................64<br />
Bird Count Methodology .................................................................................................. 64<br />
Avian Waste Survey Methodology................................................................................... 64<br />
Bird Count and Avian Waste Survey Results................................................................... 65<br />
Algae Impact Study Methodology.................................................................................... 67<br />
Algae Impact Study Results.............................................................................................. 68<br />
Further Study on Impacts of Algae at the Beach .............................................................. 72<br />
Pathogen Presence - Methodology.........................................................................................72<br />
Pathogen Presence - Results ..................................................................................................72<br />
Determining the Identity of E. coli Contaminating <strong>Door</strong> <strong>County</strong> Beaches ...........................73<br />
E. coli Identity Methodology ............................................................................................ 73<br />
Antibiotic Resistance Methodology.................................................................................. 74<br />
Genetic Fingerprinting Methodology ............................................................................... 75<br />
Source Identification E. coli Identity - Results/Conclusions.................................................76<br />
Beach Contamination Source Identification Methods Recommendations ....................................77<br />
General Beach Management Recommendations ...........................................................................78<br />
Appendix A: Storm water Conveyance Systems as a Source of E. coli in Beach Water – Otumba<br />
Park and Ephraim Beach................................................................................................................79<br />
Otumba Park Beach .................................................................................................................. 79<br />
Method .............................................................................................................................. 79<br />
Results............................................................................................................................... 79<br />
Ephraim Beach.......................................................................................................................... 81<br />
Methods............................................................................................................................. 81<br />
Appendix B: Watershed Study – Bay Shore Property Association Summer <strong>2005</strong>........................83<br />
ii
<strong>Map</strong>s, Figures, and Tables<br />
Table of Contents<br />
<strong>Map</strong> 1: <strong>Door</strong> <strong>County</strong> Beaches Monitored for E. coli in <strong>2005</strong>........................................................ 2<br />
Figure 1: <strong>Door</strong> <strong>County</strong> Health Department beach monitoring for E. coli public information signs.<br />
............................................................................................................................................... 37<br />
Table 1: E. coli testing May - September, 2003-<strong>2005</strong> <strong>Door</strong> <strong>County</strong>, WI..................................... 38<br />
Figure 2: E. coli testing May - September 2003-<strong>2005</strong> <strong>Door</strong> <strong>County</strong>, WI..................................... 41<br />
Figure 3: Mean E. coli count for categories of beaches in 2004................................................... 43<br />
Figure 4: Mean E. coli MPN/100mL by Location in <strong>2005</strong>........................................................... 44<br />
Figure 5: Mean E. coli count for all beaches over the summer 2004. ......................................... 45<br />
Figure 6: Entire <strong>County</strong> Mean E. coli MPN/100mL in Beach Water in <strong>2005</strong>.............................. 45<br />
Figure 7: Seasonal <strong>County</strong>wide Average E. coli MPN/100mL Beach Levels in <strong>2005</strong> ................ 46<br />
Figure 8: Depth Sampling of E. coli - <strong>Door</strong> <strong>County</strong>, WI, <strong>2005</strong>.................................................... 47<br />
Figure 9: Comparison of E. coli counts at center, left, and right at 5 subject beaches in <strong>2005</strong>.... 47<br />
Figure 10: Rainfall at three monitoring stations compared to mean E. coli count ....................... 48<br />
Figure 11: Rainfall at three monitoring stations compared to mean E. coli count ....................... 49<br />
Table 2: Significant Correlations E. coli MPN vs. 24hrs PPT <strong>2005</strong>. ........................................... 50<br />
Figure 12: Rain Event E. coli MPN/100mL of water Anclam beach <strong>2005</strong>. ................................. 51<br />
Figure 13: Rain Event E. coli MPN/100mL of water Baileys Harbor Ridges beach <strong>2005</strong>. ......... 51<br />
Figure 14: Rain Event E. coli MPN/100mL of water Egg Harbor beach <strong>2005</strong>............................ 52<br />
Figure 15: Rain Event E. coli MPN/100mL of water Ephraim beach <strong>2005</strong>................................. 52<br />
Figure 16: Rain Event E. coli MPN/100mL of water Fish Creek beach <strong>2005</strong>. ............................ 53<br />
Figure 17: Rain Event E. coli MPN/100mL of water Lakeside Park beach <strong>2005</strong>........................ 53<br />
Figure 18: Rain Event E. coli MPN/100mL of water Murphy Park beach <strong>2005</strong>.......................... 54<br />
Figure 19: Rain Event E. coli MPN/100mL of water Otumba Park beach <strong>2005</strong>.......................... 54<br />
Figure 20: Rain Event E. coli MPN/100mL of water Sister Bay beach <strong>2005</strong>. ............................. 55<br />
Figure 21: Rain Event E. coli MPN/100mL of water Sunset Park beach <strong>2005</strong>............................ 55<br />
Figure 22: Rain Event E. coli MPN/100mL of water Whitefish Dunes beach <strong>2005</strong>.................... 56<br />
Table 3: Wet Weather Beach Swimming Advisories Determination ........................................... 57<br />
Table 4: Mean E. coli in beach water on the Green Bay side of <strong>Door</strong> <strong>County</strong> in various wind<br />
conditions in 2004................................................................................................................. 58<br />
Table 5: T-Test Correlation between <strong>Door</strong> <strong>County</strong> Beach Water Samples E. coli MPN/100mL of<br />
water and Wind Direction/Type............................................................................................ 59<br />
Table 6: Correlation between Wave Height and E. coli Levels in <strong>2005</strong>....................................... 60<br />
Figure 23: Sunset Park Sand E. coli Levels vs. Water E. coli Levels <strong>2005</strong>. ................................ 60<br />
Figure 24: Baileys Harbor Sand E. coli Levels vs. Water E. coli Levels <strong>2005</strong>. ........................... 61<br />
Figure 25: Otumba Park Sand E. coli Levels vs. Water E. coli Levels <strong>2005</strong>. .............................. 61<br />
Figure 26: Fish Creek Beach Sand E. coli Levels vs. Water E. coli Levels <strong>2005</strong>. ....................... 61<br />
Figure 27: Ephraim Beach Sand E. coli Levels vs. Water E. coli Levels <strong>2005</strong>............................ 62<br />
Figure 28: Whitefish Dunes State Park Sand E. coli Levels vs. Water E. coli Levels <strong>2005</strong>. ....... 62<br />
Figure 29: Anclam Park Sand E. coli Levels vs. Water E. coli Levels <strong>2005</strong>. .............................. 62<br />
Figure 30: Lakeside Park Sand E. coli Levels vs. Water E. coli Levels <strong>2005</strong>.............................. 63<br />
Figure 31: Murphy Park Sand E. coli Levels vs. Water E. coli Levels <strong>2005</strong>. .............................. 63<br />
Figure 32: Nicolet Bay Beach Sand E. coli Levels vs. Water E. coli Levels <strong>2005</strong>. ..................... 63<br />
Figure 33: Ellison Bay Beach Sand E. coli Levels vs. Water E. coli Levels <strong>2005</strong>....................... 64<br />
Figure 34: Sister Bay Park Sand E. coli Levels vs. Water E. coli Levels <strong>2005</strong>............................ 64<br />
Figure 35: Example of Avian Waste Survey transect and sample plot areas in Otumba Park<br />
Beach..................................................................................................................................... 65<br />
Table 7: Pearson Correlation of Avian Waste, Bird Counts, and E. coli Levels in 2004............. 66<br />
Table 8: Pearson Correlation of Avian Waste, Bird Counts, and E. coli Levels in <strong>2005</strong>............. 66<br />
iii
Figure 36: Cladophora glomerata structure.................................................................................. 67<br />
Table 9: Cladophora Distribution Survey Percentages of Total Samples..................................... 68<br />
Table 10: Summary of relationships between Cladophora observations and E. coli levels at<br />
beaches during summer <strong>2005</strong>................................................................................................ 69<br />
Figure 37: Lakeside Park <strong>2005</strong> E. coli samples in Cladophora Mats. .......................................... 70<br />
Figure 38: Murphy Park <strong>2005</strong> E. coli samples in Cladophora Mats............................................. 70<br />
Figure 39: Whitefish Dunes State Park <strong>2005</strong> E. coli samples in Cladophora Mats...................... 71<br />
Figure 40: Anclam Park <strong>2005</strong> E. coli samples in Cladophora Mats............................................. 71<br />
Table 11: Pathogens detected from five selected beaches in <strong>Door</strong> <strong>County</strong> during summer 2004<br />
and <strong>2005</strong>................................................................................................................................ 72<br />
Figure 41: Quanti-Trays with positive fluorescence for E. coli.................................................... 74<br />
Table 12: Antibiotics used for antibiotic resistance testing of E. coli isolates and their<br />
concentrations. ...................................................................................................................... 75<br />
Table 13: Antibiotics used in replica plating technique and their concentration.......................... 75<br />
Figure 42: Genetic Groupings of E. coli Isolates MANOVA Results by Beach.......................... 76<br />
Figure 43: Otumba Park Storm Water Conveyance Sample Results <strong>2005</strong>................................... 81<br />
Figure 44: Ephraim Storm Water Conveyance Sample Results <strong>2005</strong> .......................................... 82<br />
Table 14: Comparison of E. coli concentrations exceeding safe swimming standards in 2004 and<br />
<strong>2005</strong>. Asterisks indicate substantial increase in <strong>2005</strong> compared to 2004............................ 84<br />
Figure 45: Bay Shore Property Association Watershed Study Summer <strong>2005</strong>.............................. 84<br />
iv
Introduction<br />
The following report addresses the E. coli monitoring and beach contamination source<br />
identification data collected in <strong>2005</strong> for <strong>Door</strong> <strong>County</strong>, Wisconsin. This report is an interim report<br />
on the current findings in the beach contamination source identification project. This report<br />
summarizes relevant results and recommendations for each individual beach in the first chapter.<br />
The methodology, full results and tables and figures detailed in chapter 2. The appendices are<br />
separate water quality monitoring efforts in <strong>Door</strong> <strong>County</strong> that impact the beaches.<br />
All findings are subject to change based on both the additional statistical analysis that will occur<br />
on the current data in the spring of 2006 and on additional data that will be collected and<br />
analyzed in 2006. This report also describes the additional work/data collection that is needed to<br />
further identify E. coli sources at <strong>Door</strong> <strong>County</strong> beaches. The data and data analyses that were<br />
completed in 2003 through <strong>2005</strong> will be used to determine the best methods for sampling in<br />
2006. In 2006 many of the E. coli sources that are not identified will be identified and the<br />
collective information on the beaches will be used to develop best management plans for the<br />
beaches and surrounding watersheds to reduce E. coli contamination levels at <strong>Door</strong> <strong>County</strong><br />
beaches. Implementation of best management plans will be the focus of the 2007 project.<br />
In 2003 through <strong>2005</strong> data were collected at 28 beach locations along both sides of the peninsula,<br />
at Washington Island, within Sturgeon Bay, and at three inland lakes (<strong>Map</strong> 1, pg 2). Ambient<br />
conditions in the field were recorded, including wind conditions, wave height, number of gulls<br />
present on the beach, and abundance of amassed Cladophora algae along the shoreline. Daily<br />
rainfall data were collected at multiple locations on the peninsula. Additional ambient weather<br />
data were collected, including barometric pressure and wind/wave conditions, at a NOAAoperated<br />
buoy located at the north end of Lake Michigan, near the north end of the <strong>Door</strong> <strong>County</strong><br />
peninsula.<br />
In <strong>2005</strong> intensive samples were repeated at Ephraim, Fish Creek, Otumba, Sister Bay, and<br />
Whitefish Dunes beaches and nine additional beaches were sampled intensively including,<br />
Portage, Sunset, Nicolet, Egg Harbor, Murphy, Ellison Bay, Baileys Harbor Ridges, Lakeside<br />
and Anclam beaches. E. coli was sampled spatially (depth of water and location on the beach)<br />
and after rain events on a temporal scale. E. coli collected and isolated from these beaches was<br />
analyzed to determine resistance to antibiotics and genetic identity, and thus determines the<br />
potential for the E. coli sources to be from human and/or animal sources. Water samples were<br />
also collected and tested for the presence of pathogens. These beaches were also sampled for E.<br />
coli after rain events and an avian waste survey was conducted at multiple beaches to determine<br />
the potential for avian waste to be an E. coli source. In <strong>2005</strong> sand samples were also collected at<br />
these beaches to determine the amount on E. coli present in beach sand.<br />
This report is a descriptive analysis of the data set collected for <strong>Door</strong> <strong>County</strong>; it includes<br />
preliminary comparisons of E. coli results with ambient conditions. It also provides some<br />
analysis of the spatial distribution of E. coli in beach water, beach sand and storm water<br />
sampling, rain event E. coli concentrations, and antibiotic resistance and genetic identity of E.<br />
coli.<br />
Additional data will be collected in the summer of 2006, focusing on collecting water samples<br />
for E. coli during rain events E. coli. In 2007 the beach project will focus on using the previous<br />
years of collected data and analysis to make final recommendations for beach improvements to<br />
reduce potential for beach water contamination. SWCD would like to work with the county,<br />
1
town, village and city administrators and beach managers to establish best beach management<br />
practices and to reduce and abate non-point pollution discharge to the beaches.<br />
<strong>Map</strong> 1: <strong>Door</strong> <strong>County</strong> Beaches Monitored for E. coli in <strong>2005</strong>.<br />
.<br />
Results and Recommendations per Beach<br />
The beach results stated in this interim beach report are subject to change based on the additional<br />
statistical analysis and the additional data that will be collected from beach contamination source<br />
identification work in 2006 and 2007. This section is an overview of beach monitoring and<br />
source identification results, source identification recommendations, and current beach<br />
management recommendations for all 29 beaches monitored for E. coli in <strong>Door</strong> <strong>County</strong>.<br />
<strong>Door</strong> <strong>County</strong> Beaches Located in the Sturgeon Bay Canal<br />
There are 2 monitored beaches located in the Sturgeon Bay Canal (Sunset Park and Otumba<br />
Park) (<strong>Map</strong> 1, pg 2). These beaches had significantly higher mean E. coli concentrations in<br />
2003-<strong>2005</strong> than all other beach locations monitored in <strong>Door</strong> <strong>County</strong> (Green Bay, Lake Michigan,<br />
Washington/Rock Islands, and inland lakes) (Figure 4, pg 44). Both of the beaches have storm<br />
water pipes, runoff areas and or stream that outlet on or near the beaches.<br />
Otumba Park Beach<br />
Public Health Beach Monitoring Results<br />
In 2003 there were 92 samples for E. coli taken in the beach water monitoring program at<br />
2
Otumba Park beach, and 5 (5.4%)of the E. coli tests exceeded the advisory level (235 E. coli<br />
/100ml of water) and none exceeded the closure level (1,000 E. coli /100ml of water) (Table 1,<br />
pg 38 and Figure 2, pg 41). In 2004 60 E. coli samples were taken, and 6 (10%) of the tests<br />
exceeded the advisory and 2 (3.3%) tests exceeded the closure level. In <strong>2005</strong> 57 E. coli samples<br />
were taken, and 6 (11%) of the tests exceeded the advisory and 2 (4%) tests exceeded the closure<br />
level.<br />
Physical Features<br />
Surveys of the physical characteristics of Otumba beach show that the beach has two storm water<br />
pipes that outlet water directly onto the beach, and several other storm water pipes that outlet<br />
water in the eastern and northwestern sides of the bay the beach is in. Storm water runoff from<br />
the parking lot and connecting streets is discharged to the beach water during moderate to heavy<br />
rainfall. The bathroom facility at this beach consists of two flush toilets. The wastewater from<br />
these toilets and from the residents that are within the entire bay of the beach is treated by a<br />
municipal wastewater treatment facility.<br />
Rain Event E. coli Sampling<br />
Water sampling during rain events revealed E. coli levels in beach water that exceeded the<br />
advisory level within 24 hours in all 8 sampled rain events, and exceeded closure levels in 6 of<br />
the 8 sampled rain events (Figure 19, pg 54). There were no correlations between rainfall 24, 48<br />
or 72 hours prior to high E. coli MPN/100mL in a monitoring beach water sample. This may<br />
indicate that there is a relationship between elevated E. coli levels and rain events for up to 24<br />
hours after the rain event. See Appendix A for storm water pipe and catch basin E. coli results.<br />
Impact of Wind and Waves<br />
Elevated E. coli counts are related to wind out of the E (long shore) than when out of the N, NE,<br />
NW, and W (on shore and barrier) in <strong>2005</strong> (Table 5, pg 59). Elevated E. coli counts were not<br />
correlated to wave height in <strong>2005</strong> (Table 6, pg 60).<br />
E. coli Levels in Beach Sands<br />
Overall the E. coli levels in the sand were fairly low (Figure 25, pg 61). There were occasions<br />
when the E. coli levels in the sand were above the beach water advisory level of 235<br />
MPN/100mL. The swash zone samples were typically higher in E. coli than the sand samples<br />
taken up shore of in sand located 6-12” underwater.<br />
Impact of Birds<br />
There was no correlation between bird counts or the amount of bird waste and E. coli in 2004 or<br />
<strong>2005</strong>, indicating that the number of birds present at the time of water sampling, and the amount<br />
of bird waste calculated in the survey may not have a significant effect on the E. coli<br />
concentrations at the beach (Table 7 and Table 8, pg 66).<br />
Pathogen Testing in Beach Water<br />
Shigella and Salmonella pathogens were not found at Otumba beach in 2004 or <strong>2005</strong>, but<br />
Campylobacter was found in 69% of the beach water samples taken for pathogens in 2004, and<br />
in 36% from <strong>2005</strong> (Table 11, pg 72). The pathogens tests done could not identify individual<br />
strains of Campylobacter. The Campylobacter that was found did not match any of the known<br />
human strains.<br />
E. coli Identity/Sources<br />
The antibiotic resistance testing and the genetic fingerprinting of E. coli isolates collected in<br />
2004 and <strong>2005</strong> from Otumba beach both indicate that E. coli isolates are from multiple sources,<br />
3
human, avian, dog and other unidentified sources (Figure 41, pg 74). This indicates that the E.<br />
coli is not coming from one obvious source, but instead it is accumulating from many sources<br />
and being transported to the beach.<br />
Summary<br />
Overall these results indicate that the emphasis should be on the remediation of the delivery<br />
system that is transporting the accumulation of many sources to the beach. The delivery system<br />
at Otumba beach consists mainly of storm water pipes discharging on the beach. The physical<br />
survey indicates that the immediate potential sources of E. coli at Otumba beach are storm water<br />
from storm water pipes and parking lot runoff, and re-suspension of potentially contaminated<br />
near shore beach sediments caused by wave activity.<br />
Recommendations for additional source identification work:<br />
Test additional E. coli concentrations during rain events and determining the identity of E. coli in<br />
the near shore beach sands and storm water pipes, and in Cladophora algae mats. Continue<br />
avian counts during the beach monitoring E. coli sample collection, and discontinue the avian<br />
waste survey. Additional sampling for pathogens, especially testing to determine the specific<br />
source of Campylobacter should be done.<br />
Beach management recommendations and requirements for the 2006:<br />
Recommended: considering measures to reduce storm water runoff to the beach.<br />
Required: post wet weather beach swimming advisory sign at the beach for 24 hours after all rain<br />
events of ¼ inches with 24 hours. The wet weather beach swimming advisory is required to<br />
protect public health immediately after rain events that are likely to result in closure E. coli<br />
levels, since the current method of determining E. coli levels in beach water takes a minimum of<br />
18 hours to process.<br />
Sunset Park Beach (Sturgeon Bay)<br />
Public Health Beach Monitoring Results<br />
In 2003 there were 91 samples for E. coli taken in the beach water monitoring program at Sunset<br />
beach, and 9 (9.9%) of the E. coli tests exceeded the advisory level (235 E. coli /100ml of<br />
water) and 1 (1.1%) exceeded the closure level (1,000 E. coli /100ml of water) (Table 1, pg 38<br />
and Figure 2, pg 41). In 2004 58 E. coli samples were taken, and 12 (20.7%) of the tests<br />
exceeded the advisory and 1 (1.7%) test exceeded the closure level. In <strong>2005</strong> 58 E. coli samples<br />
were taken, and 12 (21%) of the tests exceeded the advisory and 4 (7%) test exceeded the closure<br />
level.<br />
Physical Features<br />
Surveys of the physical characteristics of Sunset beach show that the beach has several storm<br />
water pipes that outlet water to the north of the beach. One of these outlets pipes delivers water<br />
from Bradley Lake which serves as a storm water retention system for a large area in Sturgeon<br />
Bay. Large areas of impervious surface at an industrial land use area along the southern<br />
shoreline adjacent to the beach result in water runoff during rainfall. There is also a substantial<br />
amount of runoff at the boat launch that is adjacent to the beach from the parking lot and streets.<br />
The bathroom facility at this beach consists of two flush toilets. The wastewater from these<br />
toilets and from the residents that are within the entire bay of the beach is treated by a municipal<br />
wastewater treatment facility.<br />
Rain Event E. coli Sampling<br />
E. coli concentrations were tested during 5 rain events in 2004 and 2 rain events in <strong>2005</strong> at<br />
Sunset Park (Figure 21, pg 55). E. coli concentrations were tested at 1, 2, 3, 4, 8, 12, and 24<br />
4
hours after 0.5 inches of rain within 24 hours. The E. coli levels exceeded the advisory level<br />
within 24 hours in all 7 sampled rain events, and the closure level was exceeded in 2 of the 7<br />
sampled rain events. There were no correlations between rainfall 24, 48 or 72 hours prior to high<br />
E. coli MPN/100mL in a monitoring beach water sample. This may indicate that there is a<br />
relationship between elevated E. coli levels and rain events for up to 24 hours after the rain event<br />
(Table 2, pg 50).<br />
Impact of Wind and Waves<br />
Elevated E. coli counts are related to wind out of the North and South more than when the wind<br />
is out of the NE, E, and SE. Wind out of the N and S blows parallel to the shoreline but is<br />
somewhat blocked by barriers (Table 5, pg 59). Elevated E. coli counts were correlated to wave<br />
height in <strong>2005</strong> (Table 6, pg 60).<br />
E. coli Levels in Beach Sands<br />
Overall the E. coli levels in the sand were fairly low (Figure 23, pg 60). There were occasions<br />
when the E. coli levels in the sand were above the beach water advisory level of 235<br />
MPN/100mL. The swash zone samples were typically higher in E. coli than the sand samples<br />
taken up shore of in sand located 6-12” underwater. However there were some samples in the up<br />
shore and wet sand areas that exceeded the water advisory level.<br />
Impact of Birds<br />
There was no correlation between bird counts or the amount of bird waste and E. coli in 2004 or<br />
<strong>2005</strong>, indicating that the number of birds present at the time of water sampling, and the amount<br />
of bird waste calculated in the survey may not have a significant effect on the E. coli<br />
concentrations at the beach (Table 7 and Table 8, pg 66).<br />
Pathogen Testing in Beach Water<br />
Shigella and Salmonella pathogens were not found at Sunset beach in <strong>2005</strong>, but Campylobacter<br />
was found in 42% of the samples taken in <strong>2005</strong> (Table 11, pg 72). The pathogens tests done<br />
could not identify individual strains of Campylobacter. Therefore it is not known if the<br />
Campylobacter was from a human or avian source. However the Campylobacter that was found<br />
did not match any of the known human strains.<br />
E. coli Identity/Sources<br />
The antibiotic resistance testing and the genetic fingerprinting of E. coli isolates collected in<br />
<strong>2005</strong> from Sunset Park beach indicate that E. coli isolates are from multiple sources, human,<br />
avian, dog and other unidentified sources (Figure 41, pg 74). This indicates that the E. coli is<br />
not coming from one obvious source, but instead it is accumulating from many sources and being<br />
transported to the beach. This finding takes the emphasis off of the remediation of one source<br />
and places it on remediation of the delivery system that is transporting the accumulation of many<br />
sources to the beach.<br />
Summary<br />
Overall these results indicate that the emphasis should be on the remediation of the delivery<br />
system that is transporting the accumulation of many sources to the beach. The delivery system<br />
at Sunset beach consists mainly of storm water runoff from impervious surfaces discharging on<br />
the beach. The immediate potential sources of E. coli at Sunset beach are storm water from<br />
shoreline and parking lot runoff and re-suspension of potentially contaminated near shore beach<br />
sediments caused by wave activity.<br />
5
Recommendations for additional source identification work:<br />
Test additional E. coli concentrations during rain events and determining the identity of E. coli in<br />
the near shore beach sands and storm water pipes, and in Cladophora algae mats. Continue<br />
avian counts during the beach monitoring Ecolab sample collection, and discontinue the avian<br />
waste survey. Additional sampling for pathogens, especially testing to determine the specific<br />
source of Campylobacter should be done.<br />
Beach management recommendations and requirements for the 2006:<br />
Recommended: considering measures to reduce storm water runoff to the beach.<br />
Required: post wet weather beach swimming advisory sign at the beach for 24 hours after all rain<br />
events of ¼ inches with 24 hours. The wet weather beach swimming advisory is required to<br />
protect public health immediately after rain events that are likely to result in closure E. coli<br />
levels, since the current method of determining E. coli levels in beach water takes a minimum of<br />
18 hours to process.<br />
<strong>Door</strong> <strong>County</strong> Beaches Located on Green Bay<br />
There are 8 monitored beaches located on the Green Bay side of the peninsula (Fish Creek Park,<br />
Ephraim Beach, Sister Bay Park, Ellison Bay Park, Egg Harbor Park, Murphy Park, Nicolet Bay,<br />
and Haines Park) (<strong>Map</strong> 1, pg 2). These beaches have significantly higher mean E. coli<br />
concentrations than the beaches located on Lake Michigan, Washington/Rock Islands, and inland<br />
lakes in <strong>Door</strong> <strong>County</strong> (Figure 4, pg 44). Beaches located on Green Bay had a significantly lower<br />
mean E. coli than beaches located in the Sturgeon Bay Canal. Seven (87%) of the 8 beaches on<br />
Green Bay have storm water pipes/streams that outlet on or near the beaches.<br />
Fish Creek Beach<br />
Public Health Beach Monitoring Results<br />
In 2003 there were 88 samples for E. coli taken in the monitoring program at Fish Creek beach,<br />
and 3 (3.4%) of the E. coli tests exceeded the advisory level (235 E. coli /100ml of water) and<br />
none exceeded the closure level (1,000 E. coli /100ml of water) (Table 1, pg 38 and Figure 2, pg<br />
41). In 2004 57 E. coli samples were taken, and 5 (8.8%) of the tests exceeded the advisory and<br />
1 (1.8%) test exceeded the closure level. In <strong>2005</strong> 57 E. coli samples were taken, and 5 (9%) of<br />
the tests exceeded the advisory and 3 (5%) test exceeded the closure level.<br />
Physical Features<br />
Surveys of the physical characteristics of Fish Creek beach show that the beach has a storm<br />
water pipe that outlets storm water directly onto the beach. Storm water runs off from the<br />
parking lot and connecting streets onto the beach. There are two storm water pipes that outlet<br />
water upstream from the mouth of a creek (Fish Creek), located in the eastern corner of the bay.<br />
There are also several storm water pipes and runoff areas at the marinas located on the western<br />
end of the bay. The bathroom facility at this beach consists of a portable outhouse and<br />
wastewater from the residents that are within the entire bay of the beach is treated by a municipal<br />
waste water treatment facility.<br />
Rain Event E. coli Sampling<br />
E. coli concentrations were tested during 1 rain event in 2004 and 1 rain event in <strong>2005</strong> at Fish<br />
Creek Beach (Figure 16, pg 53). E. coli concentrations were tested at 1, 2, 3, 4, 8, 12, and 24<br />
hours after 0.5 inches of rain within 24 hours. The E. coli levels exceeded the advisory and<br />
closure levels within 24 hours in both sampled rain events. Overall the rain event results indicate<br />
that E. coli levels exceed the advisory level and closure level after a rain event. There were<br />
significant correlations between rainfall 24, 48 or 72 hours prior to high E. coli MPN/100mL and<br />
E. coli levels in a monitoring beach water sample. This may indicate that there is a relationship<br />
6
etween elevated E. coli levels and rain events for up to 72 hours after the rain event (Table 2, pg<br />
50).<br />
Impact of Wind and Waves<br />
In <strong>2005</strong> there was no correlation found between elevated E. coli counts and wind. There was a<br />
correlation between elevated E. coli counts and wave height in <strong>2005</strong> (Table 6, pg 60).<br />
E. coli Levels in Beach Sands<br />
Overall the E. coli levels in the sand were fairly low (Figure 26, pg 61). There were occasions<br />
when the E. coli levels in the sand were above the beach water advisory level of 235<br />
MPN/100mL. The swash zone samples were typically higher in E. coli than the sand samples<br />
taken up shore of in sand located 6-12” underwater.<br />
Impact of Birds<br />
There was no correlation between bird counts or the amount of bird waste and E. coli in 2004 or<br />
<strong>2005</strong>, indicating that the number of birds present at the time of water sampling, and the amount<br />
of bird waste calculated in the survey may not have a significant effect on the E. coli<br />
concentrations at the beach (Table 7 and Table 8, pg 66).<br />
Pathogen Testing in Beach Water<br />
There were no pathogens (Shigella, Salmonella, Campylobacter) found in the beach water at<br />
Fish Creek beach in <strong>2005</strong>.<br />
E. coli Identity/Sources<br />
The antibiotic resistance testing and the genetic fingerprinting of E. coli isolates collected in<br />
2004 and <strong>2005</strong> from Fish Creek beach indicate that E. coli isolates are from multiple sources,<br />
human, avian, dog and other unidentified sources (Figure 41, pg Figure 41: Quanti-Trays with<br />
positive fluorescence for E. coli). This indicates that the E. coli is not coming from one obvious<br />
source, but instead it is accumulating from many sources and being transported to the beach.<br />
This finding takes the emphasis off of the remediation of one source and places it on remediation<br />
of the delivery system that is transporting the accumulation of many sources to the beach.<br />
Summary<br />
Overall these results indicate that the emphasis should be on the remediation of the delivery<br />
system that is transporting the accumulation of many sources to the beach. The delivery system<br />
at Fish Creek Beach consists mainly of storm water pipe and parking lot runoff discharging on<br />
the beach. The immediate potential sources of E. coli at Fish Creek beach are storm water from<br />
storm water outfall pipes located near the beach, and parking lot runoff, and re-suspension<br />
caused by wave activity of potentially contaminated near shore beach sediments.<br />
Recommendations for additional source identification work:<br />
Test additional E. coli concentrations during rain events and determining the identity of E. coli in<br />
the near shore beach sands and storm water pipes, and in Cladophora algae mats. Continue<br />
avian counts during the beach monitoring Ecolab sample collection, and discontinue the avian<br />
waste survey. No additional water samples need to be taken at Fish Creek beach for pathogens<br />
unless a problem arises that indicates a need.<br />
Beach management recommendations and requirements for the 2006:<br />
Recommended: considering measures to reduce storm water runoff to the beach.<br />
Required: post wet weather beach swimming advisory sign at the beach for 24 hours after all rain<br />
events of ¼ inches with 24 hours. The wet weather beach swimming advisory is required to<br />
7
protect public health immediately after rain events that are likely to result in closure E. coli<br />
levels, since the current method of determining E. coli levels in beach water takes a minimum of<br />
18 hours to process.<br />
Ephraim Beach<br />
Public Health Beach Monitoring Results<br />
In 2003 there were 86 samples for E. coli taken in the monitoring program at Ephraim beach,<br />
and none of the E. coli tests exceeded the advisory (235 E. coli /100ml of water) or closure<br />
levels (1,000 E. coli /100ml of water) (Table 1, pg 38 and Figure 2, pg 41). In 2004 there were<br />
57 E. coli samples taken, and none of the E. coli tests exceeded the advisory or closure levels. In<br />
<strong>2005</strong> 56 E. coli samples were taken, and 3 (5%) of the tests exceeded the advisory and 1 (2%)<br />
test exceeded the closure level.<br />
Physical Features<br />
Surveys of the physical characteristics of Ephraim beach show that the beach has multiple storm<br />
water pipes that discharge around the bay and three streams that outlet water, one in the<br />
southwestern and two in the northeastern regions of the bay. Storm water runoff from the<br />
parking lot and connecting streets discharges through a relatively small storm water pipe near the<br />
beach. There bathroom facility at this beach consists of two flush toilets. The wastewater from<br />
these toilets and from the residents that are within the entire bay of the beach is treated by a<br />
municipal wastewater treatment facility.<br />
Rain Event E. coli Sampling<br />
In 2004 and <strong>2005</strong> E. coli concentrations were tested at 1, 2, 3, 4, 8, 12, and 24 hours after 0.25<br />
inches of rain within 24 hours. The E. coli levels exceeded the advisory and closure levels<br />
within 24 hours in 4 sampled rain events (Figure 15, pg 52). Overall the rain event results<br />
indicate that E. coli levels exceed the advisory level and closure level after a rain event. There<br />
were significant correlations between rainfall 24, 48 or 72 hours prior to high E. coli<br />
MPN/100mL and E. coli levels in a monitoring beach water sample. This may indicate that there<br />
is a relationship between elevated E. coli levels and rain events for up to 72 hours after the rain<br />
event (Table 2, pg 50).<br />
Impact of Wind and Waves<br />
In <strong>2005</strong> elevated Ecolab counts at Ephraim beach are related to wind out of the N, W, NW, NE,<br />
and SW (long and onshore) more than when out of the E, SE, and S (offshore) (Table 5, pg 59).<br />
There was no correlation between elevated E. coli counts and wave height in <strong>2005</strong>.<br />
E. coli Levels in Beach Sands<br />
Overall the E. coli levels in the sand were fairly low (Figure 27, pg 62). There were occasions<br />
when the E. coli levels in the sand were above the beach water advisory level of 235<br />
MPN/100mL. The swash zone samples were typically higher in E. coli than the sand samples<br />
taken up shore of in sand located 6-12” underwater.<br />
Impact of Birds<br />
There was no correlation between bird counts or the amount of bird waste and E. coli in 2004 or<br />
<strong>2005</strong>, indicating that the number of birds present at the time of water sampling, and the amount<br />
of bird waste calculated in the survey may not have a significant effect on the E. coli<br />
concentrations at the beach (Table 7 and Table 8, pg 66).<br />
8
Pathogen Testing in Beach Water<br />
There were no pathogens (Shigella, Salmonella, Campylobacter) were found in the Ephraim<br />
beach water in <strong>2005</strong>.<br />
E. coli Identity/Sources<br />
The antibiotic resistance testing and the genetic fingerprinting of E. coli isolates collected in<br />
2004 and <strong>2005</strong> from Ephraim beach indicate that E. coli isolates are from multiple sources,<br />
human, avian, dog and other unidentified sources (Figure 41, pg 74). This indicates that the E.<br />
coli is not coming from one obvious source, but instead it is accumulating from many sources<br />
and being transported to the beach. This finding takes the emphasis off of the remediation of one<br />
source and places it on remediation of the delivery system that is transporting the accumulation<br />
of many sources to the beach.<br />
Summary<br />
Overall these results indicate that the emphasis should be on the remediation of the delivery<br />
system that is transporting the accumulation of many sources to the beach. The delivery system<br />
at Ephraim beach consists mainly of culvert streams, storm water pipes and parking lot runoff<br />
discharging on the beach. The immediate potential sources of E. coli at Ephraim beach are<br />
stream discharge, storm water from parking lot/street runoff and re-suspension caused by wave<br />
activity of potentially contaminated near shore beach sediments.<br />
Recommendations for additional source identification work:<br />
Test additional E. coli concentrations during rain events and determining the identity of E. coli in<br />
the near shore beach sands and storm water pipes, and in Cladophora algae mats. Continue<br />
avian counts during the beach monitoring Ecolab sample collection, and discontinue the avian<br />
waste survey. No additional water samples need to be taken for pathogens unless a problem<br />
arises that indicates a need.<br />
Beach management recommendations and requirements for the 2006:<br />
Recommended: considering measures to reduce storm water runoff to the beach.<br />
Required: post wet weather beach swimming advisory sign at the beach for 24 hours after all rain<br />
events of ¼ inches with 24 hours. The wet weather beach swimming advisory is required to<br />
protect public health immediately after rain events that are likely to result in closure E. coli<br />
levels, since the current method of determining E. coli levels in beach water takes a minimum of<br />
18 hours to process.<br />
Sister Bay Park Beach<br />
Public Health Beach Monitoring Results<br />
In 2003 there were 85 samples for E. coli taken in the monitoring program at Sister Bay beach,<br />
and 4 (4.7%) of the E. coli tests exceeded the advisory level (235 E. coli /100ml of water) and<br />
none exceeded the closure level (1,000 E. coli /100ml of water) (Table 1, pg 38 and Figure 2, pg<br />
41). In 2004 55 E. coli samples were taken, and 3 (5.4%) of the tests exceeded the advisory and<br />
1 (1.8%) test exceeded the closure level. In <strong>2005</strong> 57 E. coli samples were taken, and 3 (5%) of<br />
the tests exceeded the advisory and no tests exceeded the closure level.<br />
Physical Features<br />
Surveys of the physical characteristics of Sister Bay beach show that the beach has one storm<br />
water pipe that outlets directly onto the beach and multiple storm water pipes and runoff areas<br />
that outlet in the southwestern and northeastern regions of the bay. The bathroom facility at this<br />
beach consists of two flush toilets. The wastewater from these toilets and from the residents that<br />
are within the entire bay of the beach is treated by a municipal wastewater treatment facility.<br />
9
Rain Event E. coli Sampling<br />
E. coli concentrations were tested during 1 rain event in 2004 and 1 rain event in <strong>2005</strong> at Sister<br />
Bay beach (Figure 20, pg 55). E. coli concentrations were tested at 1, 2, 3, 4, 8, 12, and 24 hours<br />
after 0.5 inches of rain within 24 hours. The E. coli levels exceeded the advisory in both<br />
sampled rain events and exceeded the closure levels in 1 rain event within 24 hours. Overall the<br />
rain event results indicate that E. coli levels increase during rain events and exceed the advisory<br />
level and closure level after a rain event. There were no significant correlations between rainfall<br />
24, 48 or 72 hours prior to high E. coli MPN/100mL and E. coli levels in a monitoring beach<br />
water sample. This may indicate that there is a relationship between elevated E. coli levels and<br />
rain events for up to 24 hours after the rain event (Table 2, pg 50).<br />
Impact of Wind and Waves<br />
Elevated Ecolab counts at Sister Bay beach are related to wind out of the N, W, and NW<br />
(onshore) more than when out of the E, SE, S, and SW (offshore) (Table 5, pg 59). There was no<br />
correlation between elevated E. coli counts and wave height in <strong>2005</strong>.<br />
E. coli Levels in Beach Sands<br />
The E. coli levels in the sand were never above the beach water advisory level of 235<br />
MPN/100mL (Figure 34, pg 64).<br />
Impact of Birds<br />
There was no correlation between bird counts or the amount of bird waste and E. coli in 2004 or<br />
<strong>2005</strong>, indicating that the number of birds present at the time of water sampling, and the amount<br />
of bird waste calculated in the survey may not have a significant effect on the E. coli<br />
concentrations at the beach (Table 7 and Table 8, pg 66).<br />
Pathogen Testing in Beach Water<br />
No pathogens (Shigella, Salmonella, and Campylobacter) were found in the Sister Bay beach<br />
water in <strong>2005</strong>.<br />
E. coli Identity/Sources<br />
The antibiotic resistance testing and the genetic fingerprinting of E. coli isolates collected in<br />
2004 and <strong>2005</strong> from Sister Bay beach indicate that E. coli isolates are from multiple sources,<br />
human, avian, dog and other unidentified sources (Figure 41, pg 74). This indicates that the E.<br />
coli is not coming from one obvious source, but instead it is accumulating from many sources<br />
and being transported to the beach. This finding takes the emphasis off of the remediation of one<br />
source and places it on remediation of the delivery system that is transporting the accumulation<br />
of many sources to the beach. This delivery system at Sister Bay beach consists mainly of storm<br />
water pipes and impervious surface runoff discharging on and near the beach. Additional E. coli<br />
concentrations and isolates need to be taken from the storm water pipe.<br />
Summary<br />
Overall these results indicate that the emphasis should be on the remediation of the delivery<br />
system that is transporting the accumulation of many sources to the beach. The delivery system<br />
at the beach consists mainly of storm water pipes and impervious surface runoff discharging near<br />
the beach. The immediate potential sources of E. coli at Sister Bay beach are storm water from<br />
storm water outfall pipes and impervious runoff areas, and re-suspension caused by wave activity<br />
of potentially contaminated near shore beach sediments.<br />
10
Recommendations for additional source identification work:<br />
Test additional E. coli concentrations during rain events and determining the identity of E. coli in<br />
the near shore beach sands and storm water pipes, and in Cladophora algae mats. Continue<br />
avian counts during the beach monitoring Ecolab sample collection, and discontinue the avian<br />
waste survey. No additional water samples need to be taken at Sister Bay beach for pathogens<br />
unless a problem arises that indicates a need.<br />
Beach management recommendations and requirements for the 2006:<br />
Recommended: considering measures to reduce storm water runoff to the beach.<br />
Required: none at this time.<br />
Ellison Bay Park Beach<br />
Public Health Beach Monitoring Results<br />
In 2003 there were 89 samples for E. coli taken in the monitoring program at Ellison Bay beach,<br />
and 3 (3.4%)of the E. coli tests exceeded the advisory level (235 E. coli /100ml of water) and 1<br />
(1.1%) exceeded the closure level (1,000 E. coli /100ml of water) (Table 1, pg 38 and Figure 2,<br />
pg 41). In 2004 58 E. coli samples were taken, and 5 (8.6%) of the tests exceeded the advisory<br />
and 1 (1.7%) test exceeded the closure level. In <strong>2005</strong> 57 E. coli samples were taken, and 3 (5%)<br />
of the tests exceeded the advisory and no tests exceeded the closure level.<br />
Physical Features<br />
Surveys of the physical characteristics of Ellison Bay beach show that the beach has a storm<br />
water pipe that outlets water onto the beach and several other storm water pipes within the bay to<br />
the north of the beach. Storm water runs off from the parking lot on to the beach. The bathroom<br />
facility at this beach consists of several flush toilets. The wastewaters from these toilets and<br />
from the residents that are within the entire bay of the beach are treated by onsite private<br />
wastewater treatment systems.<br />
Rain Event E. coli Sampling<br />
There were no rain event E. coli water samples taken at Ellison Bay beach. There were no<br />
significant correlations between rainfall 24, 48 or 72 hours prior to high E. coli MPN/100mL and<br />
Ecolab (Table 2, pg 50).<br />
Impact of Wind and Waves<br />
Elevated Ecolab counts are related to wind out of the E, W, NW (barrier) than when out of the S,<br />
and SW (offshore) at Ellison Bay beach (Table 5, pg 59). There was no correlation between<br />
elevated E. coli counts and wave height in <strong>2005</strong>.<br />
E. coli Levels in Beach Sands<br />
The E. coli levels in the sand were never above the beach water advisory level of 235<br />
MPN/100mL (Figure 33, pg 64).<br />
Impact of Birds<br />
There was no correlation between bird counts or the amount of bird waste and E. coli in 2004 or<br />
<strong>2005</strong>, indicating that the number of birds present at the time of water sampling, and the amount<br />
of bird waste calculated in the survey may not have a significant effect on the E. coli<br />
concentrations at the beach (Table 7 and Table 8, pg 66).<br />
Pathogen Testing in Beach Water<br />
Shigella and Salmonella pathogens were not found at Ellison Bay beach in <strong>2005</strong>, but<br />
Campylobacter was found in 33% of the samples taken in <strong>2005</strong> (Table 11, pg 72). The<br />
11
pathogens tests done could not identify individual strains of Campylobacter. Therefore it is not<br />
known if the Campylobacter was from a human or avian source. However the Campylobacter<br />
that was found did not match any of the known human strains.<br />
E. coli Identity/Sources<br />
The antibiotic resistance testing and the genetic fingerprinting of E. coli isolates collected in<br />
2004 and <strong>2005</strong> from Sister Bay beach indicate that E. coli isolates are from multiple sources,<br />
human, avian, dog and other unidentified sources (Figure 40, pg 71). This indicates that the E.<br />
coli is not coming from one obvious source, but instead it is accumulating from many sources<br />
and being transported to the beach. This finding takes the emphasis off of the remediation of one<br />
source and places it on remediation of the delivery system that is transporting the accumulation<br />
of many sources to the beach.<br />
Summary<br />
Overall these results indicate that the emphasis should be on the remediation of the delivery<br />
system that is transporting the accumulation of many sources to the beach. This delivery system<br />
at Ellison Bay beach consists mainly of storm water pipes and impervious surface runoff<br />
discharging on and near the beach. The immediate potential sources of E. coli at Ellison Bay<br />
beach are storm water from the storm water pipe that is on the beach, shoreline and parking lot<br />
runoff caused by rainfall, and re-suspension caused by wave activity of potentially contaminated<br />
beach sediments.<br />
Recommendations for additional source identification work:<br />
Test additional E. coli concentrations during rain events and determining the identity of E. coli in<br />
the near shore beach sands and storm water pipes, and in Cladophora algae mats. Continue<br />
avian counts during the beach monitoring Ecolab sample collection, and discontinue the avian<br />
waste survey. Additional sampling for pathogens, especially testing to determine the specific<br />
source of Campylobacter should be done.<br />
Beach management recommendations and requirements for the 2006:<br />
Recommended: considering measures to reduce storm water runoff to the beach.<br />
Required: none at this time.<br />
Egg Harbor Park Beach<br />
Public Health Beach Monitoring Results<br />
In 2003 there were 87 samples for E. coli taken in the monitoring program at Egg Harbor beach,<br />
and 3 (3.4%)of the E. coli tests exceeded the advisory level (235 E. coli /100ml of water) and 1<br />
(1.1%) exceeded the closure level (1,000 E. coli /100ml of water) (Table 1, pg 38 and Figure 2,<br />
pg 41). In 2004 there were 57 E. coli samples taken, and 8 (14%) of the E. coli tests exceeded<br />
the advisory level (235 E. coli /100ml of water) and 1(1.8%) exceeded the closure level (1,000 E.<br />
coli /100ml of water). In <strong>2005</strong> there were 56 E. coli samples taken, and 3 (5%) of the E. coli<br />
tests exceeded the advisory level (235 E. coli /100ml of water) and 1(2%) exceeded the closure<br />
level (1,000 E. coli /100ml of water).<br />
Physical Features<br />
Surveys of the physical characteristics of Egg Harbor beach show that storm water runs off the<br />
parking lot onto the beach. There are also several storm water pipe outlets located in the bay<br />
surrounding the beach. The bathroom facility at this beach consists of several flush toilets. The<br />
wastewaters from these toilets and from the residents that are within the entire bay of the beach<br />
are treated at a municipal wastewater treatment facility.<br />
12
Rain Event E. coli Sampling<br />
E. coli concentrations were tested during 3 rain events in <strong>2005</strong> at Egg Harbor beach (Figure 14,<br />
pg 52). E. coli concentrations were tested at 1, 2, 3, 4, 8, 12, and 24 hours after 0.5 inches of rain<br />
within 24 hours. The E. coli levels exceeded the advisory in 1 sampled rain event and exceeded<br />
the closure levels in 1 rain event within 24 hours. Overall the rain event results indicate that E.<br />
coli levels increase during rain events and exceed the advisory level and closure level after a rain<br />
event. There were no significant correlations between rainfall 24, 48 or 72 hours prior to high E.<br />
coli MPN/100mL and E. coli levels in a monitoring beach water sample. This may indicate that<br />
there is a relationship between elevated E. coli levels and rain events for up to 24 hours after the<br />
rain event (Table 2, pg 50).<br />
Impact of Wind and Waves<br />
At Egg Harbor wind out of the E, W, NW (barrier/on) is more related to elevated Ecolab levels<br />
than when out of the S and SW (offshore) (Table 5, pg 59). There was a correlation between<br />
elevated E. coli counts and wave height in <strong>2005</strong>.<br />
Impact of Birds<br />
There was no correlation between bird counts or the amount of bird waste and E. coli in 2004 or<br />
<strong>2005</strong>, indicating that the number of birds present at the time of water sampling, and the amount<br />
of bird waste calculated in the survey may not have a significant effect on the E. coli<br />
concentrations at the beach (Table 7 and Table 8, pg 38).<br />
Pathogen Testing in Beach Water<br />
No pathogen testing was done at Egg Harbor beach.<br />
E. coli Identity/Sources<br />
The antibiotic resistance testing and the genetic fingerprinting of E. coli isolates collected in<br />
2004 and <strong>2005</strong> from Egg Harbor beach indicate that E. coli isolates are from multiple sources,<br />
human, avian, dog and other unidentified sources (Figure 41, pg 74). This indicates that the E.<br />
coli is not coming from one obvious source, but instead it is accumulating from many sources<br />
and being transported to the beach. This finding takes the emphasis off of the remediation of one<br />
source and places it on remediation of the delivery system that is transporting the accumulation<br />
of many sources to the beach. This delivery system at the beach consists mainly of storm water<br />
pipes and impervious surface runoff discharging on and near the beach.<br />
Summary<br />
Overall these results indicate that the emphasis should be on the remediation of the delivery<br />
system that is transporting the accumulation of many sources to the beach. The delivery system<br />
for Egg Harbor is direct impervious surface runoff. The immediate potential sources of E. coli<br />
at Egg Harbor beach are storm water from the runoff area and re-suspension of potentially<br />
contaminated near shore beach sediments by wave activity.<br />
Recommendations for additional source identification work:<br />
Test additional E. coli concentrations during rain events and determining the identity of E. coli in<br />
the near shore beach sands and storm water pipes, and in Cladophora algae mats. Continue<br />
avian counts during the beach monitoring Ecolab sample collection, and discontinue the avian<br />
waste survey. Additional sampling for pathogens, especially testing to determine the specific<br />
source of Campylobacter should be done.<br />
Beach management recommendations and requirements for the 2006:<br />
Recommended: consider measures to reduce storm water runoff to the beach.<br />
Required: none at this time.<br />
13
Murphy Park Beach<br />
Public Health Beach Monitoring Results<br />
In 2003 there were 86 samples for E. coli taken in the monitoring program at Murphy beach, and<br />
1 (1.2%) of the E. coli tests exceeded the advisory level (235 E. coli /100ml of water) and<br />
closure level (1,000 E. coli /100ml of water) (Table 1, pg 38 and Figure 2, pg 41). In 2004 there<br />
were 59 E. coli samples taken, and 7 (11.9%) of the E. coli tests exceeded the advisory level and<br />
4 (6.8%) exceeded the closure level. In <strong>2005</strong> there were 57 E. coli samples taken, and 6 (11%)<br />
of the E. coli tests exceeded the advisory level and 2 (4%) exceeded the closure level.<br />
Physical Features<br />
Surveys of the physical characteristics of Murphy beach show that the beach has an impervious<br />
run off area and an intermittent stream that both outlet storm water on to the beach. There are<br />
also several other storm water pipe outlets located in the bay north of the beach. The bathroom<br />
facility at this beach consists of several concrete pit toilets. Wastewater from the residents that<br />
are within the entire bay of the beach is treated by onsite wastewater treatment systems.<br />
Rain Event E. coli Sampling<br />
E. coli concentrations were tested during 3 rain events in <strong>2005</strong> at Murphy Park beach (Figure 18,<br />
pg 54). E. coli concentrations were tested at 1, 2, 3, 4, 8, 12, and 24 hours after 0.5 inches of rain<br />
within 24 hours. The E. coli levels exceeded the advisory in 3 sampled rain events and exceeded<br />
the closure levels in 2 rain events within 24 hours. Overall the rain event results indicate that E.<br />
coli levels increase during rain events and exceed the advisory level and closure level after a rain<br />
event. There was a correlation between rainfall 24 hours prior to high E. coli MPN/100mL and<br />
E. coli levels in a monitoring beach water sample. There were no significant correlations<br />
between rainfall that fell 48 to 72 hours prior to high E. coli MPN/100mL and E. coli levels in a<br />
monitoring beach water sample. This may indicate that there is a relationship between elevated<br />
E. coli levels and rain events for up to 24 hours after the rain event (Table 2, pg 50).<br />
Impact of Wind and Waves<br />
In <strong>2005</strong> there was no correlation found between elevated E. coli counts and wind. There was a<br />
correlation between elevated E. coli counts and wave height in <strong>2005</strong> (Table 6, pg 60).<br />
E. coli Levels in Beach Sands<br />
Overall the E. coli levels in the sand were fairly low. There were occasions when the E. coli<br />
levels in the sand were above the beach water advisory level of 235 MPN/100mL. The swash<br />
zone samples were typically higher in E. coli than the sand samples taken up shore of in sand<br />
located 6-12” underwater.<br />
Impact of Birds<br />
There was no correlation between bird counts or the amount of bird waste and E. coli in 2004 or<br />
<strong>2005</strong>, indicating that the number of birds present at the time of water sampling, and the amount<br />
of bird waste calculated in the survey may not have a significant effect on the E. coli<br />
concentrations at the beach (Table 7 and Table 8, pg 66).<br />
Pathogen Testing in Beach Water<br />
Shigella and Salmonella pathogens were not found at Murphy Park beach in <strong>2005</strong>, but<br />
Campylobacter was found in 25% of the samples taken in <strong>2005</strong> (Table 11, pg 72). The<br />
pathogens tests done could not identify individual strains of Campylobacter. Therefore it is not<br />
known if the Campylobacter was from a human or avian source. However the Campylobacter<br />
that was found did not match any of the known human strains.<br />
14
E. coli Identity/Sources<br />
The antibiotic resistance testing and the genetic fingerprinting of E. coli isolates<br />
collected in <strong>2005</strong> from Murphy Park beach indicate that E. coli isolates are from multiple<br />
sources, human, avian, dog and other unidentified sources (Figure 41, pg 74). This indicates that<br />
the E. coli is not coming from one obvious source, but instead it is accumulating from many<br />
sources and being transported to the beach. This finding takes the emphasis off of the<br />
remediation of one source and places it on remediation of the delivery system that is transporting<br />
the accumulation of many sources to the beach. This delivery system at the beach consists<br />
mainly of storm water pipes and impervious surface runoff discharging on and near the beach.<br />
Summary<br />
Overall these results indicate that the emphasis should be on the remediation of the delivery<br />
system that is transporting the accumulation of many sources to the beach. The immediate<br />
potential sources of E. coli at Murphy beach are storm water from the runoff area, stream, and resuspension<br />
of potential near shore contaminated beach sediments by wave activity. Potential E.<br />
coli in the beach sediment are most likely from both storm water and fecal droppings in the<br />
beach sediments and on the parking lot. There is also a potential for individual onsite<br />
wastewater treatment systems that are in close proximity to the beach to fail and contribute E.<br />
coli to the beach.<br />
Recommendations for additional source identification work:<br />
Test additional E. coli concentrations during rain events and determining the identity of E. coli in<br />
the near shore beach sands and storm water pipes, and in Cladophora algae mats. Continue<br />
avian counts during the beach monitoring E. coli sample collection, and discontinue the avian<br />
waste survey. Additional sampling for pathogens, especially testing to determine the specific<br />
source of Campylobacter should be done.<br />
Beach management recommendations and requirements for the 2006:<br />
Recommended: considering measures to reduce storm water runoff to the beach.<br />
Required: post wet weather beach swimming advisory sign at the beach for 24 hours after all rain<br />
events of ¼ inches with 24 hours. The wet weather beach swimming advisory is required to<br />
protect public health immediately after rain events that are likely to result in closure E. coli<br />
levels, since the current method of determining E. coli levels in beach water takes a minimum of<br />
18 hours to process.<br />
Nicolet Bay Beach – Peninsula State Park<br />
Public Health Beach Monitoring Results<br />
In 2003 there were 86 samples for E. coli taken in the monitoring program at Nicolet beach, and<br />
1 (1.2%) of the E. coli tests exceeded the advisory level (235 E. coli /100ml of water) and 2<br />
(2.3%) exceeded the closure level (1,000 E. coli /100ml of water) (Table 1, pg 38 and Figure 2,<br />
pg 37). In 2004 there were 58 E. coli samples taken, and 4 (6.9%) of the E. coli tests exceeded<br />
the advisory level and 2 (3.4%) exceeded the closure level. In <strong>2005</strong> there were 56 E. coli<br />
samples taken, and 5 (9%) of the E. coli tests exceeded the advisory level and 1 (2%) test<br />
exceeded the closure level.<br />
Physical Features<br />
Surveys of the physical characteristics of Nicolet beach show that the beach has an impervious<br />
run off area that outlets storm water from the parking lot on to the beach during heavy rainfall.<br />
There bathroom facility at this beach consists of several flush and pit toilets. The wastewaters<br />
from these toilets and from the campsites that are within the entire bay of the beach are treated at<br />
Peninsula State Park’s wastewater treatment facility.<br />
15
Rain Event E. coli Sampling<br />
There was a significant correlation between rainfall 24 hours prior to high E. coli MPN/100mL<br />
and E. coli levels in a monitoring beach water sample. There were no significant correlations<br />
between rainfall 48-72 hours prior to high E. coli MPN/100mL and E. coli levels in a monitoring<br />
beach water sample. This may indicate that the rain events at Nicolet Bay beach have an impact<br />
on E. coli levels immediately after a rainfall and for up to 24 hours and rainfall that occurs 48-72<br />
hours prior to high E. coli levels may have no impact on the E. coli levels (Table 2, pg 50).<br />
Impact of Wind and Waves<br />
At Nicolet Bay beach in <strong>2005</strong> when the wind is out of the N, NE, and E (onshore) E. coli counts<br />
are elevated more than when out of the S, SW, and W (offshore) (Table 5, pg 59). There was a<br />
correlation between elevated E. coli counts and wave height in <strong>2005</strong> (Table 6, pg 60).<br />
E. coli Levels in Beach Sands<br />
The E. coli levels in the sand were never above the beach water advisory level of 235<br />
MPN/100mL (Figure 32, pg 63).<br />
Impact of Birds<br />
There was no correlation between bird counts or the amount of bird waste and E. coli in 2004 or<br />
<strong>2005</strong>, indicating that the number of birds present at the time of water sampling, and the amount<br />
of bird waste calculated in the survey may not have a significant effect on the E. coli<br />
concentrations at the beach (Table 7 and Table 8, pg 66).<br />
Pathogen Testing in Beach Water<br />
Shigella and Salmonella pathogens were not found at Nicolet Bay beach in <strong>2005</strong>, but<br />
Campylobacter was found in 25% of the samples taken in <strong>2005</strong> (Table 11, pg 72). The<br />
pathogens tests done could not identify individual strains of Campylobacter. However the<br />
Campylobacter that was found did not match any of the known human strains.<br />
E. coli Identity/Sources<br />
The antibiotic resistance testing and the genetic fingerprinting of E. coli isolates<br />
collected in <strong>2005</strong> from Nicolet Bay beach indicate that E. coli isolates are from multiple sources,<br />
human, avian, dog and other unidentified sources (Figure 41, pg 74). This indicates that the E.<br />
coli is not coming from one obvious source, but instead it is accumulating from many sources<br />
and being transported to the beach. This finding takes the emphasis off of the remediation of one<br />
source and places it on remediation of the delivery system that is transporting the accumulation<br />
of many sources to the beach. This delivery system at this beach consists mainly of impervious<br />
surface runoff discharging on and near the beach.<br />
Summary<br />
Overall these results indicate that the emphasis should be on the remediation of the delivery<br />
system that is transporting the accumulation of many sources to the beach. The delivery system<br />
consists of beach sediment sheet flow. The immediate potential sources of E. coli at Nicolet<br />
beach are storm water from the runoff area and re-suspension of potentially contaminated near<br />
shore beach sediments by wave activity.<br />
Recommendations for additional source identification work:<br />
Test additional E. coli concentrations during rain events and determining the identity of E. coli in<br />
the near shore beach sands and storm water pipes, and in Cladophora algae mats. Continue avian<br />
counts during the beach monitoring E. coli sample collection, and discontinue the avian waste<br />
16
survey. Additional sampling for pathogens, especially testing to determine the specific source of<br />
Campylobacter should be done.<br />
Beach management recommendations and requirements for the 2006:<br />
Recommended: considering measures to reduce storm water runoff to the beach.<br />
Required: none at this time.<br />
Haines Park Beach<br />
Public Health Beach Monitoring Results<br />
In 2003 there were 18 samples for E. coli taken in the monitoring program at Haines beach, and<br />
none of the E. coli tests exceeded the advisory level (235 E. coli /100ml of water) or closure<br />
level (1,000 E. coli /100ml of water) (Table 1, pg 38 and Figure 2, pg 41). In 2004 16 E. coli<br />
samples were taken, and 2 (12.5%) of the tests exceeded the advisory and none exceeded the<br />
closure level. In <strong>2005</strong> there were 14 E. coli samples taken, and none exceeded the advisory or<br />
the closure level.<br />
Physical Features<br />
Surveys of the physical characteristics of Haines beach show that the beach has a stream that<br />
outlets water onto the beach. The bathroom facility at this beach consists of a portable outhouse.<br />
The wastewaters from the residents that are within the entire bay of the beach are treated by<br />
onsite private wastewater treatment systems.<br />
Impact of Wind and Waves<br />
In <strong>2005</strong> there was no correlation found between elevated E. coli counts and wind. There was no<br />
correlation between elevated E. coli counts and wave height in <strong>2005</strong>.<br />
Impact of Birds<br />
Bird counts were not correlated with E. coli. The Avian Waste survey was not conducted at<br />
Haines Beach.<br />
Summary<br />
The immediate potential sources of E. coli at Haines beach are the stream outlet and resuspension<br />
caused by wave activity of potentially contaminated near shore beach sediments.<br />
Potential E. coli in the beach sediment are most likely from fecal droppings in the beach<br />
sediments. E. coli concentrations of beach sediments need to be tested. There is also a potential<br />
for individual onsite wastewater treatment systems that are in close proximity to the beach to fail<br />
and contribute E. coli to the beach.<br />
Recommendations for additional source identification work:<br />
Test the identity of E. coli in the near shore beach sands and in Cladophora algae mats if mean<br />
E. coli level increases, or if beach swimming advisory and closures increase. Continue avian<br />
counts during the beach monitoring E. coli sample collection, and discontinue the avian waste<br />
survey.<br />
Beach management recommendations and requirements for the 2006:<br />
Currently there are no beach management recommendations or requirements.<br />
<strong>Door</strong> <strong>County</strong> Beaches on Lake Michigan<br />
There are 10 monitored beaches located on the Lake Michigan side of the peninsula (Sturgeon<br />
Bay Recreational Canal Park, Portage Park, Whitefish Bay, Whitefish Dunes State Park,<br />
Lakeside Park, Anclam Park, Baileys Harbor Ridges Park, Sandy Bay Park, Newport State Park,<br />
and Europe Bay Park) (<strong>Map</strong> 1, page 2). These beaches have significantly higher mean E. coli<br />
17
concentrations than the beaches located on Washington/Rock Islands, and inland lakes in <strong>Door</strong><br />
<strong>County</strong> (Figure 4, page 54). Beaches on Lake Michigan have a significantly lower mean E. coli<br />
than beaches on Green Bay and in the Sturgeon Bay Canal. Three of the ten beaches on Lake<br />
Michigan have storm water pipes/streams that outlet on or near the beaches.<br />
Whitefish Dunes State Park Beach<br />
Public Health Beach Monitoring Results<br />
In 2003 there were 87 samples for E. coli taken in the monitoring program at Whitefish Dunes<br />
beach, and 8% (7 tests) of the E. coli tests exceeded the advisory level (235 E. coli /100ml of<br />
water) and 2.3% (2 tests) exceeded the closure level (1,000 E. coli /100ml of water) (Table 1, pg<br />
38 and Figure 2, pg 41). In 2004 there were 56 E. coli samples taken, and 1 (1.8%) of the tests<br />
exceeded the advisory and closure levels. In <strong>2005</strong> 60 E. coli samples were taken, and 5 (8%) of<br />
the tests exceeded the advisory and 3 (5%) tests exceeded the closure levels.<br />
Physical Features<br />
Surveys of the physical characteristics of Whitefish Dunes State Park beach show that the beach<br />
has no storm water pipe outlets or streams that deliver water directly unto the beach property. A<br />
stream outlets water from Clark Lake in the southwestern end of the bay in which the beach in<br />
located. There is a small potential for water to runoff from the parking lot onto the beach water<br />
during very heavy rainfalls. The bathroom facilities at this beach consist of concrete pit and<br />
flush toilets. The wastewaters from these bathrooms and from the residents that are within the<br />
entire bay of the beach are treated by individual onsite private wastewater treatment systems.<br />
Rain Event E. coli Sampling<br />
E. coli concentrations were tested during 1 rain event in 2004 and 2 rain events in <strong>2005</strong> at<br />
Whitefish Dunes beach (Figure 22, pg 56). E. coli concentrations were tested at 1, 2, 3, 4, 8, 12,<br />
and 24 hours after 0.5 inches of rain within 24 hours. The E. coli levels exceeded the advisory in<br />
2 of the 3 sampled rain events within 24 hours. Overall the rain event results indicate that E. coli<br />
levels increase during rain events and exceed the advisory level during some rain events.<br />
Impact of Wind and Waves<br />
In <strong>2005</strong> there was no correlation found between elevated E. coli counts and wind. There was no<br />
correlation between elevated E. coli counts and wave height in <strong>2005</strong>.<br />
E. coli Levels in Beach Sands<br />
Overall the E. coli levels in the sand were fairly low (Figure 28, pg 62). There were occasions<br />
when the E. coli levels in the sand were above the beach water advisory level of 235<br />
MPN/100mL. The swash zone samples were typically higher in E. coli than the sand samples<br />
taken up shore of in sand located 6-12” underwater.<br />
Impact of Birds<br />
There was no correlation between bird counts or the amount of bird waste and E. coli in 2004 or<br />
<strong>2005</strong>, indicating that the number of birds present at the time of water sampling, and the amount<br />
of bird waste calculated in the survey may not have a significant effect on the E. coli<br />
concentrations at the beach (Table 7 and Table 8, pg 66).<br />
Pathogen Testing in Beach Water<br />
No pathogens (Shigella, Salmonella, and Campylobacter) were found in the Whitefish Dunes<br />
beach water in 2004. No additional water samples need to be taken at Whitefish Dunes beach for<br />
pathogens unless a problem arises that indicates a need.<br />
18
E. coli Identity/Sources<br />
The antibiotic resistance testing and the genetic fingerprinting of E. coli isolates collected in<br />
2004 from Whitefish Dunes beach both indicate that a very large amount of the E. coli isolates<br />
were from avian sources, and a very small amount were from human, dog and deer sources<br />
(Figure 41, pg 74). The antibiotic resistance testing and the genetic fingerprinting of E. coli<br />
isolates collected in <strong>2005</strong> from Whitefish Dunes beach indicate that E. coli isolates are from<br />
multiple sources, human, avian, dog and other unidentified sources. This indicates that the E.<br />
coli is not coming from one obvious source, but instead it is accumulating from many sources<br />
and being transported to the beach. This finding takes the emphasis off of the remediation of one<br />
source and places it on remediation of the delivery system that is transporting the accumulation<br />
of many sources to the beach.<br />
Summary<br />
Overall these results indicate that the emphasis should be on the remediation of the delivery<br />
system that is transporting the accumulation of many sources to the beach. The delivery system<br />
for Whitefish Dunes State Park is the stream and sheet flow from beach. The immediate<br />
potential sources of E. coli at Whitefish Dunes beach are re-suspension of potentially<br />
contaminated near shore beach sediments caused by wave activity and storm water from parking<br />
lot runoff.<br />
Recommendations for additional source identification work:<br />
Test the identity of E. coli in the near shore beach sands and in Cladophora algae mats if mean<br />
E. coli level increases, or if beach swimming advisory and closures increase. Continue avian<br />
counts during the beach monitoring E. coli sample collection, and discontinue the avian waste<br />
survey.<br />
Beach management recommendations and requirements for the 2006:<br />
Currently there are no beach management recommendations or requirements.<br />
Baileys Harbor Ridges Beach<br />
Public Health Beach Monitoring Results<br />
In 2003 there were 88 samples for E. coli taken in the monitoring program at Baileys Harbor<br />
beach, and 4 (4.5%) of the E. coli tests exceeded the advisory level (235 E. coli /100ml of<br />
water) and 1 (1.1%) exceeded the closure level (1,000 E. coli /100ml of water) (Table 1, pg 38<br />
and Figure 2, pg 41). In 2004 56 E. coli samples were taken, and 5 (8.9%) of the tests exceeded<br />
the advisory and 1 (1.8%) test exceeded the closure level. In <strong>2005</strong> 57 E. coli samples were<br />
taken, and 1 (2%) of the tests exceeded the advisory and no tests exceeded the closure level.<br />
Physical Features<br />
Surveys of the physical characteristics of Baileys Harbor beach show that the beach has several<br />
storm water pipes that outlet water in the western corner and southern side of the bay. There are<br />
two streams that outlet in the west and east corner of the bay. Storm water runs off from the<br />
parking lot onto the beach during heavy rainfall. The bathroom facility at this beach consists of<br />
two toilets. The wastewaters from these toilets and from the residents that are within the entire<br />
bay of the beach are treated by a municipal wastewater treatment facility.<br />
Rain Event E. coli Sampling E. coli concentrations were tested during 4 rain events in <strong>2005</strong> at<br />
Baileys Harbor Ridges beach (Figure 13, pg 51). E. coli concentrations were tested at 1, 2, 3, 4,<br />
8, 12, and 24 hours after 0.5 inches of rain within 24 hours. The E. coli levels exceeded the<br />
closure level (1,000 MPN/100mL of water) in 2 of the 4 sampled rain events within 24 hours.<br />
19
Overall the rain event results indicate that E. coli levels increase during rain events and exceed<br />
the closure level during some rain events.<br />
Impact of Wind and Waves<br />
In <strong>2005</strong> there was no correlation found between elevated E. coli counts and wind. There was a<br />
correlation between elevated E. coli counts and wave height in <strong>2005</strong> (Table 6, pg 60).<br />
E. coli Levels in Beach Sands<br />
Overall the E. coli levels in the sand were fairly low (Figure 24, pg 61). There were occasions<br />
when the E. coli levels in the sand were above the beach water advisory level of 235<br />
MPN/100mL. The swash zone samples were typically higher in E. coli than the sand samples<br />
taken up shore of in sand located 6-12” underwater.<br />
Impact of Birds<br />
There was no correlation between bird counts or the amount of bird waste and E. coli in 2004 or<br />
<strong>2005</strong>, indicating that the number of birds present at the time of water sampling, and the amount<br />
of bird waste calculated in the survey may not have a significant effect on the E. coli<br />
concentrations at the beach (Table 7 and Table 8, pg 66).<br />
Pathogen Testing in Beach Water<br />
No pathogens (Shigella, Salmonella, and Campylobacter) were found in the Baileys Harbor<br />
Ridges beach water in <strong>2005</strong>. No additional water samples need to be taken at Baileys Harbor<br />
Ridges beach for pathogens unless a problem arises that indicates a need.<br />
E. coli Identity/Sources<br />
The antibiotic resistance testing and the genetic fingerprinting of E. coli isolates collected in<br />
<strong>2005</strong> from Baileys Harbor Ridges beach indicate that E. coli isolates are from multiple sources,<br />
human, avian, dog and other unidentified sources (Figure 41, pg 74). This indicates that the E.<br />
coli is not coming from one obvious source, but instead it is accumulating from many sources<br />
and being transported to the beach. This finding takes the emphasis off of the remediation of one<br />
source and places it on remediation of the delivery system that is transporting the accumulation<br />
of many sources to the beach. This delivery system at this beach consists mainly of stream,<br />
storm water pipe and impervious surface runoff discharging on and near the beach. Additional<br />
E. coli concentrations and isolates need to be taken from the storm water pipe.<br />
Summary<br />
Overall these results indicate that the emphasis should be on the remediation of the delivery<br />
system that is transporting the accumulation of many sources to the beach. The immediate<br />
potential sources of E. coli at Baileys Harbor beach are storm water from nearby storm water<br />
pipes, stream outlets, and parking lot runoff; and re-suspension of potentially contaminated near<br />
shore beach sediments caused by wave activity. E. coli concentrations of beach sediments need<br />
to be measured. Potential E. coli in the beach sediment is most likely from fecal droppings in the<br />
beach sediments and on the parking lot.<br />
Recommendations for additional source identification work:<br />
Test additional E. coli concentrations during rain events and determining the identity of E. coli in<br />
the near shore beach sands and storm water pipes, and in Cladophora algae mats. Continue<br />
avian counts during the beach monitoring E. coli sample collection, and discontinue the avian<br />
waste survey.<br />
Beach management recommendations and requirements for the 2006:<br />
20
Recommended: considering measures to reduce storm water runoff to the beach.<br />
There are no beach management requirements at this time.<br />
Portage Park Beach<br />
Public Health Beach Monitoring Results<br />
In 2003 there were 24 samples for E. coli taken in the monitoring program at Portage beach, and<br />
1 (4.2%) of the E. coli tests exceeded the advisory level (235 E. coli /100ml of water) and none<br />
exceeded the closure level (1,000 E. coli /100ml of water) (Table 1, pg 38 and Figure 2, pg 41).<br />
In 2004 29 E. coli samples were taken, and 1 (3.4%) of the tests exceeded the advisory and 1<br />
(3.4%) test exceeded the closure level. In <strong>2005</strong> 34 E. coli samples were taken, and 6 (18%) of<br />
the tests exceeded the advisory and 2 (6%) test exceeded the closure level.<br />
Physical Features<br />
Surveys of the physical characteristics of Portage beach show that the beach has no storm water<br />
pipes that outlet water onto the beach or the surrounding bay. The Sturgeon Bay canal outlets<br />
water near the southern end of the beach. There are no bathroom facilities at this beach. The<br />
wastewaters from the residents that are within the entire bay of the beach are treated by onsite<br />
private wastewater treatment systems.<br />
Impact of Wind and Waves<br />
Elevated E. coli counts at Portage Park beach are related to wind out of the N and S (long shore)<br />
more than out of the SW, W, NW, NE, E, and S (offshore and onshore) (Table 5, pg 59). There<br />
was a correlation between elevated E. coli counts and wave height in <strong>2005</strong> (Table 6, pg 60).<br />
Impact of Birds<br />
There was no correlation between bird counts or the amount of bird waste and E. coli in 2004 or<br />
<strong>2005</strong>, indicating that the number of birds present at the time of water sampling, and the amount<br />
of bird waste calculated in the survey may not have a significant effect on the E. coli<br />
concentrations at the beach (Table 7 and Table 8, pg 66).<br />
Summary<br />
Overall these results indicate that the emphasis should be on the remediation of the delivery<br />
system that is transporting the accumulation of many sources to the beach. The immediate<br />
potential sources of E. coli at Portage beach are from the re-suspension of potentially<br />
contaminated near shore beach sediments caused by wave activity, and the canal water that<br />
outlets near the beach and that may have high E. coli concentrations. Potential E. coli in the<br />
beach sediment is most likely from fecal droppings in the beach sediments. There is also a<br />
potential for individual onsite wastewater treatment systems that are in close proximity to the<br />
beach to fail and contribute E. coli to the beach.<br />
Recommendations for additional source identification work:<br />
Test additional E. coli concentrations during rain events and determining the identity of E. coli in<br />
the near shore beach sands and storm water pipes, and in Cladophora algae mats. Continue<br />
avian counts during the beach monitoring E. coli sample collection, and discontinue the avian<br />
waste survey. Additional sampling for pathogens, especially testing to determine the specific<br />
source of Campylobacter should be done.<br />
Beach management recommendations and requirements for the 2006:<br />
Currently there are no beach management recommendations or requirements.<br />
21
Newport State Park Beach<br />
Public Health Beach Monitoring Results<br />
In 2003 there were 86 samples for E. coli taken in the monitoring program at Newport beach,<br />
and 2 (2.3%)of the E. coli tests exceeded the advisory level (235 E. coli /100ml of water) and<br />
none exceeded the closure level (1,000 E. coli /100ml of water) (Table 1, pg 38 and Figure 2, pg<br />
41). In 2004 there were 56 E. coli samples taken, and 1(1.8%) of the E. coli tests exceeded the<br />
advisory level and none exceeded the closure level. In <strong>2005</strong> there were 56 E. coli samples taken,<br />
and none of the E. coli tests exceeded the advisory or closure level.<br />
Physical Features<br />
Surveys of the physical characteristics of Newport Beach show that the beach has no storm water<br />
pipes or streams that discharge to the beach or surrounding bay. There bathroom facility at this<br />
beach consists of several concrete pit toilets. The wastewaters from these toilets and from the<br />
residents that are within the entire bay of the beach are treated by individual onsite private<br />
wastewater treatment systems.<br />
Impact of Wind and Waves<br />
In <strong>2005</strong> there was no correlation found between elevated E. coli counts and wind. There was a<br />
correlation between elevated E. coli counts and wave height in <strong>2005</strong> (Table 6, pg 60).<br />
Impact of Birds<br />
There was no correlation between bird counts or the amount of bird waste and E. coli in 2004 or<br />
<strong>2005</strong>, indicating that the number of birds present at the time of water sampling, and the amount<br />
of bird waste calculated in the survey may not have a significant effect on the E. coli<br />
concentrations at the beach (Table 7 and Table 8, pg 66).<br />
Summary<br />
Overall these results indicate that the emphasis should be on the remediation of the delivery<br />
system that is transporting the accumulation of many sources to the beach. However the lack of<br />
both storm water pipes and large storm water runoff areas indicate the only delivery system is<br />
runoff from near shore sediments. The immediate potential sources of E. coli at Newport Beach<br />
are from the re-suspension of potential near shore contaminated beach sediments by wave<br />
activity. Potential E. coli in the beach sediment are most likely from fecal droppings in the<br />
beach sediments and on the parking lot. There is also a potential for individual onsite<br />
wastewater treatment systems to fail, but there are no systems in close proximity to the beach.<br />
Recommendations for additional source identification work:<br />
Test the identity of E. coli in the near shore beach sands and in Cladophora algae mats if mean<br />
E. coli level increases, or if beach swimming advisory and closures increase. Continue avian<br />
counts during the beach monitoring E. coli sample collection, and discontinue the avian waste<br />
survey.<br />
Beach management recommendations and requirements for the 2006:<br />
Recommended: considering measures to reduce storm water runoff to the beach.<br />
There are no beach management requirements at this time.<br />
Lakeside Beach<br />
Public Health Beach Monitoring Results<br />
In 2003 there were 42 samples for E. coli taken in the monitoring program at Lakeside beach,<br />
and 2 (4.8%) of the E. coli tests exceeded the advisory level (235 E. coli /100ml of water) and 1<br />
(2.4%) exceeded the closure level (1,000 E. coli /100ml of water) (Table 1, pg 38 and Figure 2,<br />
22
pg 41). In 2004 there were 32 E. coli samples taken, and 4 (12.5%) of the E. coli tests exceeded<br />
the advisory level and none exceeded the closure level. In <strong>2005</strong> there were 29 E. coli samples<br />
taken, and 2 (5%) of the E. coli tests exceeded the advisory level and 1 (2%) exceeded the<br />
closure level.<br />
Physical Features<br />
Surveys of the physical characteristics of Lakeside beach show that the beach has a storm water<br />
pipe and an impervious run off area that outlets storm water on the beach. There bathroom<br />
facility at this beach consists of several concrete pit toilets. The wastewaters from these toilets<br />
and from the residents that are within the entire bay of the beach are treated by individual onsite<br />
private wastewater treatment systems.<br />
Rain Event E. coli Sampling<br />
E. coli concentrations were tested during two rain events on 5/21/04 and 8/9/04. E. coli<br />
concentrations for all of the samples exceeded the advisory level on 5/21/04 (1, 2, 3, 4, 8, 12, and<br />
24 hours after 0.5 inches of rain within 24 hours) (Figure 17, pg 53). On 8/9/04 the E. coli levels<br />
did not exceed the advisory level at any of the sampling times. Additional beach water samples<br />
need to be taken to determine E. coli concentrations during various rain events and beach<br />
sediments need to be tested for E. coli.<br />
Impact of Wind and Waves<br />
In <strong>2005</strong> there was no correlation found between elevated E. coli counts and wind. There was no<br />
correlation between elevated E. coli counts and wave height in <strong>2005</strong>.<br />
E. coli Levels in Beach Sands<br />
Overall the E. coli levels in the sand were fairly low (Figure 30, pg 63). There were occasions<br />
when the E. coli levels in the sand were above the beach water advisory level of 235<br />
MPN/100mL. The swash zone samples were typically higher in E. coli than the sand samples<br />
taken up shore of in sand located 6-12” underwater.<br />
Impact of Birds<br />
There was no correlation between bird counts or the amount of bird waste and E. coli in 2004 or<br />
<strong>2005</strong>, indicating that the number of birds present at the time of water sampling, and the amount<br />
of bird waste calculated in the survey may not have a significant effect on the E. coli<br />
concentrations at the beach (Table 7 and Table 8, pg 66).<br />
Summary<br />
Overall these results indicate that the emphasis should be on the remediation of the delivery<br />
system that is transporting the accumulation of many sources to the beach. The primary delivery<br />
system is a storm water pipe. The immediate potential sources of E. coli at Lakeside beach are<br />
storm water from the storm water pipe, runoff area and re-suspension of potentially contaminated<br />
near shore beach sediments caused by wave activity. Potential E. coli in the beach sediment are<br />
most likely from both storm water and fecal droppings in the beach sediments and on the parking<br />
lot. There is also a potential for individual onsite private wastewater treatment systems in close<br />
proximity to the beach to be failing and contributing E. coli to beach sediment and water.<br />
Recommendations for additional source identification work:<br />
Test additional E. coli concentrations during rain events and determining the identity of E. coli in<br />
the near shore beach sands and storm water pipes, and in Cladophora algae mats. Continue<br />
avian counts during the beach monitoring E. coli sample collection, and discontinue the avian<br />
23
waste survey. Additional sampling for pathogens, especially testing to determine the specific<br />
source of Campylobacter should be done.<br />
Beach management recommendations and requirements for the 2006:<br />
Recommended: considering measures to reduce storm water runoff to the beach.<br />
Required: post wet weather beach swimming advisory sign at the beach for 24 hours after all rain<br />
events of ¼ inches with 24 hours. The wet weather beach swimming advisory is required to<br />
protect public health immediately after rain events that are likely to result in closure E. coli<br />
levels, since the current method of determining E. coli levels in beach water takes a minimum of<br />
18 hours to process.<br />
Europe Bay Park Beach<br />
Public Health Beach Monitoring Results<br />
There are three sample locations at Europe Bay beach. In 2003 there were 39 samples for E. coli<br />
taken in the monitoring program at 2 of the 3 sampling sites at Europe Bay beach and 40 samples<br />
taken at the third sampling site. In 2003 there was 1 (2.6%) of the E. coli tests exceeded the<br />
advisory level (235 E. coli /100ml of water) and the closure level (1,000 E. coli /100ml of<br />
water) total between the three sampling sites (Table 1, pg 38 and Figure 2, pg 41). In 2004 there<br />
were 28 samples for E. coli taken in the monitoring program at all 3 sampling sites at Europe<br />
Bay beach, and 1 (3.6%) of the E. coli tests exceeded the advisory level and none exceeded the<br />
closure at each of the three sampling sites. In <strong>2005</strong> there were 28 samples for E. coli taken in<br />
the monitoring program at all 3 sampling sites at Europe Bay beach, and none of the E. coli tests<br />
exceeded the advisory or the closure level at each of the three sampling sites.<br />
Physical Features<br />
Surveys of the physical characteristics of Europe Bay beach show that the beach has an<br />
impervious run off area that outlets small amount of storm water from the road and parking lot<br />
on to the beach during heavy rainfall. The bathroom facility at this beach consists of several<br />
concrete pits. The wastewater the residents that are within the entire bay of the beach are treated<br />
by onsite wastewater treatment systems.<br />
Impact of Wind and Waves<br />
At Europe 1 elevated E. coli counts are related to wind out of the NE, E, and SE (onshore), more<br />
than when out of the SW, W, and N (long shore and off shore) (Table 5, pg 59). There was no<br />
correlation between elevated E. coli counts and wave height in <strong>2005</strong>.<br />
Impact of Birds<br />
There was no correlation between bird counts or the amount of bird waste and E. coli in 2004 or<br />
<strong>2005</strong>, indicating that the number of birds present at the time of water sampling, and the amount<br />
of bird waste calculated in the survey may not have a significant effect on the E. coli<br />
concentrations at the beach (Table 7 and Table 8, pg 66).<br />
Summary<br />
Overall these results indicate that the emphasis should be on the remediation of the delivery<br />
system that is transporting the accumulation of many sources to the beach. The immediate<br />
potential sources of E. coli at Europe Bay beach are storm water from the parking lot/road<br />
during heavy rainfall and by the re-suspension of potentially contaminated near shore beach<br />
sediments caused by wave activity. Potential E. coli in the beach sediment are most likely from<br />
both storm water runoff and fecal droppings in the beach sediments and on the parking lot.<br />
There is also a potential for individual onsite private wastewater treatment systems in close<br />
proximity to the beach to be failing and contributing E. coli to beach sediment and water.<br />
24
Recommendations for additional source identification work:<br />
Test the identity of E. coli in the near shore beach sands and in Cladophora algae mats if mean<br />
E. coli level increases, or if beach swimming advisory and closures increase. Continue avian<br />
counts during the beach monitoring E. coli sample collection, and discontinue the avian waste<br />
survey.<br />
Beach management recommendations and requirements for the 2006:<br />
Recommended: considering measures to reduce storm water runoff to the beach.<br />
There are no beach management requirements at this time.<br />
Sturgeon Bay Recreational Area Canal Beach<br />
Public Health Beach Monitoring Results<br />
In 2003 there were 42 samples for E. coli taken in the monitoring program at Sturgeon Bay<br />
Canal beach, and 1 (2.4%) of the E. coli tests exceeded the advisory level (235 E. coli /100ml of<br />
water) and none exceeded the closure level (1,000 E. coli /100ml of water) (Table 1, pg 38 and<br />
Figure 2, pg 41). In 2004 there were 28 E. coli samples taken, and none of the tests exceeded the<br />
advisory or closure level. In <strong>2005</strong> there were 32 E. coli samples taken, and 4 (13%) of the E. coli<br />
tests exceeded the advisory level and 2 (6%) exceeded the closure level.<br />
Physical Features<br />
Surveys of the physical characteristics of Sturgeon Bay Canal beach show that the beach has no<br />
storm water pipes that outlet water onto the beach or the surrounding bay. The Sturgeon Bay<br />
canal outlets water near the northern end of the beach. There are no bathroom facilities at this<br />
beach. The wastewaters from the residents that are within the entire bay of the beach are treated<br />
by onsite private wastewater treatment systems.<br />
Impact of Wind and Waves<br />
Elevated E. coli counts are related to wind out of the NE and SW (long shore), at Sturgeon Bay<br />
Rec. Canal more than when out of the E, SE, and S (onshore) (Table 5, pg 59). There was no<br />
correlation between elevated E. coli counts and wave height in <strong>2005</strong>.<br />
Impact of Birds<br />
There was no correlation between bird counts or the amount of bird waste and E. coli in 2004 or<br />
<strong>2005</strong>, indicating that the number of birds present at the time of water sampling, and the amount<br />
of bird waste calculated in the survey may not have a significant effect on the E. coli<br />
concentrations at the beach (Table 7 and Table 8, pg 66).<br />
Summary<br />
The immediate potential sources of E. coli at Sturgeon Bay Canal beach are from the resuspension<br />
of potentially contaminated near shore beach sediments caused by wave activity, and<br />
the canal water that outlets near the beach and that may have high E. coli concentrations. E. coli<br />
concentrations of beach sediments need to be measured. Potential E. coli in the beach sediment is<br />
most likely from fecal droppings in the beach sediments.<br />
Recommendations for additional source identification work:<br />
Test the identity of E. coli in the near shore beach sands and in Cladophora algae mats if mean<br />
E. coli level increases, or if beach swimming advisory and closures increase. Continue avian<br />
25
counts during the beach monitoring E. coli sample collection, and discontinue the avian waste<br />
survey.<br />
Beach management recommendations and requirements for the 2006:<br />
There are no beach management recommendations or requirements at this time.<br />
Sandy Bay Beach<br />
Public Health Beach Monitoring Results<br />
In 2003 there were 39 samples for E. coli taken in the monitoring program at Sandy Bay beach,<br />
and none of the E. coli tests exceeded the advisory level (235 E. coli /100ml of water) or<br />
closure level (1,000 E. coli /100ml of water) (Table 1, pg 38 and Figure 2, pg 41). In 2004 there<br />
were 25 E. coli samples taken, and none of the E. coli tests exceeded the advisory level or<br />
closure level. In <strong>2005</strong> there were 28 E. coli samples taken, and none of the E. coli tests exceeded<br />
the advisory or closure level.<br />
Physical Features<br />
Surveys of the physical characteristics of Sandy Bay beach show that the beach has a stream and<br />
a large groundwater spring that both outlet water onto the beach. The bathroom facilities at this<br />
beach consist of concrete pit toilets. The wastewaters from the residents that are within the<br />
entire bay of the beach are treated by onsite private wastewater treatment systems.<br />
Impact of Wind and Waves<br />
In <strong>2005</strong> there was no correlation found between elevated E. coli counts and wind. There was no<br />
correlation between elevated E. coli counts and wave height in <strong>2005</strong>.<br />
Impact of Birds<br />
There was no correlation between bird counts or the amount of bird waste and E. coli in 2004 or<br />
<strong>2005</strong>, indicating that the number of birds present at the time of water sampling, and the amount<br />
of bird waste calculated in the survey may not have a significant effect on the E. coli<br />
concentrations at the beach (Table 7 and Table 8, pg 66).<br />
Summary<br />
The immediate potential sources of E. coli at Sandy Bay beach are the stream and spring outlets<br />
and re-suspension caused by wave activity of near shore contaminated beach sediments.<br />
Potential E. coli in the beach sediment is most likely from fecal droppings in the beach<br />
sediments.<br />
Recommendations for additional source identification work:<br />
Test the identity of E. coli in the near shore beach sands and in Cladophora algae mats if mean<br />
E. coli level increases, or if beach swimming advisory and closures increase. Continue avian<br />
counts during the beach monitoring E. coli sample collection, and discontinue the avian waste<br />
survey.<br />
Beach management recommendations and requirements for the 2006:<br />
There are no beach management recommendations or requirements at this time.<br />
26
Anclam Park Beach<br />
Public Health Beach Monitoring Results<br />
In 2003 there were 36 samples for E. coli taken in the monitoring program at Anclam beach, and<br />
1 (2.8%) of the E. coli tests exceeded the advisory level (235 E. coli /100ml of water) and none<br />
exceeded the closure level (1,000 E. coli /100ml of water) (Table 1, pg 38 and Figure 2, pg 41).<br />
In 2004 28 E. coli samples were taken, and 1 (3.5%) of the tests exceeded the advisory and none<br />
exceeded the closure level. In <strong>2005</strong> 29 E. coli samples were taken, and 1 (4%) of the tests<br />
exceeded the advisory and none exceeded the closure level.<br />
Physical Features<br />
Surveys of the physical characteristics at Anclam beach show that the beach has a storm water<br />
pipe that discharges water onto the beach and several storm water pipes north of the beach.<br />
Storm water runs off from the parking lot onto the beach. There bathroom facility at this beach<br />
consists of flush toilets. The wastewaters from these toilets and from the residents that are<br />
within the entire bay of the beach are treated by a municipal wastewater treatment facility.<br />
Rain Event E. coli Sampling<br />
E. coli concentrations were tested during four rain events on 6/7/05, 7/25/05, 8/8/05, and<br />
8/10/05. E. coli concentrations for all of the samples exceeded the advisory and closure levels at<br />
different time increments within the 24 hour testing period (Figure 12, pg 51).<br />
Impact of Wind and Waves<br />
In <strong>2005</strong> there was no correlation found between elevated E. coli counts and wind. There was no<br />
correlation between elevated E. coli counts and wave height in <strong>2005</strong>.<br />
E. coli Levels in Beach Sands<br />
The E. coli levels in the sand were never above the beach water advisory level of 235<br />
MPN/100mL (Figure 29, pg 62).<br />
Impact of Birds<br />
There was no correlation between bird counts or the amount of bird waste and E. coli in 2004 or<br />
<strong>2005</strong>, indicating that the number of birds present at the time of water sampling, and the amount<br />
of bird waste calculated in the survey may not have a significant effect on the E. coli<br />
concentrations at the beach (Table 7 and Table 8, pg 66).<br />
Summary<br />
The immediate potential sources of E. coli at Anclam beach are storm water from nearby storm<br />
water pipes and stream outlets, shoreline and parking lot runoff, and re-suspension of potentially<br />
contaminated near shore beach sediments caused by wave activity. Potential E. coli in the beach<br />
sediment is most likely from fecal droppings in the beach sediments and on the parking lot.<br />
Recommendations for additional source identification work:<br />
Test additional E. coli concentrations during rain events and determining the identity of E. coli in<br />
the near shore beach sands and storm water pipes, and in Cladophora algae mats. Continue<br />
avian counts during the beach monitoring E. coli sample collection, and discontinue the avian<br />
waste survey. Additional sampling for pathogens, especially testing to determine the specific<br />
source of Campylobacter should be done.<br />
Beach management recommendations and requirements for the 2006:<br />
Recommended: considering measures to reduce storm water runoff to the beach.<br />
27
Required: post wet weather beach swimming advisory sign at the beach for 24 hours after all rain<br />
events of ¼ inches with 24 hours. The wet weather beach swimming advisory is required to<br />
protect public health immediately after rain events that are likely to result in closure E. coli<br />
levels, since the current method of determining E. coli levels in beach water takes a minimum of<br />
18 hours to process.<br />
Other Water Quality Concerns:<br />
Several observations were made of algal blooms late in the summer of 2004 at Anclam beach. In<br />
September one sample was taken of the material in the algal bloom and Microcystis was found in<br />
the sample. The presence of Microcystis indicates a cyanobacterial bloom. Skin rashes are one<br />
general symptom of swimming in cyanobacterial blooms. Microcystis is a blue green algae<br />
species that produces the Microcystin toxin. High levels of the Microcystin toxin have been<br />
known to cause nausea, vomiting, and liver problems in humans. The levels of Microcystis or<br />
presence of Microcystin were not determined at Anclam beach. Generally it is recommended<br />
that people avoid swimming in algal blooms. It is recommended that additional water samples<br />
be taken during algal blooms to determine the presence and quantity of Cyanobacteria and<br />
Cyanobacterial toxins and the potential threat of these bacteria and toxins to public health.<br />
Whitefish Bay<br />
Beach monitoring samples for E. coli MPN/100mL of water were taken at Whitefish Bay once<br />
per week for 14 weeks. There were no samples above the advisory of closure level in <strong>2005</strong><br />
(Table 1, pg 38 and Figure 2, pg 41). Overall the tests and data analysis done thus far for the<br />
beach contamination source identification project at Whitefish Bay beach do not determine what<br />
the source(s) of E. coli contamination are. Continued beach monitoring is recommended for this<br />
site. Currently there are no beach management recommendations.<br />
<strong>Door</strong> <strong>County</strong> Beaches on Washington and Rock Island<br />
There are five beaches monitored on Washington Island (Sand Dunes Park, School House<br />
Beach, Gialison Park, Jackson Harbor, Percy Johnson Park), and Rock Island (Rock Island State<br />
Park) (<strong>Map</strong> 1, pg 2). The beaches located on Washington/Rock islands are impacted by weather,<br />
wave, and wind conditions from both the Green Bay and Lake Michigan water bodies. These<br />
beaches have significantly lower mean E. coli concentrations than the beaches located on the<br />
Sturgeon Bay Canal, Green Bay and Lake Michigan (Figure 12, pg 51). The mean E. coli levels<br />
on the island beaches grouped with the mean E. coli levels from the inland lakes, both types of<br />
beaches had the lowest E. coli concentration means in <strong>Door</strong> <strong>County</strong>. None of the island beaches<br />
have a storm water delivery system (storm water pipes or streams) that brings storm water<br />
directly to the beach. Several of the beaches have runoff areas that contribute storm water from<br />
the beach parking lot. The potential sources of E. coli at all of the island beaches include the resuspension<br />
of beach sediments that potentially contain E. coli contamination from fecal<br />
droppings on the beach sediments, and or the potential of individual failing onsite private septic<br />
treatment systems that are in close proximity to the beaches that could contribute E. coli .<br />
Sand Dunes Beach<br />
Public Health Beach Monitoring Results<br />
In 2003 there were 40 samples for E. coli taken in the monitoring program at Sand Dunes beach,<br />
and 1 (2.5%) of the E. coli tests exceeded the advisory level (235 E. coli /100ml of water) and<br />
none exceeded the closure level (1,000 E. coli /100ml of water) (Table 1, pg 38 and Figure 2, pg<br />
41). In 2004 there were 14 E. coli samples taken, and none of the E. coli tests exceeded the<br />
28
advisory level or closure level. In <strong>2005</strong> there were 14 E. coli samples taken, and none of the E.<br />
coli tests exceeded the advisory level or closure level.<br />
Physical Features<br />
Surveys of the physical characteristics of Sand Dunes beach show that there are no storm water<br />
pipes or streams that discharge water onto the beach. There are no bathroom facilities at this<br />
beach. The wastewater from the residents that are within the entire bay of the beach is treated by<br />
onsite private wastewater treatment systems.<br />
Impact of Wind and Waves<br />
In <strong>2005</strong> there was no correlation found between elevated E. coli counts and wind. There was no<br />
correlation between elevated E. coli counts and wave height in <strong>2005</strong>.<br />
Impact of Birds<br />
There was no correlation between bird counts or the amount of bird waste and E. coli in 2004 or<br />
<strong>2005</strong>, indicating that the number of birds present at the time of water sampling, and the amount<br />
of bird waste calculated in the survey may not have a significant effect on the E. coli<br />
concentrations at the beach (Table 7 and Table 8, pg 66).<br />
Summary<br />
Overall the tests and data analysis done thus far for the beach contamination source identification<br />
project at Sand Dunes beach do not determine the source(s) of E. coli contamination. The<br />
immediate potential sources of E. coli at Sand Dunes beach are the re-suspension of potentially<br />
contaminated near shore beach sediments caused by wave activity. Potential E. coli in the beach<br />
sediment is most likely from fecal droppings in the beach sediments. There is also a potential for<br />
individual onsite private wastewater treatment systems in close proximity to the beach to be<br />
failing and contributing E. coli to beach sediment and water.<br />
Recommendations for additional source identification work:<br />
Test the identity of E. coli in the near shore beach sands and in Cladophora algae mats if mean<br />
E. coli level increases, or if beach swimming advisory and closures increase. Continue avian<br />
counts during the beach monitoring E. coli sample collection, and discontinue the avian waste<br />
survey.<br />
Beach management recommendations and requirements for the 2006:<br />
There are no beach management recommendations or requirements at this time.<br />
School House Beach<br />
Public Health Beach Monitoring Results<br />
In 2003 there were 40 samples for E. coli taken in the monitoring program at School House<br />
beach, and 2 (5%) of the E. coli tests exceeded the advisory level (235 E. coli /100ml of water)<br />
and none exceeded the closure level (1,000 E. coli /100ml of water) (Table 1, pg 38 and Figure<br />
2, pg 41). In 2004 there were 14 E. coli samples taken, and no E, coli levels over the advisory<br />
levels. In <strong>2005</strong> there were 14 E. coli samples taken, and no E, coli levels over the advisory<br />
levels.<br />
Physical Features<br />
School house beach is a cobble beach with a % slope.<br />
Surveys of the physical characteristics of School House beach show that the beach has no storm<br />
water pipes or streams that outlet water to the beach or surrounding bay. Water runoff from the<br />
parking lot and connecting streets discharge to the beach water during moderate to heavy<br />
29
ainfall. The beach substrate is rock so the runoff potential is much great than the sand beaches.<br />
The bathroom facility at this beach consists of two concrete pit toilets. The wastewaters from<br />
these toilets and from the residents that are within the entire bay of the beach are treated with<br />
onsite private wastewater treatment systems.<br />
Impact of Wind and Waves<br />
In <strong>2005</strong> there was no correlation found between elevated E. coli counts and wind. There was no<br />
correlation between elevated E. coli counts and wave height in <strong>2005</strong>.<br />
Impact of Birds<br />
There was no correlation between bird counts or the amount of bird waste and E. coli in 2004 or<br />
<strong>2005</strong>, indicating that the number of birds present at the time of water sampling, and the amount<br />
of bird waste calculated in the survey may not have a significant effect on the E. coli<br />
concentrations at the beach (Table 7 and Table 8, pg 66).<br />
Summary<br />
Overall the tests and data analysis done thus far for the beach contamination source identification<br />
project at School House beach do not determine the source(s) of E. coli contamination. The<br />
immediate potential sources of E. coli at School House beach are from storm water runoff from<br />
the parking lot and washing of potentially contaminated near shore beach sediments caused by<br />
wave activity. E. coli in the beach sediment are most likely from fecal droppings in the beach<br />
sediments and on the parking lot. There is also a potential for individual onsite private<br />
wastewater treatment systems in close proximity to the beach to be failing and contributing E.<br />
coli to beach sediment and water.<br />
Recommendations for additional source identification work:<br />
Test the identity of E. coli in the near shore beach sands and in Cladophora algae mats if mean<br />
E. coli level increases, or if beach swimming advisory and closures increase. Continue avian<br />
counts during the beach monitoring E. coli sample collection, and discontinue the avian waste<br />
survey.<br />
Beach management recommendations and requirements for the 2006:<br />
There are no beach management recommendations or requirements at this time.<br />
Percy Johnson Memorial Park Beach<br />
Public Health Beach Monitoring Results<br />
In 2003 there were 39 samples for E. coli taken in the monitoring program at Percy beach, and 1<br />
(2.6%) of the E. coli tests exceeded the advisory level (235 E. coli /100ml of water) and the<br />
closure level (1,000 E. coli /100ml of water) (Table 1, pg 38 and Figure 2, pg 41). In 2004 there<br />
were 14 E. coli samples taken, and no E, coli levels over the advisory levels. In <strong>2005</strong> there were<br />
14 E. coli samples taken, and no E, coli levels over the advisory levels.<br />
Physical Features<br />
Percy Johnson beach has a sand cobble mix with a % slope. Surveys of the physical<br />
characteristics of Percy beach show that the beach has no storm water pipes or streams that outlet<br />
water to the beach or surrounding bay. Storm water runoff occurs from the parking lot and<br />
connecting streets outlets onto the beach water during moderate to heavy rainfall. The<br />
wastewaters from the residents that are within the entire bay of the beach are treated with onsite<br />
private wastewater treatment systems.<br />
30
Impact of Wind and Waves<br />
In <strong>2005</strong> there was no correlation found between elevated E. coli counts and wind. There was no<br />
correlation between elevated E. coli counts and wave height in <strong>2005</strong>.<br />
Impact of Birds<br />
There was no correlation between bird counts or the amount of bird waste and E. coli in 2004 or<br />
<strong>2005</strong>, indicating that the number of birds present at the time of water sampling, and the amount<br />
of bird waste calculated in the survey may not have a significant effect on the E. coli<br />
concentrations at the beach (Table 7 and Table 8, pg 66).<br />
Summary<br />
Overall the tests and data analysis done thus far for the beach contamination source identification<br />
project at Percy beach do not determine the source(s) of E. coli contamination. The immediate<br />
potential sources of E. coli at Percy beach are re-suspension of potentially contaminated near<br />
shore beach sediments caused by wave activity. Potential E. coli in the beach sediment is most<br />
likely from fecal droppings in the beach sediments and on the parking lot. There is also a<br />
potential for individual onsite private wastewater treatment systems, in close proximity to the<br />
beach, to be failing and contributing E. coli to beach sediment and water.<br />
Recommendations for additional source identification work:<br />
Test the identity of E. coli in the near shore beach sands and in Cladophora algae mats if mean<br />
E. coli level increases, or if beach swimming advisory and closures increase. Continue avian<br />
counts during the beach monitoring E. coli sample collection, and discontinue the avian waste<br />
survey.<br />
Beach management recommendations and requirements for the 2006:<br />
There are no beach management recommendations or requirements at this time.<br />
Gialison Park Beach<br />
Public Health Beach Monitoring Results<br />
In 2003 there were 38 samples for E. coli taken in the monitoring program at Gialison beach,<br />
and none of the E. coli tests exceeded the advisory level (235 E. coli /100ml of water) or<br />
closure level (1,000 E. coli /100ml of water) (Table 1, pg 38 and Figure 2, pg 41). In 2004 there<br />
were 10 E. coli samples taken and none of the E. coli levels were over the advisory level. In<br />
<strong>2005</strong> there were 14 E. coli samples taken and none of the E. coli levels were over the advisory<br />
level.<br />
Physical Features<br />
Gialison beach has sand with a % slope. Surveys of the physical characteristics of Gialison<br />
beach show that the beach has no storm water pipes or streams that outlet water to the beach or<br />
surrounding bay. Water runoff from the parking lot and connecting streets outlets to the beach<br />
water during moderate to heavy rainfall. There are no bathroom facilities at this beach. The<br />
wastewaters from the residents that are within the entire bay of the beach are treated with onsite<br />
private wastewater treatment systems.<br />
Impact of Wind and Waves<br />
In <strong>2005</strong> there was no correlation found between elevated E. coli counts and wind. There was a<br />
correlation between elevated E. coli counts and wave height in <strong>2005</strong> (Table 6, pg 60).<br />
Impact of Birds<br />
There was no correlation between bird counts or the amount of bird waste and E. coli in 2004 or<br />
31
<strong>2005</strong>, indicating that the number of birds present at the time of water sampling, and the amount<br />
of bird waste calculated in the survey may not have a significant effect on the E. coli<br />
concentrations at the beach (Table 7 and Table 8, pg 66).<br />
Summary<br />
Overall the tests and data analysis done thus far for the beach contamination source identification<br />
project at Gialison beach do not determine the source(s) of E. coli contamination. the immediate<br />
potential sources of E. coli at Gialison beach are storm water from parking lot, street, and beach<br />
runoff, and re-suspension of potentially contaminated near shore beach sediments caused by<br />
wave activity. Potential E. coli concentrations of beach sediments need to be measured.<br />
Potential E. coli in the beach sediment is most likely from fecal droppings in the beach sediments<br />
and on the parking lot. There is also a potential for individual onsite private wastewater<br />
treatment systems, in close proximity to the beach, to be failing and contributing E. coli to beach<br />
sediment and water.<br />
Recommendations for additional source identification work:<br />
Test the identity of E. coli in the near shore beach sands and in Cladophora algae mats if mean<br />
E. coli level increases, or if beach swimming advisory and closures increase. Continue avian<br />
counts during the beach monitoring E. coli sample collection, and discontinue the avian waste<br />
survey.<br />
Beach management recommendations and requirements for the 2006:<br />
There are no beach management recommendations or requirements at this time.<br />
Jackson Harbor Beach<br />
Public Health Beach Monitoring Results<br />
In 2003 there were 39 samples for E. coli taken in the monitoring program at Jackson Harbor<br />
beach, and 1 (2.6%) of the E. coli tests exceeded the advisory level (235 E. coli /100ml of<br />
water) and none exceeded the closure level (1,000 E. coli /100ml of water) (Table 1, pg 38 and<br />
Figure 2, pg 41). In 2004 there were 14 E. coli samples taken and none of the E. coli levels were<br />
over the advisory level. In <strong>2005</strong> there were 15 E. coli samples taken and 1 (7%) of the tests<br />
exceeded the advisory and none exceeded the closure level.<br />
Physical Features<br />
Jackson Harbor beach is a cobble beach with a % slope. Surveys of the physical characteristics<br />
of Jackson Harbor beach show that the beach has no storm water pipes or streams that outlet<br />
water to the beach or surrounding bay. A parking lot and marina areas contribute storm water<br />
runoff to the northwestern corner of the bay the beach is within. There are several concrete pit<br />
toilets at this beach. The wastewaters from the residents that are within the entire bay of the<br />
beach are treated with onsite private wastewater treatment systems.<br />
Impact of Wind and Waves<br />
In <strong>2005</strong> there was no correlation found between elevated E. coli counts and wind. There was no<br />
correlation between elevated E. coli counts and wave height in <strong>2005</strong>.<br />
Impact of Birds<br />
There was no correlation between bird counts or the amount of bird waste and E. coli in 2004 or<br />
<strong>2005</strong>, indicating that the number of birds present at the time of water sampling, and the amount<br />
of bird waste calculated in the survey may not have a significant effect on the E. coli<br />
concentrations at the beach (Table 7 and Table 8, pg 66).<br />
32
Summary<br />
Overall the tests and data analysis done thus far for the beach contamination source identification<br />
project at Jackson Harbor beach do not determine the source(s) of E. coli contamination. The<br />
immediate potential sources of E. coli at Jackson Harbor beach are from storm water runoff<br />
from marina area and re-suspension of potentially contaminated near shore beach sediments<br />
caused by wave activity. Potential E. coli in the beach sediment is most likely from fecal<br />
droppings in the beach sediments. There is also a potential for individual onsite private<br />
wastewater treatment systems, in close proximity to the beach, to be failing and contributing E.<br />
coli to beach sediment and water.<br />
Recommendations for additional source identification work:<br />
Test the identity of E. coli in the near shore beach sands and in Cladophora algae mats if mean<br />
E. coli level increases, or if beach swimming advisory and closures increase. Continue avian<br />
counts during the beach monitoring E. coli sample collection, and discontinue the avian waste<br />
survey.<br />
Beach management recommendations and requirements for the 2006:<br />
There are no beach management recommendations or requirements at this time.<br />
Rock Island Beach<br />
Public Health Beach Monitoring Results<br />
In 2003 there were 14 samples for E. coli taken in the monitoring program at Rock Island beach,<br />
and none of the E. coli tests exceeded the advisory level (235 E. coli /100ml of water) or<br />
closure level (1,000 E. coli /100ml of water) (Table 1, pg 38 and Figure 2, pg 41). In 2004 there<br />
were 14 E. coli samples taken and none of the E. coli levels were over the advisory level. In<br />
<strong>2005</strong> there were 14 E. coli samples taken and none of the E. coli levels were over the advisory<br />
level.<br />
Physical Features<br />
Rock Island beach is a cobble beach with a % slope. Surveys of the physical characteristics of<br />
Rock Island beach show that the beach has no storm water pipes or streams that outlet water to<br />
the beach or surrounding bay. There are no bathroom facilities at the beach. The wastewater<br />
from the campsites and all other bathroom facilities on the island is treated with an onsite private<br />
wastewater treatment system that is not within proximity of the beach.<br />
Impact of Wind and Waves<br />
In <strong>2005</strong> there was no correlation found between elevated E. coli counts and wind. There was no<br />
correlation between elevated E. coli counts and wave height in <strong>2005</strong>.<br />
Impact of Birds<br />
There was no correlation between bird counts or the amount of bird waste and E. coli in 2004 or<br />
<strong>2005</strong>, indicating that the number of birds present at the time of water sampling, and the amount<br />
of bird waste calculated in the survey may not have a significant effect on the E. coli<br />
concentrations at the beach (Table 7 and Table 8, pg 66).<br />
Summary<br />
Overall the tests and data analysis done thus far for the beach contamination source identification<br />
project at Rock Island beach do not determine the source(s) of E. coli contamination. The<br />
immediate potential sources of E. coli at Rock Island beach are from the re-suspension and<br />
washing of potentially contaminated near shore beach sediments caused by wave activity.<br />
33
Potential E. coli in the beach sediment is most likely from fecal droppings in the beach<br />
sediments.<br />
Recommendations for additional source identification work:<br />
Test the identity of E. coli in the near shore beach sands and in Cladophora algae mats if mean<br />
E. coli level increases, or if beach swimming advisory and closures increase. Continue avian<br />
counts during the beach monitoring E. coli sample collection, and discontinue the avian waste<br />
survey.<br />
Beach management recommendations and requirements for the 2006:<br />
There are no beach management recommendations or requirements at this time.<br />
Inland Lake Beaches<br />
There are three inland lakes monitored in <strong>Door</strong> <strong>County</strong> (Clark, Kangaroo, and Europe).<br />
These beaches have significantly lower mean E. coli concentrations than the beaches located on<br />
the Sturgeon Bay Canal, Green Bay and Lake Michigan (Figure 4, pg 44). The mean E. coli<br />
levels at the inland lake beaches grouped with the mean E. coli levels from the island beaches,<br />
both types of beach had the lowest E. coli mean levels in <strong>Door</strong> <strong>County</strong>. One (33%) of the inland<br />
lake beaches has a storm water pipe that brings storm water directly to the beach. All of the<br />
beaches have runoff areas that contribute storm water from the beach parking lot.<br />
Clark Lake<br />
Public Health Beach Monitoring Results<br />
In 2003 there were 16 samples for E. coli taken in the monitoring program at Clark Lake beach,<br />
and no of the E. coli tests exceeded the advisory level (235 E. coli /100ml of water) or closure<br />
level (1,000 E. coli /100ml of water) (Table 1, pg 38 and Figure 2, pg 41). In 2004 there were<br />
54 E. coli samples taken and none of the E. coli levels were over the advisory level or closure<br />
levels. In <strong>2005</strong> there were 15 E. coli samples taken and 1 (7%) of the E. coli tests was over the<br />
advisory level and none of the E. coli levels were over the closure level.<br />
Physical Features<br />
Clark Lake beach is a sand beach with a % slope. Surveys of the physical characteristics of<br />
Clark Lake beach show that the beach has no storm water pipes or streams that outlet water to<br />
the beach. There is a stream that flows into the lake on the northwestern shoreline and flows<br />
from the lake just west of the beach. The bathroom facility at this beach consists of a portable<br />
outhouse and wastewater from the residents the lake is treated by onsite private wastewater<br />
treatment systems.<br />
Impact of Wind and Waves<br />
In <strong>2005</strong> there was no correlation found between elevated E. coli counts and wind. There was no<br />
correlation between elevated E. coli counts and wave height in <strong>2005</strong>.<br />
Impact of Birds<br />
There was no correlation between bird counts or the amount of bird waste and E. coli in 2004 or<br />
<strong>2005</strong>, indicating that the number of birds present at the time of water sampling, and the amount<br />
of bird waste calculated in the survey may not have a significant effect on the E. coli<br />
concentrations at the beach (Table 7 and Table 8, pg 66).<br />
Summary<br />
Overall the tests and data analysis done thus far for the beach contamination source identification<br />
project at Clark Lake beach do not determine the source(s) of E. coli contamination. The<br />
34
immediate potential sources of E. coli at Clark Lake beach are from the re-suspension of<br />
potentially contaminated near shore beach sediments caused by wave activity. Potential E. coli<br />
in the beach sediment is most likely from fecal droppings in the beach sediments. There is also a<br />
potential for individual onsite private wastewater treatment systems, in close proximity to the<br />
beach, to be failing and contributing E. coli to beach sediment and water.<br />
Recommendations for additional source identification work:<br />
Test the identity of E. coli in the near shore beach sands and in Cladophora algae mats if mean<br />
E. coli level increases, or if beach swimming advisory and closures increase. Continue avian<br />
counts during the beach monitoring E. coli sample collection, and discontinue the avian waste<br />
survey.<br />
Beach management recommendations and requirements for the 2006:<br />
There are no beach management recommendations or requirements at this time.<br />
Kangaroo Lake<br />
Public Health Beach Monitoring Results<br />
In 2003 there were 16 samples for E. coli taken in the monitoring program at Kangaroo Lake<br />
beach, and no of the E. coli tests exceeded the advisory level (235 E. coli /100ml of water) or<br />
closure level (1,000 E. coli /100ml of water) (Table 1, pg 38 and Figure 2, pg 41). In 2004 there<br />
were 15 E. coli samples taken and 1 (6.6%) of the E. coli levels were over the advisory level and<br />
none exceeded the closure level. In <strong>2005</strong> there were 14 E. coli samples taken and 1 (7%) of the<br />
E. coli levels were over the advisory level and none exceeded the closure level.<br />
Physical Features<br />
Kangaroo beach is a cobble/stone beach with a % slope. Surveys of the physical characteristics<br />
of Kangaroo Lake beach show that the beach has no storm water pipes or streams that outlet<br />
water to the beach. There is a runoff area that drains storm water from the street on to the beach.<br />
There are no bathroom facilities at this beach. The wastewater from the residents on the lake is<br />
treated by onsite private wastewater treatment systems.<br />
Impact of Wind and Waves<br />
In <strong>2005</strong> there was no correlation found between elevated E. coli counts and wind. There was no<br />
correlation between elevated E. coli counts and wave height in <strong>2005</strong>.<br />
Impact of Birds<br />
There was no correlation between bird counts or the amount of bird waste and E. coli in 2004 or<br />
<strong>2005</strong>, indicating that the number of birds present at the time of water sampling, and the amount<br />
of bird waste calculated in the survey may not have a significant effect on the E. coli<br />
concentrations at the beach (Table 7 and Table 8, pg 66). It is recommended that avian counts<br />
continue during the beach monitoring E. coli sample collection, and that avian waste survey be<br />
discontinued.<br />
Summary<br />
Overall the tests and data analysis done thus far for the beach contamination source identification<br />
project at Kangaroo Lake beach do not determine what the source(s) of E. coli contamination<br />
are. The immediate potential sources of E. coli at Kangaroo Lake beach are from the street<br />
runoff and the re-suspension of potentially contaminated near shore beach sediments caused by<br />
wave activity. Potential E. coli in the beach sediment is most likely from fecal droppings in the<br />
beach sediments. There is also a potential for individual onsite private wastewater treatment<br />
35
systems, in close proximity to the beach, to be failing and contributing E. coli to beach sediment<br />
and water.<br />
Recommendations for additional source identification work:<br />
Test the identity of E. coli in the near shore beach sands and in Cladophora algae mats if mean<br />
E. coli level increases, or if beach swimming advisory and closures increase. Continue avian<br />
counts during the beach monitoring E. coli sample collection, and discontinue the avian waste<br />
survey.<br />
Beach management recommendations and requirements for the 2006:<br />
There are no beach management recommendations or requirements at this time.<br />
Europe Lake<br />
Public Health Beach Monitoring Results<br />
In 2003 there were 16 samples for E. coli taken in the monitoring program at Europe Lake<br />
beach, and no of the E. coli tests exceeded the advisory level (235 E. coli /100ml of water) or<br />
closure level (1,000 E. coli /100ml of water) (Table 1, pg 38 and Figure 2, pg 41). In 2004 there<br />
were 20 E. coli samples taken and none of the E. coli levels were over the advisory or closure<br />
level. In <strong>2005</strong> there were 15 E. coli samples taken and none of the E. coli levels were over the<br />
advisory or closure level.<br />
Physical Features<br />
Europe Lake beach is a sand and cobble beach with a % slope. Surveys of the physical<br />
characteristics of Europe Lake beach show that the beach has a storm water pipe that drains<br />
storm water onto the beach from the immediate roadway leading to the beach. There is a runoff<br />
area that drains storm water from the street to boat launch at the beach. The bathroom facility at<br />
this beach consists of a portable outhouse and wastewater from the residents the lake is treated<br />
by onsite private wastewater treatment systems.<br />
Impact of Wind and Waves<br />
In <strong>2005</strong> there was no correlation found between elevated E. coli counts and wind. There was no<br />
correlation between elevated E. coli counts and wave height in <strong>2005</strong>.<br />
Impact of Birds<br />
There was no correlation between bird counts or the amount of bird waste and E. coli in 2004 or<br />
<strong>2005</strong>, indicating that the number of birds present at the time of water sampling, and the amount<br />
of bird waste calculated in the survey may not have a significant effect on the E. coli<br />
concentrations at the beach (Table 7 and Table 8, pg 66). It is recommended that avian counts<br />
continue during the beach monitoring E. coli sample collection, and that avian waste survey be<br />
discontinued.<br />
Summary<br />
Overall the tests and data analysis done thus far for the beach contamination source identification<br />
project at Europe Lake beach do not determine what the source(s) of E. coli contamination are.<br />
The immediate potential sources of E. coli at Europe Lake beach are from the storm water runoff<br />
and the re-suspension of potentially contaminated near shore beach sediments cause by wave<br />
activity<br />
Recommendations for additional source identification work:<br />
Test the identity of E. coli in the near shore beach sands and in Cladophora algae mats if mean<br />
E. coli level increases, or if beach swimming advisory and closures increase. Continue avian<br />
36
counts during the beach monitoring E. coli sample collection, and discontinue the avian waste<br />
survey.<br />
Beach management recommendations and requirements for the 2006:<br />
There are no beach management recommendations or requirements at this time.<br />
Beach Project Methodology and Results 2003-<strong>2005</strong><br />
Beach Monitoring Program<br />
Primary Responsibility of <strong>Door</strong> <strong>County</strong> Public Health Department<br />
Monitoring Methodology<br />
There are two major reasons to implement a beach bacteria-monitoring program. The first<br />
reason is to protect swimmers from exposure to waterborne pathogens, like viruses and bacteria<br />
that may make them sick. The presence of E. coli indicates the presence of human and or animal<br />
fecal matter in the water. If E. coli counts are high enough that there is a risk of human illness<br />
then a beach advisory or closure can be issued. Another reason to monitored E. coli in beach<br />
water is to assist in identifying pollution sources that may exist somewhere in the beach<br />
watershed.<br />
The beach monitoring program consists of taking a water sample in 24 inches of water at the<br />
center of 29 public beaches in <strong>Door</strong> <strong>County</strong>. The <strong>Door</strong> <strong>County</strong> Public Health Department<br />
contracted with the Microbiology Department at the University of Wisconsin Oshkosh to collect<br />
and analyze the water samples for E. coli. The Idexx Colisure E. coli test was used to determine<br />
the level of E. coli at the monitored beaches. The Idexx Colisure E. coli test takes 18 hours to<br />
determine E. coli levels and reveals E. coli Most Probable Number (MPN) per 100 ml of water.<br />
If the E. coli levels were found to exceed the advisory or closure levels an advisory or closure<br />
sign was posted at the beach. The advisory and closure E. coli standards were set by the<br />
Wisconsin Department of Natural Resources according to a statistical probability that swimmers<br />
may become ill from swimming in water with E. coli levels of these magnitudes. The advisory<br />
E. coli level is 235 Most Probable Number (MPN) of E. coli colonies in a 100 ml water (E. coli<br />
/100ml of water). This level is based on the probability that 8 out of 1,000 people will become<br />
ill from swimming. The closure E. coli level is 1,000 E. coli /100ml of water and is based on the<br />
probability that 14 out of 1,000 people will become ill from swimming. A sign is posted at the<br />
beach to indicate the E. coli count, see Figure 1.<br />
Figure 1: <strong>Door</strong> <strong>County</strong> Health Department beach monitoring for E. coli public information<br />
signs.<br />
37
The “Stop Closed: sign appears on a 5 foot high post if there are more than 1,000 colonies of E. coli per<br />
liter of water and the “Warning Water Quality Today is Poor” appears in the same way if there are more<br />
that 235 colonies of E. coli per liter of water.<br />
Monitoring occurs from mid May to mid September. The monitored beaches were prioritized by<br />
the Wisconsin Department of Natural Resources and DCPHD to determine the frequency of<br />
weekly monitoring. High priority beaches are typically monitored 4-5 days per week, medium<br />
priority beaches are monitored 2-3 days per week and low priority beaches are monitored one<br />
day per week.<br />
Monitoring Results<br />
The percentage of beach advisories and closures is different at each of the 29 monitored beaches<br />
in <strong>Door</strong> <strong>County</strong>. See Table 1 and Figure 2 for beach monitoring results 2003-<strong>2005</strong>.<br />
Table 1: E. coli testing May - September, 2003-<strong>2005</strong> <strong>Door</strong> <strong>County</strong>, WI<br />
Beach Year<br />
Anclam<br />
2003<br />
Baileys<br />
Clark<br />
Egg Harbor<br />
Ellison Bay<br />
Ephraim<br />
Europe Lake<br />
Europe Bay 1<br />
Europe Bay 2<br />
2004<br />
#<br />
Samples<br />
36<br />
28<br />
#<br />
Advisory<br />
38<br />
#<br />
Closure<br />
1 0<br />
1 0<br />
<strong>2005</strong> 29 1 0<br />
2003<br />
88<br />
4 1<br />
2004<br />
56<br />
5 1<br />
<strong>2005</strong> 57 1 0<br />
2003 17 0 0<br />
2004<br />
55<br />
0 0<br />
<strong>2005</strong> 15 1 0<br />
2003<br />
87<br />
3 1<br />
2004<br />
57<br />
8 1<br />
<strong>2005</strong> 56 3 1<br />
2003<br />
89<br />
3 1<br />
2004<br />
58<br />
5 1<br />
<strong>2005</strong> 57 3 0<br />
2003<br />
86<br />
0 0<br />
2004<br />
56<br />
0 0<br />
<strong>2005</strong> 56 3 1<br />
2003<br />
16<br />
0 0<br />
2004<br />
20<br />
0 0<br />
<strong>2005</strong> 15 0 0<br />
2003<br />
39<br />
0 0<br />
2004<br />
28<br />
1 0<br />
<strong>2005</strong> 29 0 0<br />
2003<br />
40<br />
0 0<br />
2004<br />
28<br />
1 0<br />
<strong>2005</strong> 29 0 0<br />
%<br />
%<br />
Advisories Closure<br />
3% 0%<br />
4% 0%<br />
3% 0%<br />
5% 1%<br />
9% 2%<br />
2% 0%<br />
0% 0%<br />
0% 0%<br />
7% 0%<br />
3% 1%<br />
14% 2%<br />
5% 2%<br />
3% 1%<br />
9% 2%<br />
5% 0%<br />
0% 0%<br />
0% 0%<br />
5% 2%<br />
0% 0%<br />
0% 0%<br />
0% 0%<br />
0% 0%<br />
4% 0%<br />
0% 0%<br />
0% 0%<br />
4% 0%<br />
0% 0%
Table 1 Continued: E. coli testing May -September, 2003-<strong>2005</strong> <strong>Door</strong> <strong>County</strong>, WI<br />
Europe Bay 3<br />
Europe Lake<br />
Fish Creek<br />
Gialison<br />
Haines Park<br />
Jackson Harbor<br />
Kangaroo<br />
Lakeside<br />
Murphy<br />
Newport State Park<br />
Nicolet Bay<br />
Otumba Park<br />
Percy Johnson<br />
Portage Park<br />
2003<br />
2004<br />
39<br />
28<br />
39<br />
0 1<br />
1 0<br />
<strong>2005</strong> 29 0 0<br />
2003<br />
16<br />
0 0<br />
2004<br />
20<br />
0 0<br />
<strong>2005</strong> 15 0 0<br />
2003<br />
88<br />
3 0<br />
2004<br />
57<br />
5 1<br />
<strong>2005</strong> 57 5 3<br />
2003<br />
38<br />
0 0<br />
2004<br />
10<br />
0 0<br />
<strong>2005</strong> 14 0 0<br />
2003<br />
18<br />
0 0<br />
2004<br />
16<br />
2 0<br />
<strong>2005</strong> 14 0 0<br />
2003<br />
39<br />
1 0<br />
2004<br />
14<br />
0 0<br />
<strong>2005</strong> 15 1 0<br />
2003 16 0 0<br />
2004<br />
18<br />
0 0<br />
<strong>2005</strong> 14 1 0<br />
2003<br />
42<br />
2 1<br />
2004<br />
32<br />
4 0<br />
<strong>2005</strong> 29 2 1<br />
2003<br />
86<br />
0 1<br />
2004<br />
59<br />
7 4<br />
<strong>2005</strong> 57 6 2<br />
2003<br />
86<br />
2 0<br />
2004<br />
56<br />
1 0<br />
<strong>2005</strong> 56 0 0<br />
2003<br />
86<br />
1 2<br />
2004<br />
58<br />
4 2<br />
<strong>2005</strong> 56 5 1<br />
2003<br />
92<br />
5 0<br />
2004<br />
60<br />
6 2<br />
<strong>2005</strong> 57 6 2<br />
2003<br />
39<br />
1 1<br />
2004<br />
14<br />
0 0<br />
<strong>2005</strong> 14 0 0<br />
2003<br />
24<br />
1 0<br />
2004<br />
29<br />
1 1<br />
<strong>2005</strong> 34 6 2<br />
0% 3%<br />
4% 0%<br />
0% 0%<br />
0% 0%<br />
0% 0%<br />
0% 0%<br />
3% 0%<br />
9% 2%<br />
9% 5%<br />
0% 0%<br />
0% 0%<br />
0% 0%<br />
0% 0%<br />
13% 0%<br />
0% 0%<br />
3% 0%<br />
0% 0%<br />
7% 0%<br />
0% 0%<br />
0% 0%<br />
7% 0%<br />
5% 2%<br />
13% 0%<br />
7% 3%<br />
0% 1%<br />
12% 7%<br />
11% 4%<br />
2% 0%<br />
2% 0%<br />
0% 0%<br />
1% 2%<br />
7% 3%<br />
9% 2%<br />
5% 0%<br />
10% 3%<br />
11% 4%<br />
3% 3%<br />
0% 0%<br />
0% 0%<br />
4% 0%<br />
3% 3%<br />
18% 6%
Table 1 Continued: E. coli testing May -September, 2003-<strong>2005</strong> <strong>Door</strong> <strong>County</strong>, WI<br />
Rock Island<br />
Sand Dune<br />
Sandy Bay<br />
School House<br />
Sister Bay<br />
Sturgeon Bay Rec. Canal<br />
Sunset (Sturgeon Bay)<br />
Whitefish Bay<br />
Whitefish Dunes<br />
2003<br />
2004<br />
14<br />
11<br />
40<br />
0 0<br />
0 0<br />
<strong>2005</strong> 14 0 0<br />
2003<br />
40<br />
1 0<br />
2004<br />
14<br />
0 0<br />
<strong>2005</strong> 14 0 0<br />
2003<br />
39<br />
0 0<br />
2004<br />
25<br />
0 0<br />
<strong>2005</strong> 28 0 0<br />
2003<br />
40<br />
2 0<br />
2004<br />
14<br />
0 0<br />
<strong>2005</strong> 14 0 0<br />
2003<br />
85<br />
4 0<br />
2004<br />
55<br />
3 1<br />
<strong>2005</strong> 57 3 0<br />
2003<br />
42<br />
1 0<br />
2004<br />
28<br />
0 0<br />
<strong>2005</strong> 32 4 2<br />
2003<br />
91<br />
9 1<br />
2004<br />
58<br />
12 1<br />
<strong>2005</strong> 58 12 4<br />
<strong>2005</strong> 14 0 0<br />
2003<br />
87<br />
7 2<br />
2004<br />
56<br />
0 1<br />
<strong>2005</strong> 60 5 3<br />
0% 0%<br />
0% 0%<br />
0% 0%<br />
3% 0%<br />
0% 0%<br />
0% 0%<br />
0% 0%<br />
0% 0%<br />
0% 0%<br />
5% 0%<br />
0% 0%<br />
0% 0%<br />
5% 0%<br />
5% 2%<br />
5% 0%<br />
2% 0%<br />
0% 0%<br />
13% 6%<br />
10% 1%<br />
21% 2%<br />
21% 7%<br />
0% 0%<br />
8% 2%<br />
0% 2%<br />
8% 5%
16%<br />
14%<br />
12%<br />
10%<br />
8%<br />
6%<br />
4%<br />
2%<br />
0%<br />
25%<br />
20%<br />
15%<br />
10%<br />
Figure 2: E. coli testing May - September 2003-<strong>2005</strong> <strong>Door</strong> <strong>County</strong>, WI<br />
Anclam Baileys Clark Egg Harbor Ellison Bay Ephraim Europe Lake Europe Bay 1 Europe Bay 2 Europe Bay 3 Fish Creek Gialison Haines Park<br />
5%<br />
0%<br />
Newport<br />
St ate Park<br />
Figure 2 Continued: E. coli testing May -September, 2003-<strong>2005</strong> <strong>Door</strong> <strong>County</strong>, WI<br />
Nicolet Bay Otumba Park Percy<br />
Johnson<br />
Portage Park Rock Island Sand Dune Sandy Bay School House Sist er Bay Sturgeon Bay Sunset Whit ef ish Whitefish<br />
Rec. Canal (Sturgeon<br />
Bay)<br />
Bay Dunes<br />
41<br />
% A dv i sor i es<br />
% Closure<br />
% A dv i sor i es<br />
% Closure
Beach Contamination Source Identification Program<br />
Primary Responsibility of <strong>Door</strong> <strong>County</strong> Soil and Water Conservation Department (SWCD)<br />
Overall Beach Contamination Source Identification Methodology<br />
The overall goal of this project is to identify sources of beach pollution so that pollution<br />
abatement efforts can be effective and efficient. In 2004 and <strong>2005</strong> SWCD used the data<br />
collected in 2003 to determine the locations for additional water sampling. Water and sand<br />
samples were taken at various beaches to determine:<br />
Presence of pathogens (Shigella, Salmonella, Campylobacter);<br />
Spatial distribution and concentrations of E. coli in beach water, beach sand, and<br />
storm water;<br />
E. coli concentrations during and after rain fall events (1, 2, 3, 4, 8, 12, and 24 hours<br />
after rain events of at least 0.25 inches within 24 hours);<br />
Genetic identity of E. coli that was isolated from water samples to determine human<br />
vs. animal E. coli sources; and<br />
Antibiotic resistance of E. coli was tested to determine human vs. animal E. coli<br />
sources.<br />
Rain data were also collected in proximity of every monitored beach in <strong>Door</strong> <strong>County</strong> and an<br />
Avian Waste Survey was conducted at 11 beaches. Ambient conditions were recorded at the<br />
time the water sample was taken for beach monitoring (number of birds, weather, wind direction,<br />
wave height, and water/air temperatures).<br />
The purpose of collecting ambient conditions at the beach (rainfall, bird populations, and algae<br />
presence) was to determine which one or combination of these parameters is the most correlated<br />
to E. coli concentrations at the beach. The purpose of testing the E. coli isolates collected from<br />
the water and sand samples was to determine whether the source(s) of E. coli found in beach<br />
waters were from a human source or an animal source. Beach water was tested for pathogens to<br />
determine the presence of other substances that may have been a threat to human health.<br />
For this interim beach report statistical analysis was done for all 29 beaches on data collected in<br />
2004 and <strong>2005</strong> on the following parameters: rainfall from 3 locations in <strong>Door</strong> <strong>County</strong>, wind<br />
direction, wave height, barometric pressure, beach location E. coli distribution, seasonal E. coli<br />
distribution, and bird populations. E. coli concentrations in beach water during and after rain<br />
events were analyzed at 11 beaches. Spatial distribution of E. coli in beach sand was analyzed at<br />
12 beaches. An avian waste survey was conducted at 13 beaches. Data collection and analysis<br />
was done on: spatial distribution of E. coli at 11 beaches, presence of pathogens at 10 beaches,<br />
and analysis of E. coli isolates for genetic identity and 20 beaches and antibiotic resistance<br />
profiles at 9 beaches. E. coli concentrations in storm water pipe systems were determined at<br />
Otumba Park and Ephraim Beach. These municipalities contributed the funds for storm water<br />
pipe/system testing, see Appendix A.<br />
SWCD contracted the University of Wisconsin – Oshkosh Microbiology Department to collect<br />
and analyze the water samples taken in 2004 and <strong>2005</strong>.<br />
Another component to the source identification project is the data organization and statistical<br />
analysis. The summary statistics presented in this interim report were obtained from several<br />
partnering research institutions. Further statistical investigations will be done by recreational<br />
water quality specialists. The statistical data sets developed in <strong>2005</strong> will be used to determine the<br />
2006 sampling methods.<br />
42
Specific Source Identification Methodology and Results<br />
Impact of Physical Features/Conditions<br />
Impact of Beach Location<br />
An analysis of beaches in 2004 and <strong>2005</strong> by location indicated that beaches located in Sturgeon<br />
Bay (Sunset and Otumba) had significantly higher counts than other beach locations. These<br />
other locations included, in order of decreasing overall mean E. coli , beaches on Green Bay,<br />
Lake Michigan, Washington/Rock islands, and inland lakes (Kangaroo, Europe, Clark). The<br />
inland lake and island beaches grouped together, but all other groups were significantly different<br />
from one another. The percentage of E. coli concentrations above the advisory level were also<br />
higher at beaches in Sturgeon Bay, followed by in descending order beaches on Green Bay, Lake<br />
Michigan, inland lakes and Washington/Rock islands (Figures 3 & 4).<br />
Figure 3: Mean E. coli count for categories of beaches in 2004.<br />
Error bars indicate + 1 S.E. (Lake= Anclam, Bailey, Europe, Lakeside, Newport, Portage, Sandy Bay,<br />
Sturgeon Bay Canal, Whitefish Dunes; Bay= Egg Harbor, Ellison Bay, Ephraim, Fish Creek, Haines,<br />
Murphy, Nicolet, Otumba, Sister Bay; Inland Lake= Clark, Europe, and Kangaroo Lakes; Island= Gialison,<br />
Jackson Harbor, Percy Johnson, Rock, Sand Dune and School House; Sturgeon Bay = Otumba, Sunset)<br />
LogE. coli<br />
1.50<br />
1.00<br />
0.50<br />
0.00<br />
<br />
<br />
<br />
1.03 1.39 0.66 0.75 1. 74<br />
Lake Bay Inland lake Island Sturgeon Bay<br />
location<br />
43
E.coli MPN/100mL<br />
250<br />
225<br />
200<br />
175<br />
150<br />
125<br />
100<br />
75<br />
50<br />
25<br />
0<br />
Figure 4: Mean E. coli MPN/100mL by Location in <strong>2005</strong>.<br />
Error bars indicate + 1 S.E. (Lake= Anclam, Bailey, Europe, Lakeside, Newport, Portage, Sandy Bay,<br />
Sturgeon Bay Canal, Whitefish Dunes; Bay= Egg Harbor, Ellison Bay, Ephraim, Fish Creek, Haines,<br />
Murphy, Nicolet, Otumba, Sister Bay; Inland Lake= Clark, Europe, and Kangaroo Lakes; Island= Gialison,<br />
Jackson Harbor, Percy Johnson, Rock, Sand Dune, and School House; Sturgeon Bay= Otumba, Sunset)<br />
Number of Beaches/Category<br />
Lake = 12<br />
Bay = 8<br />
Island = 6<br />
Canal =2<br />
Lake Bay Island<br />
Beach Location<br />
Inland Canal<br />
Seasonal Impact<br />
In 2004 E. coli counts at <strong>Door</strong> <strong>County</strong> beaches generally increased over the course of the<br />
summer, a pattern seen at many other Lake Michigan beaches. The data was statistically<br />
smoothed in order to reveal overall patterns and trends. A pattern of gradual buildings and<br />
dramatic decreases is indicated in the overall mean E. coli counts. This is a pattern not<br />
commonly seen but that gives evidence of ‘memory’ of E. coli counts. It is generally accepted<br />
that previous E. coli counts have little relationship to the next day’s count, which is a common<br />
criticism of the current standards for beach monitoring. The pattern seen at <strong>Door</strong> <strong>County</strong><br />
beaches is uncommon and it indicates that E. coli counts may build gradually over time,<br />
sometimes resulting in beach closure events. The percentage of E. coli concentration above the<br />
advisory level also increased from June to August in 2004 (Figures 5, 6 & 7).<br />
In <strong>2005</strong> E. coli counts at <strong>Door</strong> <strong>County</strong> beaches county-wide over the course of the<br />
summer were higher in June and July and significantly lower in August. The reason for this<br />
change in seasonal effect from 2004 to <strong>2005</strong> is not known.<br />
44
Figure 5: Mean E. coli count for all beaches over the summer 2004.<br />
Mean Log E. coli<br />
2.50<br />
2.00<br />
1.50<br />
1.00<br />
0.50<br />
0.00<br />
08/20/04<br />
08/18/04<br />
08/16/04<br />
08/13/04<br />
08/11/04<br />
08/09/04<br />
08/05/04<br />
08/03/04<br />
07/31/04<br />
07/29/04<br />
07/27/04<br />
07/23/04<br />
07/21/04<br />
07/19/04<br />
07/15/04<br />
07/13/04<br />
07/08/04<br />
07/06/04<br />
07/02/04<br />
06/30/04<br />
06/28/04<br />
06/24/04<br />
06/22/04<br />
06/18/04<br />
06/16/04<br />
06/14/04<br />
06/12/04<br />
06/10/04<br />
06/08/04<br />
06/04/04<br />
06/02/04<br />
05/31/04<br />
45<br />
date<br />
Figure 6: Entire <strong>County</strong> Mean E. coli MPN/100mL in Beach Water in <strong>2005</strong><br />
E.coli MPN/100mL<br />
1000<br />
900<br />
800<br />
700<br />
600<br />
500<br />
400<br />
300<br />
200<br />
100<br />
0<br />
09/01/04<br />
08/30/04<br />
08/26/04<br />
08/24/04<br />
5/31/<strong>2005</strong><br />
6/2/<strong>2005</strong><br />
6/6/<strong>2005</strong><br />
6/8/<strong>2005</strong><br />
6/12/<strong>2005</strong><br />
6/14/<strong>2005</strong><br />
6/16/<strong>2005</strong><br />
6/21/<strong>2005</strong><br />
6/23/<strong>2005</strong><br />
6/27/<strong>2005</strong><br />
6/29/<strong>2005</strong><br />
7/1/<strong>2005</strong><br />
7/5/<strong>2005</strong><br />
7/7/<strong>2005</strong><br />
7/12/<strong>2005</strong><br />
7/14/<strong>2005</strong><br />
7/16/<strong>2005</strong><br />
7/19/<strong>2005</strong><br />
7/21/<strong>2005</strong><br />
7/25/<strong>2005</strong><br />
7/27/<strong>2005</strong><br />
7/29/<strong>2005</strong><br />
8/2/<strong>2005</strong><br />
8/4/<strong>2005</strong><br />
8/7/<strong>2005</strong><br />
8/9/<strong>2005</strong><br />
8/11/<strong>2005</strong><br />
8/15/<strong>2005</strong><br />
8/17/<strong>2005</strong><br />
8/19/<strong>2005</strong><br />
8/22/<strong>2005</strong><br />
8/24/<strong>2005</strong><br />
8/26/<strong>2005</strong><br />
8/29/<strong>2005</strong><br />
8/31/<strong>2005</strong><br />
Date
Figure 7: Seasonal <strong>County</strong>wide Average E. coli MPN/100mL Beach Levels in <strong>2005</strong><br />
E. coli MPN/100mL<br />
90.0<br />
80.0<br />
70.0<br />
60.0<br />
50.0<br />
40.0<br />
30.0<br />
20.0<br />
10.0<br />
0.0<br />
June E.coli Ave July E.coli Ave.<br />
Month<br />
August E.coli Ave.<br />
Spatial E. coli Sampling Methodology<br />
In 2004 and <strong>2005</strong>, samples were taken at several beaches at water depths of 30cm, 60cm, and<br />
120cm. Spatial sampling across the length of the beach was conducted at the same beaches, and<br />
there was no difference in site location among left, middle, and right samples at any of the<br />
beaches.<br />
Spatial E. coli Sampling Results<br />
In 2004 and <strong>2005</strong>, samples were taken at several beaches at water depths of 30cm, 60cm, and<br />
120cm. E. coli counts were significantly different at all three depths for Ephraim (2004 only),<br />
Fish Creek, Otumba, Whitefish Dunes, Anclam, Lakeside, and Sunset (Sturgeon Bay) beaches,<br />
with the highest counts in shallow (30 cm) of water, and the lowest counts in deep (120 cm) of<br />
water (Figure 8). These results may suggest that the E. coli originates from the shore and washes<br />
into beach water. There was no significant difference among depths at Sister Bay, Baileys<br />
Harbor Ridges Ellison Bay, and Ephraim (<strong>2005</strong> only).<br />
Spatial sampling across the length of the beach was conducted at the same beaches, and there<br />
was no difference in site location among left, middle, and right samples at any of the beaches<br />
except for Sister Bay (Figure 9). These results imply that the source of E. coli does not originate<br />
from one side of the beach versus another. These results may be an indication of how well the<br />
beach water mixes.<br />
46
Figure 8: Depth Sampling of E. coli - <strong>Door</strong> <strong>County</strong>, WI, <strong>2005</strong>.<br />
Figure 9: Comparison of E. coli counts at center, left, and right at 5 subject beaches in<br />
<strong>2005</strong>.<br />
Error bars indicate + 1 S.E. of the mean.<br />
Log10 Mean E.coli MPN/100mL<br />
Log10 Mean E.coli MPN/100mL<br />
3.0<br />
2.5<br />
2.0<br />
1.5<br />
1.0<br />
0.5<br />
0.0<br />
3.0<br />
2.5<br />
2.0<br />
1.5<br />
1.0<br />
0.5<br />
0.0<br />
Anclam Bailey's<br />
Harbor<br />
Ridges<br />
Anclam Bailey's<br />
Harbor<br />
Ridges<br />
Ellison<br />
bay<br />
Ellison<br />
bay<br />
Ephraim Fish<br />
Creek<br />
Ephraim Fish<br />
Creek<br />
Lakeside Murphy Nicolet Otumba Sister Bay Sunset Whitefish<br />
Dunes<br />
Beach<br />
47<br />
cm 30<br />
cm 60<br />
cm 120<br />
Lakeside Murphy Nicolet Otumba Sister Bay Sunset Whitefish<br />
Dunes<br />
Beach<br />
Left<br />
Center<br />
Right
Rainfall Quantity Methodology<br />
Three rainfall locations were selected for analysis for this interim report: Sturgeon Bay, Sister<br />
Bay, and Egg Harbor. In <strong>2005</strong> rainfall countywide was also compared to E. coli levels collected<br />
from beach monitoring water samples.<br />
Rainfall Quantity Results<br />
There was no significant difference between rainfalls at each location according to a paired<br />
samples t-test. All three of these locations had similar rainfall daily totals and were highly<br />
correlated with one another. Although this reveals that rainfall was not driving the high E. coli<br />
counts for the county as a whole, it is a driving force at individual beaches. E. coli counts at<br />
beaches and associated storm water outfalls were correlated, and outfalls are affected by rain<br />
events. Therefore, rainfall likely has an effect on the beaches directly affected by storm water<br />
outfalls.<br />
Mean rainfall for each of the three locations was calculated and graphed with mean E. coli count<br />
for all of the monitored beaches (Figures 10 & 11). There tends to be an increase in E. coli when<br />
it rains, but there are also increases in E. coli when there is no rain. This indicates that rain is<br />
one, but not the only, driving factor in high E. coli levels.<br />
Figure 10: Rainfall at three monitoring stations compared to mean E. coli count<br />
(log10) at <strong>Door</strong> <strong>County</strong> Beaches in 2004.<br />
Samples from all of the monitored <strong>Door</strong> <strong>County</strong> beaches and also mean rainfall for the<br />
three rain stations was combined.<br />
Mean rainfall (cm) / Log E. coli(/100CFU)<br />
5<br />
4<br />
3<br />
2<br />
1<br />
0<br />
08/11/04<br />
08/09/04<br />
08/05/04<br />
08/03/04<br />
07/31/04<br />
07/29/04<br />
07/27/04<br />
07/23/04<br />
07/21/04<br />
07/19/04<br />
07/15/04<br />
07/13/04<br />
07/08/04<br />
07/06/04<br />
07/02/04<br />
06/30/04<br />
06/28/04<br />
06/24/04<br />
06/22/04<br />
06/18/04<br />
06/16/04<br />
06/14/04<br />
06/12/04<br />
06/10/04<br />
06/08/04<br />
06/04/04<br />
06/02/04<br />
05/31/04<br />
date<br />
48<br />
08/19/04<br />
08/17/04<br />
08/15/04<br />
08/13/04<br />
Sturgeon Bay rain<br />
Egg Harbor rain<br />
Sister Bay rain<br />
mean rain<br />
Log E. coli
Figure 11: Rainfall at three monitoring stations compared to mean E. coli count<br />
(log10) at <strong>Door</strong> <strong>County</strong> Beaches in <strong>2005</strong>.<br />
Samples from all of the monitored <strong>Door</strong> <strong>County</strong> beaches and also mean rainfall for the<br />
three rain stations was combined.<br />
E.coli MPN/100mL<br />
600<br />
550<br />
500<br />
450<br />
400<br />
350<br />
300<br />
250<br />
200<br />
150<br />
100<br />
50<br />
0<br />
-50<br />
-100<br />
-150<br />
-200<br />
-250<br />
-300<br />
-350<br />
-400<br />
5/31/<strong>2005</strong><br />
6/3/<strong>2005</strong><br />
6/6/<strong>2005</strong><br />
6/9/<strong>2005</strong><br />
6/12/<strong>2005</strong><br />
6/15/<strong>2005</strong><br />
6/18/<strong>2005</strong><br />
49<br />
6/21/<strong>2005</strong><br />
6/24/<strong>2005</strong><br />
6/27/<strong>2005</strong><br />
6/30/<strong>2005</strong><br />
7/3/<strong>2005</strong><br />
7/6/<strong>2005</strong><br />
7/9/<strong>2005</strong><br />
7/12/<strong>2005</strong><br />
7/15/<strong>2005</strong><br />
7/18/<strong>2005</strong><br />
7/21/<strong>2005</strong><br />
7/24/<strong>2005</strong><br />
7/27/<strong>2005</strong><br />
7/30/<strong>2005</strong><br />
8/2/<strong>2005</strong><br />
8/5/<strong>2005</strong><br />
8/8/<strong>2005</strong><br />
8/11/<strong>2005</strong><br />
8/14/<strong>2005</strong><br />
8/17/<strong>2005</strong><br />
8/20/<strong>2005</strong><br />
8/23/<strong>2005</strong><br />
8/26/<strong>2005</strong><br />
8/29/<strong>2005</strong><br />
Date<br />
E.coli Sturgeon Bay Rain Egg Harbor Rain Sister Bay Rain<br />
Rainfall conditions 24, 48, and 72 hours before beach monitoring E. coli levels to determine if<br />
there was a delayed affect of rain on beach water quality. Correlations between E. coli levels<br />
and rainfall that occurred 24, 48, and/or 72 hours prior to the high E. coli sample may indicate<br />
that the rainfall has a direct effect and impact on E. coli levels that results in beach advisory E.<br />
coli levels.<br />
At Egg Harbor, Ephraim, and Fish Creek beaches there was a correlation between high E. coli<br />
MPN/100mL of water and rainfall that occurred 24, 48, and 72 hours prior to the high E. coli<br />
sample (Table 2). At Ellison Bay, Sister Bay, Otumba Park, and Sunset Park beaches there was<br />
no correlation between high E. coli MPN/100mL of water and rainfall that occurred 24, 48, and<br />
72 hours prior to the high E. coli sample. At Murphy Park beach there was a correlation between<br />
high E. coli MPN/100mL of water and rainfall that occurred 24 hours prior to the high E. coli<br />
sample. At Nicolet Bay beach there was a correlation between high E. coli MPN/100mL of<br />
water and rainfall that occurred 24 hours prior to the high E. coli sample.<br />
4<br />
3.8<br />
3.6<br />
3.4<br />
3.2<br />
3<br />
2.8<br />
2.6<br />
2.4<br />
2.2<br />
2<br />
1.8<br />
1.6<br />
1.4<br />
1.2<br />
1<br />
0.8<br />
0.6<br />
0.4<br />
0.2<br />
0<br />
Rainfall (in.)
Table 2: Significant Correlations E. coli MPN vs. 24hrs PPT <strong>2005</strong>.<br />
Beach<br />
Rainfall<br />
Hours Prior<br />
to High E.<br />
coli<br />
Sample Correlation Coefficient P-Value<br />
Egg Harbor 24 0.459 0.000<br />
48 0.431 0.001<br />
72 0.35 0.008<br />
Ellison Bay 24 0.036 0.791<br />
48 -0.003 0.98<br />
72 -0.043 0.752<br />
Ephraim 24 0.671 0.000<br />
48 0.425 0.001<br />
72 0.433 0.001<br />
Fish Creek 24 0.559 0.000<br />
48 0.588 0.000<br />
72 0.498 0.000<br />
Murphy 24 0.299 0.024<br />
48 0.182 0.175<br />
72 0.12 0.374<br />
Nicolet 24 0.395 0.003<br />
48 0.235 0.085<br />
72 0.177 0.197<br />
Sister Bay 24 -0.04 0.769<br />
48 -0.058 0.668<br />
72 -0.089 0.509<br />
Otumba 24 0.105 0.436<br />
48 0.209 0.119<br />
72 0.142 0.291<br />
Sunset 24 0.175 0.188<br />
48 0.235 0.076<br />
72 0.168 0.207<br />
P-value, Alpha les than .05 = significant correlation<br />
Rain Event Beach Water Sampling Methodology<br />
E. coli concentrations were measured at Whitefish Dunes, Otumba Park , Fish Creek, Ephraim,<br />
Sister Bay, Lakeside, Murphy, Egg Harbor, Anclam, Sunset, and Baileys Harbor Ridges beaches<br />
hourly for 4 hours, and at 8, 12, and 24 hours after various rainfall events of at least .25 inches of<br />
rain within 24 hours.<br />
Rain Event Beach Water Sampling Results<br />
Overall E. coli concentrations were elevated beyond the advisory levels at most sampled beaches<br />
and beyond the closure level at some sampled beaches within 24 hours of rainfall events of at<br />
least 0.25 inches (Figures 12-22).<br />
50
Figure 12: Rain Event E. coli MPN/100mL of water Anclam beach <strong>2005</strong>.<br />
E. coli MPN<br />
6400<br />
6200<br />
6000<br />
5800<br />
5600<br />
5400<br />
5200<br />
5000<br />
4800<br />
4600<br />
4400<br />
4200<br />
4000<br />
3800<br />
3600<br />
3400<br />
3200<br />
3000<br />
2800<br />
2600<br />
2400<br />
2200<br />
2000<br />
1800<br />
1600<br />
1400<br />
1200<br />
1000<br />
800<br />
600<br />
400<br />
200<br />
0<br />
1 2 3 4 5 6 7 8 9 10 11 12 13 14 15 16 17 18 19 20 21 22 23 24<br />
Sample Hour<br />
51<br />
6/7/<strong>2005</strong><br />
7/25/<strong>2005</strong><br />
8/8/<strong>2005</strong><br />
8/10/<strong>2005</strong><br />
Figure 13: Rain Event E. coli MPN/100mL of water Baileys Harbor Ridges beach <strong>2005</strong>.<br />
E. coli MPN<br />
6400<br />
6200<br />
6000<br />
5800<br />
5600<br />
5400<br />
5200<br />
5000<br />
4800<br />
4600<br />
4400<br />
4200<br />
4000<br />
3800<br />
3600<br />
3400<br />
3200<br />
3000<br />
2800<br />
2600<br />
2400<br />
2200<br />
2000<br />
1800<br />
1600<br />
1400<br />
1200<br />
1000<br />
800<br />
600<br />
400<br />
200<br />
0<br />
1 2 3 4 5 6 7 8 9 10 11 12 13 14 15 16 17 18 19 20 21 22 23 24<br />
Sample Hour<br />
6/7/<strong>2005</strong><br />
7/25/<strong>2005</strong><br />
8/8/<strong>2005</strong><br />
8/10/<strong>2005</strong>
Figure 14: Rain Event E. coli MPN/100mL of water Egg Harbor beach <strong>2005</strong>.<br />
E. coli MPN<br />
6400<br />
6200<br />
6000<br />
5800<br />
5600<br />
5400<br />
5200<br />
5000<br />
4800<br />
4600<br />
4400<br />
4200<br />
4000<br />
3800<br />
3600<br />
3400<br />
3200<br />
3000<br />
2800<br />
2600<br />
2400<br />
2200<br />
2000<br />
1800<br />
1600<br />
1400<br />
1200<br />
1000<br />
800<br />
600<br />
400<br />
200<br />
0<br />
1 2 3 4 5 6 7 8 9 10 11 12 13 14 15 16 17 18 19 20 21 22 23 24<br />
Sample Hour<br />
Figure 15: Rain Event E. coli MPN/100mL of water Ephraim beach <strong>2005</strong>.<br />
E. coli MPN<br />
6400<br />
6200<br />
6000<br />
5800<br />
5600<br />
5400<br />
5200<br />
5000<br />
4800<br />
4600<br />
4400<br />
4200<br />
4000<br />
3800<br />
3600<br />
3400<br />
3200<br />
3000<br />
2800<br />
2600<br />
2400<br />
2200<br />
2000<br />
1800<br />
1600<br />
1400<br />
1200<br />
1000<br />
800<br />
600<br />
400<br />
200<br />
0<br />
1 2 3 4 5 6 7 8 9 10 11 12 13 14 15 16 17 18 19 20 21 22 23 24<br />
Sample Hour<br />
52<br />
7/25/<strong>2005</strong><br />
8/10/<strong>2005</strong><br />
8/26/<strong>2005</strong><br />
6/21/2004<br />
8/18/2004<br />
6/7/<strong>2005</strong><br />
8/8/<strong>2005</strong>
Figure 16: Rain Event E. coli MPN/100mL of water Fish Creek beach <strong>2005</strong>.<br />
E. coli MPN<br />
6400<br />
6200<br />
6000<br />
5800<br />
5600<br />
5400<br />
5200<br />
5000<br />
4800<br />
4600<br />
4400<br />
4200<br />
4000<br />
3800<br />
3600<br />
3400<br />
3200<br />
3000<br />
2800<br />
2600<br />
2400<br />
2200<br />
2000<br />
1800<br />
1600<br />
1400<br />
1200<br />
1000<br />
800<br />
600<br />
400<br />
200<br />
0<br />
1 2 3 4 5 6 7 8 9 10 11 12 13 14 15 16 17 18 19 20 21 22 23 24<br />
Sample Hours<br />
Figure 17: Rain Event E. coli MPN/100mL of water Lakeside Park beach <strong>2005</strong>.<br />
E. coli MPN<br />
25000<br />
24500<br />
24000<br />
23500<br />
23000<br />
22500<br />
22000<br />
21500<br />
21000<br />
20500<br />
20000<br />
19500<br />
19000<br />
18500<br />
18000<br />
17500<br />
17000<br />
16500<br />
16000<br />
15500<br />
15000<br />
14500<br />
14000<br />
13500<br />
13000<br />
12500<br />
12000<br />
11500<br />
11000<br />
10500<br />
10000<br />
9500<br />
9000<br />
8500<br />
8000<br />
7500<br />
7000<br />
6500<br />
6000<br />
5500<br />
5000<br />
4500<br />
4000<br />
3500<br />
3000<br />
2500<br />
2000<br />
1500<br />
1000<br />
500<br />
0<br />
1 2 3 4 5 6 7 8 9 10 11 12 13 14 15 16 17 18 19 20 21 22 23 24<br />
Sample Hours<br />
53<br />
8/18/2004<br />
6/7/<strong>2005</strong><br />
5/31/2004<br />
8/9/2004<br />
6/7/<strong>2005</strong><br />
7/25/<strong>2005</strong><br />
8/8/<strong>2005</strong><br />
8/10/<strong>2005</strong>
Figure 18: Rain Event E. coli MPN/100mL of water Murphy Park beach <strong>2005</strong>.<br />
E. coli MPN<br />
6400<br />
6200<br />
6000<br />
5800<br />
5600<br />
5400<br />
5200<br />
5000<br />
4800<br />
4600<br />
4400<br />
4200<br />
4000<br />
3800<br />
3600<br />
3400<br />
3200<br />
3000<br />
2800<br />
2600<br />
2400<br />
2200<br />
2000<br />
1800<br />
1600<br />
1400<br />
1200<br />
1000<br />
800<br />
600<br />
400<br />
200<br />
0<br />
1 2 3 4 5 6 7 8 9 10 11 12 13 14 15 16 17 18 19 20 21 22 23 24<br />
Sample Hours<br />
Figure 19: Rain Event E. coli MPN/100mL of water Otumba Park beach <strong>2005</strong>.<br />
E. coli MPN<br />
6400<br />
6200<br />
6000<br />
5800<br />
5600<br />
5400<br />
5200<br />
5000<br />
4800<br />
4600<br />
4400<br />
4200<br />
4000<br />
3800<br />
3600<br />
3400<br />
3200<br />
3000<br />
2800<br />
2600<br />
2400<br />
2200<br />
2000<br />
1800<br />
1600<br />
1400<br />
1200<br />
1000<br />
800<br />
600<br />
400<br />
200<br />
0<br />
54<br />
7/25/<strong>2005</strong><br />
8/10/<strong>2005</strong><br />
8/26/<strong>2005</strong><br />
1 2 3 4 5 6 7 8 9 10 11 12 13 14 15 16 17 18 19 20 21 22 23 24<br />
6/12/2004 6/17/2004 7/4/2004 7/4/2004<br />
Hours<br />
7/6/2004 7/21/2004 8/24/2004 8/10/<strong>2005</strong> 8/26/<strong>2005</strong>
Figure 20: Rain Event E. coli MPN/100mL of water Sister Bay beach <strong>2005</strong>.<br />
E. coli MPN<br />
6400<br />
6200<br />
6000<br />
5800<br />
5600<br />
5400<br />
5200<br />
5000<br />
4800<br />
4600<br />
4400<br />
4200<br />
4000<br />
3800<br />
3600<br />
3400<br />
3200<br />
3000<br />
2800<br />
2600<br />
2400<br />
2200<br />
2000<br />
1800<br />
1600<br />
1400<br />
1200<br />
1000<br />
800<br />
600<br />
400<br />
200<br />
0<br />
1 2 3 4 5 6 7 8 9 10 11 12 13 14 15 16 17 18 19 20 21 22 23 24<br />
Sample Hours<br />
Figure 21: Rain Event E. coli MPN/100mL of water Sunset Park beach <strong>2005</strong>.<br />
E. coli MPN<br />
6400<br />
6200<br />
6000<br />
5800<br />
5600<br />
5400<br />
5200<br />
5000<br />
4800<br />
4600<br />
4400<br />
4200<br />
4000<br />
3800<br />
3600<br />
3400<br />
3200<br />
3000<br />
2800<br />
2600<br />
2400<br />
2200<br />
2000<br />
1800<br />
1600<br />
1400<br />
1200<br />
1000<br />
800<br />
600<br />
400<br />
200<br />
0<br />
1 2 3 4 5 6 7 8 9 10 11 12 13 14 15 16 17 18 19 20 21 22 23 24<br />
Sample Hours<br />
55<br />
6/21/2004<br />
8/8/<strong>2005</strong><br />
6/12/2004<br />
6/17/2004<br />
7/4/2004<br />
7/6/2004<br />
7/21/2004<br />
8/10/<strong>2005</strong><br />
8/26/<strong>2005</strong>
Figure 22: Rain Event E. coli MPN/100mL of water Whitefish Dunes beach <strong>2005</strong>.<br />
E. coli MPN<br />
6400<br />
6200<br />
6000<br />
5800<br />
5600<br />
5400<br />
5200<br />
5000<br />
4800<br />
4600<br />
4400<br />
4200<br />
4000<br />
3800<br />
3600<br />
3400<br />
3200<br />
3000<br />
2800<br />
2600<br />
2400<br />
2200<br />
2000<br />
1800<br />
1600<br />
1400<br />
1200<br />
1000<br />
800<br />
600<br />
400<br />
200<br />
0<br />
1 2 3 4 5 6 7 8 9 10 11 12 13 14 15 16 17 18 19 20 21 22 23 24<br />
Sample Hours<br />
56<br />
5/31/2004<br />
6/7/<strong>2005</strong><br />
8/10/<strong>2005</strong><br />
The <strong>Door</strong> <strong>County</strong> Public Health Department will be requiring several beaches in <strong>Door</strong> <strong>County</strong> to<br />
post beach swimming advisory signs on the beach after .25 inches of rain has fallen within 24<br />
hours. The “Wet Weather Beach Swimming Advisories” are required when a beach has either<br />
of the following E. coli counts recorded during rainfall beach water monitoring events by the<br />
<strong>Door</strong> <strong>County</strong> Soil and Water Conservation Department.<br />
1. A minimum of 100% of the rain event beach water samples for E. coli exceed the closure<br />
level (1,000 MPN/100mL of water) during more than 1 sampled rain event, OR<br />
2. A minimum of 80% of the rain event beach water samples for E. coli exceed the advisory E.<br />
coli level of 235 MPN/100mL of water in a minimum of 3 sampled rain events.<br />
Wet Weather Beach Swimming Advisories will be required by the <strong>Door</strong> <strong>County</strong> Public Health<br />
Department for Fish Creek beach, Murphy <strong>County</strong> Park, Anclam Park, Ephraim beach, Lakeside<br />
Park, Sunset Park (Sturgeon Bay), and Otumba Park (Table 3). Swimming advisories will be<br />
required at these beaches in 2006 because all of these beaches had either a minimum of 100% of<br />
the rain event beach water samples for E. coli exceed the closure level (1,000MPN/100mL of<br />
water) during more than 1 sampled rain event, OR a minimum of 80% of the rain event beach<br />
water samples for E. coli exceed the advisory E. coli level of 235MPN/100mL of water in a<br />
minimum of 3 sampled rain events. The specifications for posting a Wet Weather Beach<br />
Swimming Advisory will be given to beach managers by mid May 2006 for the 2006 swimming<br />
season.<br />
Egg Harbor, Sister Bay, and Whitefish Dunes State Park beaches will not be required to post<br />
swimming advisory signs after rain events because they did not meet the minimum criteria<br />
(Table 3). However, all three beaches have had E. coli levels exceed the advisory or closure<br />
level during rain event sampling so posting swimming advisories for 24 hours after ¼ of rain<br />
within 24 hours is encouraged.
Table 3: Wet Weather Beach Swimming Advisories Determination<br />
% E. coli<br />
above<br />
advisory<br />
% E. coli<br />
above<br />
closure<br />
57<br />
Required Wet<br />
Weather Beach<br />
Swimming Advisory<br />
Beach<br />
# of sampled<br />
rain events<br />
Sister Bay 2 100% 50% Not required at this time yes<br />
Fish Creek 2 100% 100% Required yes<br />
Egg Harbor 3 66% 33% Not required at this time yes<br />
Murphy Park<br />
Whitefish<br />
3 100% 67% Required yes<br />
Dunes 3 30% 0% Not required at this time yes<br />
Anclam Park 4 100% 75% Required yes<br />
Ephraim<br />
Baileys Harbor<br />
4 100% 100% Required yes<br />
Ridges 4 50% 25% Not required at this time yes<br />
Lakeside Park 6 83% 67% Required yes<br />
Sunset Park 7 86% 29% Required yes<br />
Otumba Park<br />
E. coli Levels:<br />
8 100% 50% Required yes<br />
Advisory = 235 MPN/100mL of<br />
water<br />
Closure = 1,000 MPN/100mL of water<br />
Recommend<br />
further rain event<br />
sampling<br />
The rain event results indicate that the presence of a storm water outfall and/or a stream outlet in<br />
close proximity to a beach may cause a significant increase in E. coli concentrations. Impervious<br />
runoff areas can also be considered part of water delivery systems to the beach. For example<br />
areas of curbed streets that drain storm water to a parking lot and or boat launch near the beach<br />
or bay. See Appendix A for E. coli testing methodology and results for storm water pipes and<br />
catch basins, and streams near Otumba Park beach in Sturgeon Bay and Ephraim Beach.<br />
Wind Methodology<br />
In 2004 comparison among beaches indicated that wind direction influenced E. coli counts at<br />
beaches on the Green Bay side of the peninsula. Specifically, counts were lower during an<br />
offshore wind (p
Table 4: Mean E. coli in beach water on the Green Bay side of <strong>Door</strong> <strong>County</strong> in various<br />
wind conditions in 2004.<br />
BAY N Subset for alpha=0.05<br />
offshore 101 1.1184<br />
1 2<br />
barrier 51 1.4069<br />
alongshore 54 1.4324<br />
onshore 167 1.5196<br />
Significance 1.000 0.648<br />
In <strong>2005</strong> comparisons were made between beaches to determine if there were correlations<br />
between E. coli levels and wind at individual beaches. Significant correlations were found<br />
between wind and high E. coli levels at Sunset Park (Sturgeon Bay), Europe Bay Town Park<br />
Sample site #1, Sturgeon Bay Recreational Canal Area, Otumba Park, Ellison Bay, Egg Harbor,<br />
Ephraim, Nicolet, Sister Bay, and Portage Park (Table 5). The E. coli levels at each of these<br />
beaches reacted differently to various wind directions and types. Wind directions were classified<br />
into wind types at each beach based on if the wind was an onshore, offshore, long shore and<br />
barrier (wind block).<br />
The beaches listed in Table 5 have a significant (alpha=0.05) differences in E. coli<br />
concentrations with respect to wind direction based in a T-Test. No analysis for Gialison,<br />
Jackson Harbor, Schoolhouse, Sand Dune, Rock Island, and Percy Johnson due to insufficient<br />
data. If a beach is not listed, there was no significant difference in E. coli with respect to wind<br />
direction. In the “Difference Found” column the statements mean that the wind direction listed<br />
has a statistically significant relationship with elevated E. coli.<br />
58
Table 5: T-Test Correlation between <strong>Door</strong> <strong>County</strong> Beach Water Samples E. coli<br />
MPN/100mL of water and Wind Direction/Type<br />
Beach Difference Found p value<br />
Sunset N-S greater than NE-E-SE 0.030<br />
Wind Type Barrier > offshore<br />
Europe 1 NE-E-SE greater than SW-W-N 0.011<br />
Wind Type Onshore > long/offshore<br />
Sturgeon Bay Rec. Canal NE-SW greater than E-SE-S 0.050<br />
Wind Type Long shore > onshore<br />
Otumba E greater than N-NE-NW 0.002<br />
E greater than W 0.026<br />
Wind Type Long shore> onshore/barrier<br />
Ellison E-W-NW greater than S-SW 0.050<br />
Wind Type Barrier > onshore<br />
Egg Harbor N-SW greater than E-S 0.035<br />
NE-E-NW greater than E-S 0.009<br />
NE-E-NW greater than N-SW 0.001<br />
Wind Type<br />
Ephraim N-W-NW greater than E-SE-S 0.006<br />
NE-SW greater than E-SE-S 0.006<br />
Wind Type Long/onshore > offshore<br />
Nicolet N-NE-E greater than S-SW-W 0.002<br />
Wind Type Onshore > offshore<br />
Sister Bay N-W-NW greater than E-SE-S-SW 0.008<br />
Wind Type Onshore > offshore<br />
Portage N-S greater than SW-W-NW 0.024<br />
N-S greater than NE-E-S 0.050<br />
Wind Type Long shore > onshore/offshore<br />
Wave Height Methodology<br />
In 2004 and <strong>2005</strong> wave height was measured by the samplers monitoring beaches for E. coli and<br />
in 2004 by the NOAA-operated buoy located in Lake Michigan near the northeastern tip of the<br />
<strong>Door</strong> <strong>County</strong> peninsula.<br />
Wave Height Results<br />
In 2004 wave height was positively correlated with E. coli counts at all beaches (R=0.234,<br />
p
Table 6: Correlation between Wave Height and E. coli Levels in <strong>2005</strong><br />
Beach<br />
Correlation<br />
Coefficient<br />
P-<br />
Value<br />
Baileys Harbor<br />
Ridges 0.26 0.051<br />
Newport State Park 0.343 0.01<br />
Portage Park 0.381 0.029<br />
Egg Harbor 0.575 0.000<br />
Fish Creek 0.638 0.000<br />
Sunset (Sturgeon<br />
Bay) 0.278 0.034<br />
Gialison Beach 0.621 0.018<br />
Rock Island 0.694 0.006<br />
E. coli Concentrations in Beach Sand<br />
Sand Sampling Methodology<br />
Beach sands were sampled above the swash zone, in the swash zone and in 6 and 12 inches in<br />
water to determine E. coli levels. Three replicate samples were taken in each sample location.<br />
Sunset (Sturgeon Bay), Otumba, Baileys Harbor Ridges, Ephraim, Fish Creek, and Whitefish<br />
Dunes beach sands were sampled weekly in <strong>2005</strong>. Anclam, Lakeside, Murphy, Nicolet, Ellison<br />
Bay, Sister Bay and beach sands were sampled once in June and once in August in <strong>2005</strong>.<br />
Sand Sampling Results<br />
Preliminary results indicate that levels of E. coli in the sand are relatively low. The following<br />
beaches had at least one sand sample in which the E. coli levels were above the beach water<br />
monitoring advisory level (235MPN/100mL): Sunset, Baileys Harbor Ridges, Otumba, Fish<br />
Creek, Ephraim, Whitefish Dunes, Lakeside and Murphy beaches (Figures 23-34). The E. coli<br />
levels in sand samples taken from Anclam, Nicolet, Ellison Bay and Sister Bay beaches were all<br />
below the beach water monitoring advisory level (235MPN/100mL). Additional work is being<br />
done in 2006 to determine the source of E. coli in sand.<br />
Figure 23: Sunset Park Sand E. coli Levels vs. Water E. coli Levels <strong>2005</strong>.<br />
E.coli CFU/g<br />
1000<br />
900<br />
800<br />
700<br />
600<br />
500<br />
400<br />
300<br />
200<br />
100<br />
0<br />
Week 1<br />
Week 2<br />
Week 3<br />
Week 4<br />
Week 5<br />
Week 6<br />
Week 7<br />
Week 8<br />
Week 9<br />
Week 10<br />
Week 11<br />
Week 12<br />
Time<br />
Upshore Swash Wet MPN<br />
60<br />
2000<br />
1800<br />
1600<br />
1400<br />
1200<br />
1000<br />
800<br />
600<br />
400<br />
200<br />
0<br />
E.coli MPN/100mL
Figure 24: Baileys Harbor Sand E. coli Levels vs. Water E. coli Levels <strong>2005</strong>.<br />
E.coli CFU/g<br />
1000<br />
900<br />
800<br />
700<br />
600<br />
500<br />
400<br />
300<br />
200<br />
100<br />
0<br />
Week 1<br />
Week 2<br />
Week 3<br />
Week 4<br />
Week 6<br />
Week 7<br />
Week 8<br />
Week 9<br />
Week 10<br />
Week 11<br />
Week 12<br />
Figure 25: Otumba Park Sand E. coli Levels vs. Water E. coli Levels <strong>2005</strong>.<br />
E.coli CFU/g<br />
Time<br />
Figure 26: Fish Creek Beach Sand E. coli Levels vs. Water E. coli Levels <strong>2005</strong>.<br />
E.coli CFU/g<br />
1000<br />
900<br />
800<br />
700<br />
600<br />
500<br />
400<br />
300<br />
200<br />
100<br />
0<br />
1000<br />
900<br />
800<br />
700<br />
600<br />
500<br />
400<br />
300<br />
200<br />
100<br />
0<br />
Week 1<br />
Week 2<br />
Week 1<br />
Week 2<br />
Upshore Swash Wet MPN/100mL<br />
Week 3<br />
Week 4<br />
Week 5<br />
Week 6<br />
Week 7<br />
Time<br />
Week 8<br />
Week 9<br />
Week 10<br />
Week 11<br />
Week 12<br />
Upshore Swash Wet MPN/100mL<br />
Week 3<br />
Week 4<br />
Week 5<br />
Week 6<br />
Week 7<br />
Time<br />
Week 8<br />
Week 9<br />
Week 10<br />
Week 11<br />
Week 12<br />
Upshore Swash Wet MPN/100mL<br />
61<br />
2000<br />
1800<br />
1600<br />
1400<br />
1200<br />
1000<br />
800<br />
600<br />
400<br />
200<br />
0<br />
2600<br />
2400<br />
2200<br />
2000<br />
1800<br />
1600<br />
1400<br />
1200<br />
1000<br />
800<br />
600<br />
400<br />
200<br />
0<br />
2000<br />
1800<br />
1600<br />
1400<br />
1200<br />
1000<br />
800<br />
600<br />
400<br />
200<br />
0<br />
E.coli MPN/100mL<br />
E.coli MPN/100mL<br />
E.coli MPN/100mL
Figure 27: Ephraim Beach Sand E. coli Levels vs. Water E. coli Levels <strong>2005</strong>.<br />
E.coli CFU/g<br />
1000<br />
900<br />
800<br />
700<br />
600<br />
500<br />
400<br />
300<br />
200<br />
100<br />
0<br />
Week 1<br />
Week 2<br />
Week 3<br />
Week 4<br />
Week 5<br />
Week 6<br />
Week 7<br />
Time<br />
Week 8<br />
Week 9<br />
Week 10<br />
Week 11<br />
Week 12<br />
Upshore Swash Wet MPN/100mL<br />
Figure 28: Whitefish Dunes State Park Sand E. coli Levels vs. Water E. coli Levels <strong>2005</strong>.<br />
1000<br />
900<br />
800<br />
700<br />
600<br />
500<br />
400<br />
300<br />
200<br />
100<br />
0<br />
Week 1<br />
Week 2<br />
Week 3<br />
Week 4<br />
Week 5<br />
Week 6<br />
Week 7<br />
Week 8<br />
Week 9<br />
Week 10<br />
Week 11<br />
Week 12<br />
Figure 29: Anclam Park Sand E. coli Levels vs. Water E. coli Levels <strong>2005</strong>.<br />
CFU/g<br />
E.coli CFU/g<br />
1000<br />
950<br />
900<br />
850<br />
800<br />
750<br />
700<br />
650<br />
600<br />
550<br />
500<br />
450<br />
400<br />
350<br />
300<br />
250<br />
200<br />
150<br />
100<br />
50<br />
0<br />
June<br />
upshore<br />
August<br />
upshore<br />
Time<br />
Upshore Swash Wet MPN/100mL<br />
June swash August<br />
swash<br />
Sand Sample Locations<br />
2000<br />
1800<br />
1600<br />
1400<br />
1200<br />
1000<br />
800<br />
600<br />
400<br />
200<br />
0<br />
E.coli MPN/100mL<br />
62<br />
2000<br />
1800<br />
1600<br />
1400<br />
1200<br />
1000<br />
800<br />
600<br />
400<br />
200<br />
0<br />
E.coli MPN/100mL<br />
June wet August wet June<br />
special<br />
E.coli CFU/g E.coli MPN/100mL June E.coli MPN/100mL August<br />
25<br />
20<br />
15<br />
10<br />
5<br />
0<br />
E.coli MPN/100mL
Figure 30: Lakeside Park Sand E. coli Levels vs. Water E. coli Levels <strong>2005</strong>.<br />
CFU/g<br />
Figure 31: Murphy Park Sand E. coli Levels vs. Water E. coli Levels <strong>2005</strong>.<br />
CFU/g<br />
1000<br />
950<br />
900<br />
850<br />
800<br />
750<br />
700<br />
650<br />
600<br />
550<br />
500<br />
450<br />
400<br />
350<br />
300<br />
250<br />
200<br />
150<br />
100<br />
50<br />
0<br />
June upshore August<br />
upshore<br />
June swash August<br />
swash<br />
Sand Sample Locations<br />
Figure 32: Nicolet Bay Beach Sand E. coli Levels vs. Water E. coli Levels <strong>2005</strong>.<br />
CFU/g<br />
1000<br />
950<br />
900<br />
850<br />
800<br />
750<br />
700<br />
650<br />
600<br />
550<br />
500<br />
450<br />
400<br />
350<br />
300<br />
250<br />
200<br />
150<br />
100<br />
50<br />
0<br />
1000<br />
950<br />
900<br />
850<br />
800<br />
750<br />
700<br />
650<br />
600<br />
550<br />
500<br />
450<br />
400<br />
350<br />
300<br />
250<br />
200<br />
150<br />
100<br />
50<br />
0<br />
June upshore August<br />
upshore<br />
June upshore August<br />
upshore<br />
63<br />
June wet August wet<br />
E.coli CFU/g E.coli MPN/100mL June E.coli MPN/100mL August<br />
June swash August<br />
swash<br />
Sand Sample Locations<br />
E.coli CFU/g E.coli MPN/100mL June E.coli MPN/100mL August<br />
June swash August<br />
swash<br />
Sand Sample Locations<br />
June wet August wet<br />
E.coli CFU/g E.coli MPN/100mL June E.coli MPN/100mL August<br />
June wet August wet<br />
2600<br />
2400<br />
2200<br />
2000<br />
1800<br />
1600<br />
1400<br />
1200<br />
1000<br />
800<br />
600<br />
400<br />
200<br />
0<br />
350<br />
300<br />
250<br />
200<br />
150<br />
100<br />
50<br />
0<br />
40<br />
30<br />
20<br />
10<br />
0<br />
MPN/100mL<br />
MPN/100mL<br />
MPN/100mL
Figure 33: Ellison Bay Beach Sand E. coli Levels vs. Water E. coli Levels <strong>2005</strong>.<br />
CFU/g<br />
Figure 34: Sister Bay Park Sand E. coli Levels vs. Water E. coli Levels <strong>2005</strong>.<br />
CFU/g<br />
1000<br />
950<br />
900<br />
850<br />
800<br />
750<br />
700<br />
650<br />
600<br />
550<br />
500<br />
450<br />
400<br />
350<br />
300<br />
250<br />
200<br />
150<br />
100<br />
50<br />
0<br />
1000<br />
950<br />
900<br />
850<br />
800<br />
750<br />
700<br />
650<br />
600<br />
550<br />
500<br />
450<br />
400<br />
350<br />
300<br />
250<br />
200<br />
150<br />
100<br />
50<br />
0<br />
June upshore August<br />
upshore<br />
June upshore August<br />
upshore<br />
June swash August<br />
swash<br />
Sand Sample Locations<br />
E.coli CFU/g E.coli MPN/100mL June E.coli MPN/100mL August<br />
June swash August<br />
swash<br />
Sand Sample Locations<br />
E.coli CFU/g E.coli MPN/100mL June E.coli MPN/100mL August<br />
Impact of Biological Factors<br />
Biological factors were examined for their effect on E. coli concentrations at all monitored<br />
beaches including the number of gulls, amount of gull waste and algal mass present at the time of<br />
the water sampling.<br />
Bird Count Methodology<br />
The total number of birds was recorded at the time of water sampling for the beach monitoring<br />
program in 2004 and <strong>2005</strong>.<br />
Avian Waste Survey Methodology<br />
The avian waste survey determined the number and percentage of bird waste, dropping, at 12 of<br />
the beaches that were monitored for E. coli, including Whitefish Dunes, Fish Creek, Egg Harbor,<br />
Murphy Park, Sunset, Otumba, Sister Bay, Ephraim, Portage Park, Ellison Bay and Newport<br />
State Park. The survey was conducted to determine the potential for avian waste to be a source<br />
of E. coli contamination on the beach.<br />
64<br />
June wet August wet<br />
June wet August wet<br />
40<br />
30<br />
20<br />
10<br />
0<br />
40<br />
30<br />
20<br />
10<br />
0<br />
MPN/100mL<br />
MPN/100mL
Using the bird count method alone does not account for the birds that are present at the beach<br />
when the samplers are not there. Bird waste is a source of E. coli, so counting the waste is<br />
another way to determine the potential for the waste to be a significant source of E. coli at each<br />
of the surveyed beaches. In comparing the bird count and bird waste survey results there are<br />
different beaches that show up as having the largest bird populations, indicating that the<br />
combination of both surveys is needed to determine the most accurate populations.<br />
Avian waste was counted in nine 4’ X 4’ plots, 150 feet apart, in a transect area of 1/4 mile by 4’<br />
adjacent to the swash zone (shoreline). The avian waste counts where extrapolated to determine<br />
waste counts per transect area. Survey data does not represent the total amount of bird waste on<br />
the beach. The use of the same transect size allows the amount of avian waste to be compared<br />
between beaches (Figure 35).<br />
Figure 35: Example of Avian Waste Survey transect and sample plot areas in Otumba Park<br />
Beach<br />
Red Polygon represent the transect area and the green squares represent the sample plots.<br />
Bird Count and Avian Waste Survey Results<br />
Overall, gulls accounted for the majority of the birds at each beach. The influence of gull<br />
presence was quite pronounced at several beaches and was significantly correlated with E. coli<br />
counts in the water (R 2 =0.365). Correlation between numbers of gulls and E. coli counts are<br />
often difficult to find, although it is widely suspected that gulls are directly influencing bacterial<br />
counts (Figure 35). In 2004 Pearson Correlations show a correlation between avian waste<br />
amounts and E. coli at Ephraim and Newport beaches, indicating that as the amount of avian<br />
waste increased E. coli concentrations also increased (Table 7). There were strong correlations<br />
between bird count numbers and E. coli concentrations at Ellison Bay Otumba Park, and<br />
Whitefish Dunes State Park beaches, and a moderate correlation at Sister Bay beach, indicating<br />
that as the number of birds counted is related to E. coli concentrations.<br />
65
Beach<br />
In <strong>2005</strong> Pearson Correlations show no correlations between avian waste amounts and E. coli in<br />
beach water samples, indicating that as the amount of avian waste may have no effect on E. coli<br />
concentrations (Table 8). There were strong correlations between bird count numbers and E. coli<br />
concentrations at Egg Harbor beach, and a moderate correlation at Whitefish Dunes beach,<br />
indicating that as the number of birds counted is related to E. coli concentrations.<br />
Table 7: Pearson Correlation of Avian Waste, Bird Counts, and E. coli Levels in 2004.<br />
(Alpha 0.05)<br />
Avian Waste<br />
vs. Bird<br />
Counts<br />
Avian Waste<br />
vs. Bird<br />
Counts -<br />
p-value<br />
Avian<br />
Waste<br />
vs. E.<br />
coli<br />
Avian<br />
Waste vs.<br />
E. coli -<br />
p-value<br />
66<br />
Bird<br />
Count<br />
vs. E.<br />
coli<br />
Bird Count<br />
vs. E. coli<br />
- pvalue<br />
Notes<br />
Baileys<br />
Harbor 0.138 0.745 -0.365 0.374 -0.434 0.282 High bird levels.<br />
Egg Harbor -0.191 0.574 0.521 0.100 -0.149 0.662<br />
Ellison Bay 0.063 0.871 0.043 0.913 0.880 0.002<br />
Ephraim 0.563 0.090 -0.135 0.711 -0.117 0.748<br />
Fish Creek 0.000 1.000 -0.216 0.524 -0.057 0.868<br />
Newport 0.853 0.003 -0.166 0.670 -0.036 0.927<br />
Otumba 0.229 0.474 -0.184 0.567 0.695 0.012<br />
Sister Bay 0.103 0.778 -0.008 0.982 0.478 0.162<br />
Sunset<br />
Whitefish<br />
-0.255 0.424 0.505 0.094 -0.045 0.891<br />
Dunes 0.129 0.397 -0.172 0.259 0.345 0.02<br />
Avian Waste is total waste counted per 144 ft 2<br />
Good to Excellent Correlation<br />
Moderate Correlation<br />
Beach<br />
Higher goose<br />
levels.<br />
Table 8: Pearson Correlation of Avian Waste, Bird Counts, and E. coli Levels in <strong>2005</strong>.<br />
(Alpha 0.05)<br />
Avian Waste<br />
vs. Bird<br />
Counts<br />
Avian Waste<br />
vs. Bird<br />
Counts -<br />
p-value<br />
Avian<br />
Waste<br />
vs. E.<br />
coli<br />
Avian<br />
Waste vs.<br />
E. coli -<br />
p-value<br />
Bird<br />
Count<br />
vs. E.<br />
coli<br />
Higher goose and<br />
duck levels.<br />
Mostly Gull waste.<br />
High levels.<br />
Bird Count<br />
vs. E. coli<br />
- pvalue<br />
Mean Log E. coli<br />
Baileys<br />
Harbor 0.263 0.364 -0.025 0.933 -0.127 0.666 1.48<br />
Egg Harbor -0.216 0.459 -0.105 0.732 0.535 0.059 1.81<br />
Ellison Bay -0.248 0.392 -0.069 0.814 -0.257 0.376 1.77<br />
Ephraim 0.224 0.441 0.173 0.555 0.023 0.937 1.76<br />
Fish Creek -0.127 0.665 -0.126 0.668 -0.292 0.312 2.18<br />
Murphy -0.104 0.724 -0.135 0.659 -0.025 0.935 2.05<br />
Newport Na an an na 0.379 0.224 1.2<br />
Nicolet 0.081 0.783 0.056 0.856 -0.241 0.428 2.05<br />
Otumba -0.235 0.419 -0.217 0.477 0.133 0.665 2.17<br />
Portage 0.066 0.822 0.203 0.700 -0.654 0.159 2.34<br />
Sister Bay 0.289 0.317 -0.284 0.326 -0.180 0.538 1.62<br />
Sunset<br />
Whitefish<br />
-0.118 0.689 -0.174 0.571 -0.277 0.36 2.39<br />
Dunes 0.124 0.673 -0.170 0.579 0.590 0.034 2.13
Avian Waste is total waste counted per 144 ft 2<br />
Good to Excellent Correlation<br />
Moderate Correlation<br />
Algae Impact Study Methodology<br />
Cladophora is a natural alga that is native to Wisconsin. It grows attached to rocks on the lake<br />
bottom. When it detaches, either from wave action or die off it washes up onto beaches and<br />
decays (Figure 36). As Cladophora washes up on the beach it also brings a variety of other<br />
aquatic vegetation and zebra mussels that have detached from rocks and become entangled in the<br />
algae. On the beach the decaying algae provides shade and carbohydrates that may promote the<br />
growth of E. coli.<br />
Figure 36: Cladophora glomerata structure<br />
A Cladophora distribution survey was conducted at all 28 beaches monitored for E. coli in <strong>Door</strong><br />
<strong>County</strong>. The distribution was determined at the time of water sample collection for beach<br />
monitoring. The survey methods were developed by the Wisconsin Department of Natural<br />
Resources. The water samplers rated the amount of Cladophora at the beach based on the<br />
following scale:<br />
None Cladophora not present anywhere on the beach.<br />
Low Cladophora minimally present in patches on the beach.<br />
Moderate Cladophora noticeably present on the beach and a nuisance.<br />
67
High Cladophora covers beach in wind rows.<br />
Water samples for E. coli MPN/10mL of water were taken in <strong>2005</strong> in and around Cladophora<br />
mats at as a preliminary study to determine the amount of E. coli that is in and around the algae<br />
mats at the beach and the potential for E. coli to wash off the mats and result in elevated E. coli<br />
levels in beach water samples.<br />
Algae Impact Study Results<br />
There are many other species of aquatic plants that are typically in Cladophora mats. The<br />
quantity of these species was not determined. In Table 9 the general distribution of algae on the<br />
beaches is summarized by grouping the observations into two categories: none to low and<br />
moderate to high. The percentage of none to low algae group occurred more than 60% of the<br />
time at 10 beaches. The moderate to high group occurred at 13 beaches more than 60% of the<br />
time. At the remaining 5 beaches both groups occurred about equally. Overall this indicates that<br />
there is a potential for Cladophora mats to impact beach water at several beaches.<br />
Table 9: Cladophora Distribution Survey Percentages of Total Samples<br />
Beach none-low med-high<br />
Anclam 40 60<br />
Baileys 34 66<br />
Clark 100 0<br />
Egg 47 53<br />
Ellison 72 28<br />
Ephraim 32 68<br />
Europe1 25 75<br />
Europe2 36 64<br />
Europe3 44 56<br />
Europe Lake 79 21<br />
Fish Creek 33 67<br />
Gialison 70 30<br />
Haines 31 69<br />
Jackson Harbor 86 14<br />
Kangaroo Lake 94 6<br />
Lakeside 28 72<br />
Murphy 64 36<br />
Newport 54 46<br />
Nicolet 37 63<br />
Otumba 27 73<br />
Percy 71 29<br />
Portage 41 59<br />
Rock 45 55<br />
Sand Dunes 42 58<br />
Sandy Bay 60 40<br />
68
School 100 0<br />
SturRecCanal 40 60<br />
Sister Bay 9 91<br />
Sunset 13 87<br />
Whitefish 64 36<br />
In <strong>2005</strong> a summary of relationships between Cladophora observations and E. coli levels were<br />
made at beaches during summer <strong>2005</strong> (Table 10). Cladophora observations were put at 0=none,<br />
1=low, 2=moderate, and 3=high (per DNR suggestions and visual chart). Actual E. coli<br />
monitoring data was used. Linear regression analysis was utilized to arrive at F and p values.<br />
Egg Harbor was the only location where there was a correlation between Cladophora levels and<br />
E. coli levels.<br />
Table 10: Summary of relationships between Cladophora observations and E. coli levels at<br />
beaches during summer <strong>2005</strong>.<br />
Beach F value P value<br />
Anclam 0.156 0.695<br />
Bailey’s Harbor 0.681 0.413<br />
Egg Harbor 6.621 0.013<br />
Ellison 0.114 0.737<br />
Ephraim 1.572 0.215<br />
Europe 1 0.002 0.969<br />
Europe 2 0.002 0.969<br />
Europe 3 0.491 0.487<br />
Fish Creek 0.071 0.791<br />
Gialison 0.397 0.541<br />
Haines 1.367 0.247<br />
Jackson Harbor Ridges 0.016 0.900<br />
Lakeside 0.022 0.884<br />
Murphy 2.192 0.144<br />
Newport 0.036 0.850<br />
Nicolet 3.281 0.076<br />
Otumba 0.002 0.962<br />
Percy Johnson 3.041 0.109<br />
Portage Park 0.156 0.696<br />
Rock Island 0.234 0.637<br />
Sand Dune 0.042 0.840<br />
Sandy Bay 1.382 0.252<br />
Schoolhouse 0.009 0.926<br />
Sister Bay 1.855 0.179<br />
Sturgeon Bay Rec. Canal 0.037 0.848<br />
Sunset 0.016 0.901<br />
Whitefish Bay 1.869 0.177<br />
Whitefish Dunes 0.319 0.575<br />
The preliminary study showed that E. coli concentrations were relatively high in the Cladophora<br />
mats at all four beaches and it was high around the mats at beaches (Figures 36-39).<br />
69
Figure 37: Lakeside Park <strong>2005</strong> E. coli samples in Cladophora Mats.<br />
E. coli MPN/100mL<br />
2500<br />
2000<br />
Date<br />
1500<br />
1000<br />
500<br />
0<br />
7/21/<strong>2005</strong><br />
10M Lft of Mat<br />
10M Rt of Mat<br />
10M Away<br />
5M Lft of Mat<br />
5M Rt of Mat<br />
5M Away<br />
Figure 38: Murphy Park <strong>2005</strong> E. coli samples in Cladophora Mats.<br />
1M Lft of Mat<br />
1M Rt of Mat<br />
1M Away<br />
Mat Proper<br />
10M Lft of Mat 10M Rt of Mat 10M Away 5M Lft of Mat 5M Rt of Mat<br />
5M Away 1M Lft of Mat 1M Rt of Mat 1M Away Mat Proper<br />
E. coli MPN/100mL<br />
2500<br />
2000<br />
1500<br />
1000<br />
500<br />
0<br />
1/1/1900<br />
1/2/1900<br />
Date<br />
1/3/1900<br />
1/4/1900<br />
1/5/1900<br />
1/6/1900<br />
1/7/1900<br />
Mat Proper<br />
1M Away<br />
1M Rt of Mat<br />
1M Lft of Mat<br />
5M Away<br />
5M Rt of Mat<br />
5M Lft of Mat<br />
10M Away<br />
10M Rt of Mat<br />
10M Lft of Mat<br />
10M Lft of Mat 10M Rt of Mat 10M Away 5M Lft of Mat 5M Rt of Mat<br />
5M Away 1M Lft of Mat 1M Rt of Mat 1M Away Mat Proper<br />
70
Figure 39: Whitefish Dunes State Park <strong>2005</strong> E. coli samples in Cladophora Mats.<br />
E.coli MPN/100mL<br />
2500<br />
2000<br />
1500<br />
1000<br />
500<br />
0<br />
6/24/<strong>2005</strong><br />
6/29/<strong>2005</strong><br />
7/20/<strong>2005</strong><br />
7/27/<strong>2005</strong><br />
8/3/<strong>2005</strong><br />
8/8/<strong>2005</strong><br />
10M Away<br />
10m Rt of Mat<br />
10M Lft of Mat<br />
Mat Proper<br />
1M Away<br />
1m Rt of Mat<br />
1m Lt of mat<br />
5m Away<br />
5m Rt of M at<br />
5M Lft of Mat<br />
Figure 40: Anclam Park <strong>2005</strong> E. coli samples in Cladophora Mats.<br />
E. coli MPN/100mL<br />
Date of Sample<br />
71<br />
Mat Location<br />
10M Lft of Mat 10m Rt of Mat 10M Away 5M Lft of Mat 5m Rt of Mat<br />
5m Away 1m Lt of mat 1m Rt of Mat 1M Away Mat Proper<br />
2500<br />
2000<br />
1500<br />
1000<br />
500<br />
0<br />
6/23/<strong>2005</strong><br />
Date<br />
6/29/<strong>2005</strong><br />
7/11/<strong>2005</strong><br />
10M Away<br />
10M Rt of Mat<br />
10M Lft of Mat<br />
5M Away<br />
5M Rtof Mat<br />
5M Lft of Mat<br />
Mat Proper<br />
1M Away<br />
1M Rt of Mat<br />
1M Lft of Mat<br />
Sample Location<br />
10M Lft of Mat 10M Rt of Mat 10M Away 5M Lft of Mat 5M Rtof Mat<br />
5M Away 1M Lft of Mat 1M Rt of Mat 1M Away Mat Proper
Further Study on Impacts of Algae at the Beach<br />
Starting in 2007 there will be a three year study done around the Great Lakes by a partnership of<br />
University of Wisconsin-Oshkosh, University of Minnesota, and the United States Geologic<br />
Survey to determine the impacts of Cladophora mats on E. coli concentrations in beach water.<br />
There will be several beaches in <strong>Door</strong> <strong>County</strong> that will be included in this study.<br />
Pathogen Presence - Methodology<br />
The beach waters of Sunset (Sturgeon Bay), Nicolet, Murphy, Ellison Bay, Baileys Harbor,<br />
Ephraim, Fish Creek, Otumba, Sister Bay and Whitefish Dunes beaches were monitored weekly<br />
for pathogens which commonly cause gastrointestinal (GI) tract disease in humans. Water<br />
samples were collected in the center of the beach in 24 inches of water and analyzed for<br />
Salmonella, Shigella, and Campylobacter.<br />
Pathogen Presence - Results<br />
The beach waters of Sunset (Sturgeon Bay); Nicolet, Murphy, Ellison Bay, Baileys Harbor,<br />
Ephraim, Fish Creek, Otumba, Sister Bay, and Whitefish Dunes beaches were monitored weekly<br />
for pathogens which commonly cause GI tract disease in humans. Water samples were collected<br />
in the center of the beach in 24 inches of water and analyzed for Salmonella, Shigella, and<br />
Campylobacter. Salmonella and Shigella were not detected at any of the beaches.<br />
Campylobacter was detected at Otumba Park Beach in 69% of the samples in 2004 and 36% in<br />
<strong>2005</strong>. In <strong>2005</strong> Campylobacter was found at Sunset Park (Sturgeon Bay) in 42%, Ellison Bay in<br />
33%, Murphy Park 25%, and Nicolet Bay Beach in 25% of the samples (Table 11). There was<br />
no correlation between detection of Campylobacter and elevated E. coli concentrations in water<br />
samples. Campylobacter comes from a variety of sources, including birds, humans, and cattle.<br />
Campylobacter that was found did not match any of the known human, bovine, or poultry<br />
strains. Additional testing to determine the specific source of Campylobacter needs to be done.<br />
Additional water samples for pathogens do not need to be taken at Ephraim, Fish Creek, Sister<br />
Bay, Baileys Harbor Ridges, or Whitefish Dunes beaches unless a problem arises<br />
Table 11: Pathogens detected from five selected beaches in <strong>Door</strong> <strong>County</strong> during summer<br />
2004 and <strong>2005</strong>.<br />
ND= not detected from any sample for the entire summer. TNTC= too numerous to count.<br />
Beach Salmonella Shigella Campylobacter E. coli<br />
Ephraim<br />
2004<br />
Fish Creek<br />
2004<br />
Otumba Park<br />
2004 & <strong>2005</strong><br />
ND ND ND<br />
ND ND ND<br />
6/10/2004 ND ND Low<br />
6/17/2004 ND ND Moderate 365.4/100ml<br />
6/24/2004 ND ND Moderate 13.4/100ml<br />
7/8/2004 ND ND TNTC 79.6/100ml<br />
7/15/2004 ND ND TNTC 27.1/100 ml<br />
7/22/2004 ND ND TNTC 406.7/100 l<br />
7/29/2004 ND ND TNTC 52.1/100 ml<br />
8/11/2004 ND ND TNTC 88.4/100 ml<br />
8/26/2004 ND ND TNTC 35.5/100 ml<br />
6/28/<strong>2005</strong> ND ND TNTC 859.1/100ml<br />
7/5/<strong>2005</strong> ND ND TNTC 184.7/100ml<br />
7/12/<strong>2005</strong> ND ND TNTC 17.3/100ml<br />
72
7/26/<strong>2005</strong> ND ND TNTC 1046.5/100ml<br />
8/23/<strong>2005</strong> ND ND TNTC 99/100ml<br />
Sister Bay<br />
2004<br />
ND ND ND<br />
Whitefish<br />
Dunes 2004<br />
Baileys<br />
Harbor<br />
Ridges <strong>2005</strong><br />
Ellison Bay<br />
<strong>2005</strong><br />
ND ND ND<br />
ND ND ND<br />
6/14/<strong>2005</strong> ND ND 4.7 9.7/100ml<br />
7/5/<strong>2005</strong> ND ND 4 151.5/100ml<br />
7/12/<strong>2005</strong> ND ND 2.3 8.6/100ml<br />
8/9/<strong>2005</strong><br />
Murphy<br />
Park <strong>2005</strong><br />
ND ND 1.33 8.6/100ml<br />
7/5/<strong>2005</strong> ND ND 1.67 4.8/100ml<br />
7/12/<strong>2005</strong> ND ND 5.6 2.4/100ml<br />
8/9/<strong>2005</strong><br />
Nicolet<br />
Beach<br />
<strong>2005</strong><br />
ND ND TNTC 24/100ml<br />
ND ND<br />
2419.2/100m<br />
7/5/<strong>2005</strong><br />
TNTC<br />
l<br />
7/12/<strong>2005</strong> ND ND 37 7.3/100ml<br />
8/2/<strong>2005</strong><br />
Sunset<br />
(Sturgeon<br />
Bay) <strong>2005</strong><br />
ND ND 5.33 6.3/100ml<br />
6/14/<strong>2005</strong> ND ND 4.6 22.8/100ml<br />
6/21/<strong>2005</strong> ND ND 2.33 706/100ml<br />
6/28/<strong>2005</strong> ND ND 3.33 467.3/100ml<br />
7/12/<strong>2005</strong> ND ND 100 495.1/100ml<br />
ND ND<br />
1365.7/100m<br />
8/16/<strong>2005</strong><br />
11.67 l<br />
Determining the Identity of E. coli Contaminating <strong>Door</strong> <strong>County</strong> Beaches<br />
E. coli isolates were collected from beach water samples at Baileys Harbor Ridges, Ellison Bay,<br />
Ephraim, Fish Creek, Murphy Park, Nicolet, Otumba, Sister Bay, Sunset (Sturgeon Bay), and<br />
Whitefish Dunes beaches and were used for determining the identity of the E. coli. The goals in<br />
identifying E. coli found on these beaches were to determine if the E. coli was from a human or<br />
animal (avian, dog, cattle) source. E. coli is commonly used as in indicator of beach<br />
contamination because it is associated with fecal material. The common threat to swimmer’s<br />
health comes from the pathogens and other toxins that are commonly found in waters with high<br />
E. coli concentrations, not the E. coli itself. The use of both antibiotic resistance and genetic<br />
fingerprinting tests increases the overall validity of the results.<br />
E. coli Identity Methodology<br />
Both tests require the recovery of E. coli isolates from solid fecal samples and beach water<br />
samples. Throughout the summer, E. coli isolates were recovered from fecal matter collected<br />
from the beaches, human samples from wastewater treatment facilities. Water isolates were<br />
recovered from E. coli positive wells in the Quanti-trays throughout the summer (Figure 40). A<br />
total of 1300+ E. coli isolates were recovered<br />
73
Antibiotic Resistance Methodology<br />
E. coli from human sources typically has a higher resistance to the majority of the antibiotics<br />
because humans have been subjected to a larger quantity and variety of these antibiotics. If the<br />
E. coli has a low resistance to the antibiotics the source is usually not human. Other potential<br />
non human sources of E. coli include birds, dogs, cattle, deer and other animals depending on the<br />
beach location. Quanti-Trays with positive fluorescence for E. coli were pierced in the back and<br />
a 10µl lapful of organism was extracted and plated on EMB agar. Isolates were confirmed as E.<br />
coli, by traditional biochemical testing and the API 20E.<br />
Figure 41: Quanti-Trays with positive<br />
fluorescence for E. coli<br />
Antibiotic resistance testing was done on E. coli recovered from Ephraim, Fish Creek, Sister<br />
Bay, Otumba Park (Sturgeon Bay), and Whitefish Dunes State Park. Two methods were used to<br />
look at the antibiotic resistance of E. coli isolates. One method utilized 16 different antibiotics<br />
and the classic Kirby-Bauer antibiotic sensitivity testing techniques to determine antibiotic<br />
resistance and sensitivity (Table 12).<br />
74
Table 12: Antibiotics used for antibiotic resistance testing of E. coli isolates and their<br />
concentrations.<br />
Antibiotic Concentration (µg/ml)<br />
Ampicillin 10µg<br />
Augmentin 30µg<br />
Cephalothin 30µg<br />
Ciprofloxacin 5µg<br />
Erythromycin 15µg<br />
Gentimycin 10µg<br />
Kanamycin 30µg<br />
Nalidixic Acid 30µg<br />
Novobiocin 5µg<br />
Polymyxin B 300 U*<br />
Streptomycin 10µg<br />
Sulfasoxizole 0.25 mg<br />
Tetracycline 30µg<br />
Trimethoprim 5µg<br />
Tobrmycin 10µg<br />
Vancomycin 30µg<br />
*Note: Polymyxin B is measured in International Units.<br />
The second method of testing antibiotic resistance used a replica plating method that used the<br />
well established methods by Kaspar and Pareveen in a 48 pin microplate replicator (Table 13).<br />
Statistical analysis was done to compare between categories using a test of binomial proportion<br />
(alpha = 0.05) to determine the antibiotic resistance of the E. coli.<br />
Table 13: Antibiotics used in replica plating technique and their concentration.<br />
Antibiotic concentration (µg/ml)<br />
Ampicillin 20<br />
Augmentin 25 Amoxicillin + 5<br />
Clavulanic acid<br />
Chlorotetracycline 25<br />
Ciprofloxacin 5<br />
Kanamycin 50<br />
Nalidixic Acid 25<br />
Neomycin 50<br />
Oxytetracycline 25<br />
Penicillin 90 U*<br />
Streptomycin 12.5<br />
Sulfathiazole 2000<br />
Tetracycline 25<br />
*Note: Penicillin is measured in International Units.<br />
Genetic Fingerprinting Methodology<br />
Genetic fingerprinting was done on E. coli recovered from Baileys Harbor Ridges, Ellison Bay,<br />
Ephraim, Fish Creek, Murphy Park, Nicolet, Otumba, Sister Bay, Sunset (Sturgeon Bay), and<br />
Whitefish Dunes State Park. Repetitive element PCR (using the BOXA1R primer) was used to<br />
obtain DNA fingerprints of E. coli obtained from water samples as well as from avian and<br />
75
human waste samples. Fingerprints were imaged using instrumentation housed in the NSF /<br />
Robert E. Moore Functional Genomics Core Facility at UW Oshkosh.<br />
The DNA fingerprints were analyzed by grouping similar genetic codes and comparing them to a<br />
database of genetic codes from the solid fecal samples taken from humans, gulls, geese, ducks,<br />
dogs, and deer in <strong>Door</strong> <strong>County</strong>. E. coli isolates that were recovered from a beach water samples<br />
were matched to the genetic codes from the various solid waste samples to determine the genetic<br />
identity of the E. coli isolate. For example, if the genetic code from an E. coli isolate collected<br />
from beach water was statistically similar to the genetic code of the E. coli isolates from human<br />
waste samples the E. coli isolate is considered to be from a human source. The frequency and<br />
size of groupings of similar genetic codes where analyzed to determine the overall presence of<br />
both human and avian E. coli sources at each of the beaches. The groupings were constructed by<br />
calculating the Dice similarity coefficients and constructing cladograms using the Unweighted<br />
Pair Group Method with Arithmetic Mean (UPGMA).<br />
Source Identification E. coli Identity - Results/Conclusions<br />
Overall the level of human resistance to the antibiotics was lower in the E. coli isolates from<br />
<strong>Door</strong> <strong>County</strong> than it has been in other similar studies in more urban areas. This is expected<br />
because smaller population bodies have overall lower resistance to the large variety of antibiotics<br />
used in the test.<br />
In 2004 the antibiotic resistance testing and the genetic fingerprinting indicate that the largest<br />
contributing source of E. coli at Whitefish Dunes beach is from avian sources, primarily gulls.<br />
In 2004 and <strong>2005</strong> Baileys Harbor Ridges, Ellison Bay, Ephraim, Fish Creek, Murphy Park,<br />
Nicolet, Otumba, Sister Bay, and Sunset (Sturgeon Bay), both tests reveal that E. coli at these<br />
beaches are coming from human, avian and other animal sources (Figure 41). Since human E.<br />
coli was found to be a source for a portion of the beach contamination at these beaches additional<br />
sampling and genetic analysis needs to be done in 2006 to identify the specific locations of these<br />
sources. Additional samples should be taken in storm water outfall pipes, streams and runoff<br />
channels that outlet in proximity to the beach.<br />
Figure 42: Genetic Groupings of E. coli Isolates MANOVA Results by Beach<br />
AP<br />
BH<br />
E<br />
EB<br />
EH<br />
FC<br />
HW<br />
LP<br />
MP<br />
NB<br />
NI<br />
O<br />
OR<br />
PP<br />
SB<br />
SP<br />
SS<br />
SU<br />
SW<br />
WF<br />
76
Beach Contamination Source Identification Methods<br />
Recommendations<br />
The methods that are used for beach contamination source identification in 2006 will depend on<br />
the final statistical results on the 2003-<strong>2005</strong> beach data. These results will assist in determining<br />
the refinements and additional work that needs to be done in the beach contamination source<br />
identification project.<br />
Portions of the data collected in 2004-<strong>2005</strong> needs to be replicated and further focused on 2006 to<br />
account for the effects of weather patterns, water levels, and bird populations. Replication will<br />
also determine the strength of the 2004-<strong>2005</strong> results and provide more data that can be applied to<br />
creating a baseline for <strong>Door</strong> <strong>County</strong> surface water quality.<br />
The physical characterizations of each beach are used for determining the best water sample<br />
locations and statistical correlative work. The characterizations will also be useful for predictive<br />
modeling work.<br />
Recent research indicates that Cladophora algae are a medium for E. coli bacteria growth on the<br />
beach. Further work needs to be done in this area to determine the potential for Cladophora to<br />
be a contributing source of E. coli at <strong>Door</strong> <strong>County</strong> beaches.<br />
Primary focus for 2006 beach project will be on rain event E. coli sampling and collecting<br />
additional samples include water samples for E. coli levels at locations that were determined to<br />
be statistically significant potential sources of contamination; and phosphorus, turbidity, and<br />
basic water quality parameters at a variety of <strong>Door</strong> <strong>County</strong> beaches. Overall recommendations<br />
for future beach contamination source identification:<br />
Collect water samples for E. coli concentrations and recover E. coli isolates for genetic<br />
analysis from storm water and stream outfalls during rain events. These isolates and<br />
concentrations of E. coli can be compared to beach levels and beach-recovered isolates.<br />
Conduct spatial sampling of Cladophora mats to determine effects on E. coli levels as<br />
these masses migrate along the shoreline, moving along and in and out of beach waters.<br />
Recover E. coli isolates to determine if bacteria multiply in beach areas<br />
Continue collection of E. coli isolates for genetic analysis in areas/times with known high<br />
E. coli. Recover E. coli isolates from the beach water and sand at selected locations<br />
before and after storm events, during windy conditions, and in runoff channels.<br />
Expand the post-rainfall sampling to look at levels of E. coli being washed from<br />
impervious surfaces and land masses in close proximity to the beaches. Complete data<br />
sets for beaches studied in 2004 and expand the post-rainfall sampling to other beach<br />
locations.<br />
Conduct spatial sand sampling in runoff channels on beaches with impervious surface<br />
runoff.<br />
Discontinue detection of Salmonella and Shigella at beaches that have already been tested<br />
for these pathogens, unless there is a specific reason to continue at a specific beach.<br />
Continue Campylobacter detection in water and in fecal material of both avian species<br />
and humans. Monitor for pathogens at beaches that have not been monitored for<br />
pathogens.<br />
77
General Beach Management Recommendations<br />
• Post wet weather swimming advisory signs and avoid swimming at beaches after rain<br />
events of ¼ inch in 24 hours.<br />
• Consider options for reducing storm water runoff to all monitored beaches with storm<br />
water pipes and or runoff areas.<br />
• Place signs that ask and activity instruct beach goers not to feed the birds at all of the<br />
monitored beaches.<br />
• Inform the public about the potential impact of runoff, dog/pet feces, and impacts of<br />
feeding birds on water quality.<br />
78
Appendix A: Storm water Conveyance Systems as a Source<br />
of E. coli in Beach Water – Otumba Park and Ephraim Beach<br />
Prepared by the University of Wisconsin – Oshkosh Biology and Microbiology Department<br />
Otumba Park Beach<br />
Method:<br />
During the summer of <strong>2005</strong> a rain gauge located within 2 miles of each beach was utilized to<br />
measure rainfall. A rainfall event reaching between 0.2-0.3 inches of rain within a 24 hour<br />
period was considered to be “significant”. When the gauge recorded a “significant rainfall event”<br />
it would automatically call a cell phone alerting samplers. Samples would then be collected at<br />
designated pipes, storm sewer basins, and streams. The samples were collected either with an<br />
extended pole with an attached sterile whirl-pak bag or directly into a sterile 100 ml bottle. After<br />
the samples were collected they were stored in a cooler with ice until processing in the<br />
laboratory. Sampling for storm sewer basins occurred once for each rain event, approximately<br />
one hour after the samplers were alerted. During some rain events some sites were dry at the<br />
time of sampling.<br />
Sampling of discharge from storm water pipes or streams emptying at beaches occurred at 1, 2,<br />
and 3 hours after the samplers were alerted. In addition, beach water (24 inch depth, center of<br />
beach) was monitored for E. coli concentrations at 1,2,3,4,8,12, and 24 hours after samplers were<br />
alerted of a significant rainfall event.<br />
Results:<br />
1. Otumba Park Beach and Surrounds: E. coli in Storm water Conveyance Systems<br />
Storm water conveyance systems around Otumba Park Beach (Sturgeon Bay) were investigated<br />
as a contributor to E. coli contamination of beach water. Samples were collected between May<br />
31, <strong>2005</strong> and August 27, <strong>2005</strong>. There were a total of four significant rain events during this time.<br />
Sampling Site 1 (storm water basin) located at the end of Juniper St. near the beach access area<br />
(See <strong>Map</strong>) was identified as a “control site” to be sampled throughout the summer during periods<br />
of no rain. This site was sampled five times during non-rain times. The average E. coli<br />
concentration found at Site 1 during non-rain periods was 1143.1/100 ml water. These values<br />
varied widely, however, with detected E. coli concentrations ranging from 131 E. coli /100 ml<br />
water to 4611 E. coli /100 ml water. In addition, Sampling Site 1 was sampled during two rain<br />
events (July 28 and August 9, <strong>2005</strong>). During rain the average E. coli concentration found at Site<br />
1 was 585 E. coli /100 ml water. This suggests that this storm water basin is a potential source<br />
of E. coli contamination of beach water.<br />
Sampling Sites 2, 3, and 4 (storm water basins) were sampled only during rain events. Site 2 is<br />
located on the corner of Locust and Kendale St., Site 3 is on Hudson near <strong>Map</strong>le, and Site 4 is on<br />
Hudson near Oak (See <strong>Map</strong>). Sites 2, 3, and 4 averaged 10,051, 658, and 1881 E. coli /100 ml<br />
water, respectively, during rain events (See Figure 15). Sites 3 and 4 are located approximately<br />
one block apart, with Site 4 further south along Hudson St. It appears that E. coli is entering the<br />
storm water pipes somewhere south of our sampling area and is being diluted as rain enters the<br />
system on its way to empty into the beach.<br />
Site 2, the site with the greatest average E. coli concentration (10X greater than the upper limit<br />
for E. coli in beach water), was dry during two of the sampled rain events and had a relatively<br />
low E. coli concentration (239 E. coli /100 ml water) during the July 28, <strong>2005</strong> sampling.<br />
79
Without further sampling at this site, it is difficult to determine if it truly is a significant source<br />
of E. coli in beach water.<br />
Two additional sites (storm water discharge pipes) were sampled at Otumba Park Beach during<br />
rain events. These sites have been designated P1 (west side of beach) and P2 (east side of<br />
beach). Discharge pipes were sampled one, two, and three hours after samplers were alerted of a<br />
significant rainfall event. Pipes only contained storm water discharge on August 9 and 27. Both<br />
pipes discharged storm water with over 2000 E. coli /100 ml water at all time points. For P1, E.<br />
coli concentrations rose from 4290 to 7780 E. coli /100 ml water during the three hour sampling<br />
period. At P2, E. coli discharge rose, from 2365 to 3610 E. coli /100 ml water in the first two<br />
hours then fell slightly to 2191 E. coli /100 ml water by the third hour. This represents a<br />
substantial amount of E. coli entering beach water.<br />
E. coli concentrations in beach water also were elevated following rainfall events, but timing of<br />
this increase in beach water was dependent on rainfall amounts and rates. For example, on<br />
August 27, <strong>2005</strong> beach water E. coli was measured at 988 E. coli /100 ml water at the first hour<br />
sampling, elevated slightly at the second and third hour and began to decline until it reached 85<br />
E. coli /100 ml water by 24 hours post alert. On this day P1 and P2 discharged 3165 and 1498 E.<br />
coli /100 ml water, respectively, at the first hour sampling. On August 11, <strong>2005</strong>, however, storm<br />
water basins at Sites 3 and 4 averaged over 1700 E. coli /100 ml water at the first hour sampling<br />
and P1 and P2 were dry for the first three hours post alert. E. coli concentration in beach water<br />
remained low (< 200 E. coli /100 ml water) for the first four hours of sampling. At 8 hours post<br />
alert E. coli concentration in beach water rose to 2359 E. coli /100 ml water and did not drop<br />
substantially until the 24 hour sample.<br />
It appears that relatively high levels of E. coli enter the storm water conveyance system around<br />
Otumba Park before or during rainfall events, and is washed into beach water at Otumba Park<br />
Beach at some time point after a significant rainfall event. Results from genetic testing indicate<br />
that the E.coli in the conveyance system is not predominately human, or avian. However, there<br />
were some groupings of isolates that are yet to be determined. These isolates may be of an<br />
origin that is not represented in the database, such as dog or cat. While the source of this E. coli<br />
has not yet been conclusively determined, it is clear that this conveyance system does play some<br />
role in the E. coli found at the beach. In fact, while large groups can not be genetically matched,<br />
some beach water isolates have matched very closely to those isolates recovered from the<br />
conveyance system. Mitigating this source of E. coli may prove helpful in elucidating ways to<br />
avoid contamination of this local beach.<br />
80
Figure 43: Otumba Park Storm Water Conveyance Sample Results <strong>2005</strong><br />
E. coli (MPN/100 ml water)<br />
4000<br />
3500<br />
3000<br />
2500<br />
2000<br />
1500<br />
1000<br />
500<br />
0<br />
Ephraim Beach<br />
Methods:<br />
4611 4900 19,863<br />
5/31/<strong>2005</strong> 6/15/<strong>2005</strong> 7/7/<strong>2005</strong> 7/19/<strong>2005</strong> 7/28/<strong>2005</strong> 8/9/<strong>2005</strong> 8/11/<strong>2005</strong> 8/26/<strong>2005</strong> 8/27/<strong>2005</strong><br />
)Site 1 (non-rainfall )Site 1 (rainfall Site 2 Site 3 Site 4<br />
During the summer of <strong>2005</strong> a rain gauge located within 2 miles of each beach was utilized to<br />
measure rainfall. A rainfall event reaching between 0.2-0.3 inches of rain within a 24 hour<br />
period was considered to be “significant”. When the gauge recorded a “significant rainfall event”<br />
it would automatically call a cell phone alerting samplers. Samples would then be collected at<br />
designated pipes, storm sewer basins, and streams. The samples were collected either with an<br />
extended pole with an attached sterile whirl-pak bag or directly into a sterile 100 ml bottle. After<br />
the samples were collected they were stored in a cooler with ice until processing in the<br />
laboratory. Sampling for storm sewer basins occurred once for each rain event, approximately<br />
one hour after the samplers were alerted. During some rain events some sites were dry at the<br />
time of sampling.<br />
Sampling of discharge from storm water pipes or streams emptying at beaches occurred at 1, 2,<br />
and 3 hours after the samplers were alerted. In addition, beach water (24 inch depth, center of<br />
beach) was monitored for E. coli concentrations at 1,2,3,4,8,12, and 24 hours after samplers were<br />
alerted of a significant rainfall event.<br />
Town of Ephraim Beach and Surrounds: E. coli in Storm water Conveyance Systems<br />
Storm water conveyance systems around the Town of Ephraim Beach were investigated as a<br />
contributor to the E. coli contamination of beach water. Samples were collected between June 8,<br />
<strong>2005</strong> and August 11, <strong>2005</strong>. There were a total of four significant rain events during this time.<br />
Sites 1-5 are stream channels around Town of Ephraim Beach that empty into the beach area.<br />
Site 6 is storm water catch basin located on the south side of Hwy 42 near Site 4. Average E.<br />
coli concentrations for Sites 1-5 ranged from 59.9 to 1231 E. col/100 ml water when samples<br />
81
were collected 1 hour after samplers were alerted of a significant rainfall event (See Figure 15).<br />
Site 3 was dry for three of the sampling events and had a relatively low E. coli concentration (75<br />
E. coli /100 ml water) during the one rain event when storm water is flowing at this site. This<br />
site is located in Brookside Creek at the dead end of Brookside Lane, and does not appear to be a<br />
significant contributor to E. coli contamination at the Ephraim beach. Likewise, Site 2 (In<br />
stream channel of Hidden Springs, on south side of Larsen Lane, east of Hidden Spring Road)<br />
averaged 59.9 E. coli /100 ml water, and does not appear to contribute to E. coli contamination<br />
of the beach.<br />
Sites 1(In stream channel just south of the culvert pipe along the south side of Larson Lane<br />
where the stream crosses Larson Lane), 4 (In stream channel on the south side of Hwy 42, just<br />
east of the eastern border of the public beach property line, stream flows under road into culvert<br />
pipe. The sample was taken 5 feet above the area where the storm water outlet (concrete pipe)<br />
joins the stream), and 5 (In stream channel Hidden Springs, on south side of Hwy 42, Northeast<br />
of Hidden Spring Road) are located closer to the beach than the other stream locations and<br />
appear to contribute more to E. coli contamination of the beach water. Site 6 (a storm water<br />
catch basin) also is located close to the beach and near Site 4. It had a moderate average E. coli<br />
concentration (236 E. coli /100 ml water). Genetic analysis did not show that the majority of the<br />
isolates were human or avian in nature and there were no distinct groupings indicating a mixed<br />
source of E. coli. Additional analysis of genetic results will compare beach water isolates with<br />
those recovered from the conveyance system.<br />
When beach water E. coli concentrations are examined over the 24 hours following a significant<br />
rainfall event, it appears that concentrations consistently elevate within one to four hours and<br />
then decline to very low levels by 24 hours post rainfall. How fast E. coli concentrations rise or<br />
how elevated they become depends on amount and rate of rainfall. It should be noted that the<br />
<strong>2005</strong> beach season was relatively dry, and that trends in E. coli concentrations could change in a<br />
wet year.<br />
Figure 44: Ephraim Storm Water Conveyance Sample Results <strong>2005</strong><br />
4000<br />
E.coli MPN/100mL<br />
3500<br />
3000<br />
2500<br />
2000<br />
1500<br />
1000<br />
500<br />
0<br />
6/8/<strong>2005</strong> 7/28/<strong>2005</strong> 8/9/<strong>2005</strong> 8/11/<strong>2005</strong><br />
Date<br />
82<br />
Site 1<br />
Site 2<br />
Site 3<br />
Site 4<br />
Site 5<br />
Site 6
Appendix B: Watershed Study – Bay Shore Property<br />
Association Summer <strong>2005</strong><br />
Prepared by: Colleen McDermott, D.V.M., Ph.D., Professor of Microbiology, Dept. Biology and<br />
Microbiology, Halsey Science Center, University of Wisconsin Oshkosh, Oshkosh, WI 54901<br />
It has been a pleasure to complete a second year of working with the Bay Shore Property<br />
Owners’ Association on water quality testing in <strong>Door</strong> <strong>County</strong>, WI. Our laboratory measured<br />
coliform and E. coli concentrations in over 175 water samples collected by hard-working,<br />
dedicated volunteers, living along Bay shore Drive during summer <strong>2005</strong>. Sampling began in<br />
mid-June (6/13/<strong>2005</strong>) and continued twice per week until the end of August (8/29/<strong>2005</strong>).<br />
Samples were collected from beach water with a depth of 24 inches (approximately 6-12” below<br />
the surface) at seven residences along Bay shore Drive and Laurie Lane and from a culvert<br />
located between 5979 and 5783 Bay shore Drive. The residences are spaced approximately two<br />
miles apart, with the northern most address being 6675 Bay shore Drive and the southern most<br />
address being 4227 Bay shore Drive. Public beaches close to these properties that were<br />
monitored as part of the county monitoring effort include Frank Murphy Park to the north and<br />
Sunset Park, Sturgeon Bay to the south.<br />
Table 1 shows the E. coli concentrations measured from water at the seven residences and at the<br />
culvert by date. This table represents a correction of the data previously distributed by the Bay<br />
Shore Property Owners group during the September 30, <strong>2005</strong> meeting. You will notice that<br />
average E. coli concentrations from the residences was slightly higher for June than for July or<br />
August, although there was a small spike in concentrations detected in mid-July. The attached<br />
figures also show these same data in a slightly different form. Figure 1 shows the seasonal<br />
average E. coli concentration for each address and for the culvert. Figures 2-9 show the E. coli<br />
concentrations separately for each beach by date. Once again, the culvert had the highest E. coli<br />
concentrations, with a seasonal average E. coli concentration of over 600 MPN/100 ml water<br />
(2004 seasonal average for the culvert was 284 E. coli /100 ml water).<br />
For beach water monitoring, two excedence points have been established by the State of<br />
Wisconsin. If E. coli concentration exceeds 235 organisms/100 ml water, a poor water quality<br />
advisory is issued. If E. coli concentration exceeds 1000 organisms/100 ml water, the beach is<br />
closed. Table 2 compares the number of excedences detected along Bay shore Drive and in<br />
water from the culvert during summer 2004 and <strong>2005</strong>. While there is little difference in<br />
excedence percentages at the residences (per water sample taken) between the two years, the E.<br />
coli concentration of water from the culvert appears to have substantially increased in summer<br />
<strong>2005</strong>. The number of excedences detected for the residences is not significantly different from<br />
those measured at the public beaches throughout <strong>Door</strong> <strong>County</strong>, and should be considered a<br />
measure of good water quality. The number of excedences detected from water from the culvert<br />
is disturbing.<br />
As was discussed at the September 30, <strong>2005</strong> meeting, monitoring beach water for E. coli<br />
concentration is important for determining baseline levels of microbes in the environment and<br />
for protecting public health if E. coli concentrations are elevated. Monitoring does not, however,<br />
determine a source of the microbial contamination when/if it occurs.<br />
Source tracking of microbial contamination can be accomplished by many different mechanisms.<br />
Spatial sampling along shorelines, depth sampling, pathogen detection in water, and E. coli<br />
isolation with DNA fingerprinting, all are methods that our laboratory has utilized at public<br />
beaches in <strong>Door</strong> <strong>County</strong>. Likewise, we have isolated, enumerated and fingerprinted E. coli from<br />
beach sand and from Cladophora mats at these public beaches, also to attempt to track the source<br />
83
of microbial contamination. I highly recommend that the Bay shore Property Owners Group<br />
participate in some sort of source tracking investigation in summer 2006. The culvert as a source<br />
of contamination is a likely first step, followed by simple spatial or depth sampling. Depending<br />
on finances, additional testing could be undertaken. Measurement of Cladophora mats and<br />
correlation with E. coli concentrations in water is a low cost possibility that may shed light on a<br />
source of microbial contamination. Measurement of environmental parameters (wind speed,<br />
wind direction, wave height, etc.) at the time of sampling is another.<br />
Our laboratory has agreed to act as a fiscal agent for the Bay Shore Property Owners to<br />
allow the group to receive funding from a Lakeshore Natural Resources Partnership grant. We<br />
are pleased to be continuing our relationship with your organization and look forward to<br />
planning for summer 2006.<br />
Table 14: Comparison of E. coli concentrations exceeding safe swimming standards in<br />
2004 and <strong>2005</strong>. Asterisks indicate substantial increase in <strong>2005</strong> compared to 2004.<br />
2004 <strong>2005</strong><br />
Total Culvert Residences Total Culvert Residences<br />
Tests<br />
Tests<br />
# Tests 96 12 72 176 19 157<br />
# >235<br />
MPN<br />
5 2 3 14 9 5<br />
% > 235<br />
MPN<br />
5.2% 16.7% 4.2% 8.0% 47.4%* 3.2%<br />
# >1000<br />
MPN<br />
1 1 0 6 4 2<br />
% > 1000<br />
MPN<br />
1.0% 8.3% 0% 3.4% 21.1%* 1.3%<br />
Figure 45: Bay Shore Property Association Watershed Study Summer <strong>2005</strong><br />
Average E. coli (MPN/100 ml water)<br />
700<br />
600<br />
500<br />
400<br />
300<br />
200<br />
100<br />
0<br />
6675 5979 5783 Culvert 5573 4998 4575 Laurie 4227<br />
Sample Location<br />
84

![A Guide to the Control and Management of Invasive Phragmites [PDF]](https://img.yumpu.com/19126786/1/190x190/a-guide-to-the-control-and-management-of-invasive-phragmites-pdf.jpg?quality=85)


![Homeowner's Guide to Japanese Knotweed Control [PDF]](https://img.yumpu.com/19126766/1/190x245/homeowners-guide-to-japanese-knotweed-control-pdf.jpg?quality=85)