Vegetated roofs for stormwater management at multiple spatial scales
Vegetated roofs for stormwater management at multiple spatial scales
Vegetated roofs for stormwater management at multiple spatial scales

Create successful ePaper yourself
Turn your PDF publications into a flip-book with our unique Google optimized e-Paper software.
Abstract<br />
Landscape and Urban Planning xxx (2006) xxx–xxx<br />
<strong>Veget<strong>at</strong>ed</strong> <strong>roofs</strong> <strong>for</strong> <strong>stormw<strong>at</strong>er</strong> <strong>management</strong> <strong>at</strong> <strong>multiple</strong> sp<strong>at</strong>ial <strong>scales</strong><br />
Timothy Carter a,∗ , C. Rhett Jackson b<br />
a Institute of Ecology, University of Georgia, Athens, GA 30606, USA<br />
b Warnell School of Forest Resources, 114 Forest Resources, University of Georgia, Athens, GA 30606, USA<br />
Received 1 March 2006; received in revised <strong>for</strong>m 17 May 2006; accepted 22 June 2006<br />
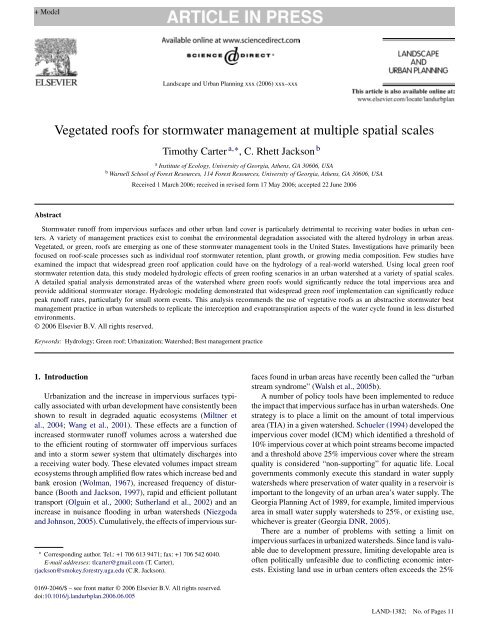
Stormw<strong>at</strong>er runoff from impervious surfaces and other urban land cover is particularly detrimental to receiving w<strong>at</strong>er bodies in urban centers.<br />
A variety of <strong>management</strong> practices exist to comb<strong>at</strong> the environmental degrad<strong>at</strong>ion associ<strong>at</strong>ed with the altered hydrology in urban areas.<br />
<strong>Veget<strong>at</strong>ed</strong>, or green, <strong>roofs</strong> are emerging as one of these <strong>stormw<strong>at</strong>er</strong> <strong>management</strong> tools in the United St<strong>at</strong>es. Investig<strong>at</strong>ions have primarily been<br />
focused on roof-scale processes such as individual roof <strong>stormw<strong>at</strong>er</strong> retention, plant growth, or growing media composition. Few studies have<br />
examined the impact th<strong>at</strong> widespread green roof applic<strong>at</strong>ion could have on the hydrology of a real-world w<strong>at</strong>ershed. Using local green roof<br />
<strong>stormw<strong>at</strong>er</strong> retention d<strong>at</strong>a, this study modeled hydrologic effects of green roofing scenarios in an urban w<strong>at</strong>ershed <strong>at</strong> a variety of sp<strong>at</strong>ial <strong>scales</strong>.<br />
A detailed sp<strong>at</strong>ial analysis demonstr<strong>at</strong>ed areas of the w<strong>at</strong>ershed where green <strong>roofs</strong> would significantly reduce the total impervious area and<br />
provide additional <strong>stormw<strong>at</strong>er</strong> storage. Hydrologic modeling demonstr<strong>at</strong>ed th<strong>at</strong> widespread green roof implement<strong>at</strong>ion can significantly reduce<br />
peak runoff r<strong>at</strong>es, particularly <strong>for</strong> small storm events. This analysis recommends the use of veget<strong>at</strong>ive <strong>roofs</strong> as an abstractive <strong>stormw<strong>at</strong>er</strong> best<br />
<strong>management</strong> practice in urban w<strong>at</strong>ersheds to replic<strong>at</strong>e the interception and evapotranspir<strong>at</strong>ion aspects of the w<strong>at</strong>er cycle found in less disturbed<br />
environments.<br />
© 2006 Elsevier B.V. All rights reserved.<br />
Keywords: Hydrology; Green roof; Urbaniz<strong>at</strong>ion; W<strong>at</strong>ershed; Best <strong>management</strong> practice<br />
1. Introduction<br />
Urbaniz<strong>at</strong>ion and the increase in impervious surfaces typically<br />
associ<strong>at</strong>ed with urban development have consistently been<br />
shown to result in degraded aqu<strong>at</strong>ic ecosystems (Miltner et<br />
al., 2004; Wang et al., 2001). These effects are a function of<br />
increased <strong>stormw<strong>at</strong>er</strong> runoff volumes across a w<strong>at</strong>ershed due<br />
to the efficient routing of <strong>stormw<strong>at</strong>er</strong> off impervious surfaces<br />
and into a storm sewer system th<strong>at</strong> ultim<strong>at</strong>ely discharges into<br />
a receiving w<strong>at</strong>er body. These elev<strong>at</strong>ed volumes impact stream<br />
ecosystems through amplified flow r<strong>at</strong>es which increase bed and<br />
bank erosion (Wolman, 1967), increased frequency of disturbance<br />
(Booth and Jackson, 1997), rapid and efficient pollutant<br />
transport (Olguin et al., 2000; Sutherland et al., 2002) and an<br />
increase in nuisance flooding in urban w<strong>at</strong>ersheds (Niezgoda<br />
and Johnson, 2005). Cumul<strong>at</strong>ively, the effects of impervious sur-<br />
∗ Corresponding author. Tel.: +1 706 613 9471; fax: +1 706 542 6040.<br />
E-mail addresses: tlcarter@gmail.com (T. Carter),<br />
rjackson@smokey.<strong>for</strong>estry.uga.edu (C.R. Jackson).<br />
0169-2046/$ – see front m<strong>at</strong>ter © 2006 Elsevier B.V. All rights reserved.<br />
doi:10.1016/j.landurbplan.2006.06.005<br />
faces found in urban areas have recently been called the “urban<br />
stream syndrome” (Walsh et al., 2005b).<br />
A number of policy tools have been implemented to reduce<br />
the impact th<strong>at</strong> impervious surface has in urban w<strong>at</strong>ersheds. One<br />
str<strong>at</strong>egy is to place a limit on the amount of total impervious<br />
area (TIA) in a given w<strong>at</strong>ershed. Schueler (1994) developed the<br />
impervious cover model (ICM) which identified a threshold of<br />
10% impervious cover <strong>at</strong> which point streams become impacted<br />
and a threshold above 25% impervious cover where the stream<br />
quality is considered “non-supporting” <strong>for</strong> aqu<strong>at</strong>ic life. Local<br />
governments commonly execute this standard in w<strong>at</strong>er supply<br />
w<strong>at</strong>ersheds where preserv<strong>at</strong>ion of w<strong>at</strong>er quality in a reservoir is<br />
important to the longevity of an urban area’s w<strong>at</strong>er supply. The<br />
Georgia Planning Act of 1989, <strong>for</strong> example, limited impervious<br />
area in small w<strong>at</strong>er supply w<strong>at</strong>ersheds to 25%, or existing use,<br />
whichever is gre<strong>at</strong>er (Georgia DNR, 2005).<br />
There are a number of problems with setting a limit on<br />
impervious surfaces in urbanized w<strong>at</strong>ersheds. Since land is valuable<br />
due to development pressure, limiting developable area is<br />
often politically unfeasible due to conflicting economic interests.<br />
Existing land use in urban centers often exceeds the 25%<br />
LAND-1382; No. of Pages 11
2 T. Carter, C.R. Jackson / Landscape and Urban Planning xxx (2006) xxx–xxx<br />
impervious threshold. Finally, the TIA threshold approach tre<strong>at</strong>s<br />
all impervious surface areas equally. Researchers have used the<br />
metric of “connected” or “effective” impervious surface area<br />
(EIA) to describe the aspects of impervious cover which drain<br />
directly into a storm sewer system (Alley and Veenhuis, 1983).<br />
EIA is more closely correl<strong>at</strong>ed to elev<strong>at</strong>ed pollutant loads (H<strong>at</strong>t<br />
et al., 2004), elimin<strong>at</strong>ion of sensitive taxa of macroinvertebr<strong>at</strong>es<br />
(Walsh, 2004) and a better explan<strong>at</strong>ory variable <strong>for</strong> an endangered<br />
fish species (Walsh et al., 2004) than TIA.<br />
An altern<strong>at</strong>ive approach to limiting impervious area has been<br />
instituted through the N<strong>at</strong>ional Pollutant Discharge Elimin<strong>at</strong>ion<br />
System (NPDES) permitting requirements under the Clean<br />
W<strong>at</strong>er Act. This str<strong>at</strong>egy encourages <strong>stormw<strong>at</strong>er</strong> managers to<br />
reduce the environmental impact of <strong>stormw<strong>at</strong>er</strong> from impervious<br />
surfaces through the use of <strong>stormw<strong>at</strong>er</strong> best <strong>management</strong><br />
practices (BMPs). Stormw<strong>at</strong>er BMPs are primarily designed to<br />
lessen the impact of development on receiving w<strong>at</strong>er bodies in<br />
urban or urbanizing areas through increasing <strong>stormw<strong>at</strong>er</strong> storage<br />
areas across a w<strong>at</strong>ershed, slowing the flow of w<strong>at</strong>er into a<br />
receiving w<strong>at</strong>er body, and/or replacing impervious surfaces with<br />
pervious areas th<strong>at</strong> allow <strong>for</strong> <strong>stormw<strong>at</strong>er</strong> infiltr<strong>at</strong>ion. This last<br />
option functions to reduce the amount of TIA in the w<strong>at</strong>ershed.<br />
In highly urbanized w<strong>at</strong>ersheds, the amount of land available<br />
exclusively <strong>for</strong> <strong>stormw<strong>at</strong>er</strong> BMPs is limited, thus cre<strong>at</strong>ing<br />
a need <strong>for</strong> land uses th<strong>at</strong> serve <strong>multiple</strong> purposes. This involves<br />
designing buildings, parking lots and roads th<strong>at</strong> not only serve<br />
the needs of the human popul<strong>at</strong>ion, but also per<strong>for</strong>m <strong>stormw<strong>at</strong>er</strong><br />
<strong>management</strong> functions. Although rooftops constitute a significant<br />
portion of impervious area particularly in highly urbanized<br />
w<strong>at</strong>ersheds, until recently they have been overlooked as avenues<br />
<strong>for</strong> <strong>stormw<strong>at</strong>er</strong> <strong>management</strong> in the United St<strong>at</strong>es. Recent studies<br />
have begun to document how the use of thin-layered veget<strong>at</strong>ed<br />
roof systems allows <strong>for</strong> rooftops to function both as a<br />
structural component of the building envelope, but also as a<br />
<strong>stormw<strong>at</strong>er</strong> <strong>management</strong> tool (Mentens et al., in press). These<br />
studies primarily look <strong>at</strong> plant growth (Emilsson and Rolf, 2005;<br />
Monterusso et al., 2005), optimal growing substr<strong>at</strong>e characteristics<br />
(Denardo et al., 2003), or the <strong>stormw<strong>at</strong>er</strong> retention of small<br />
green roof test plots (VanWoert et al., 2005) to cre<strong>at</strong>e per<strong>for</strong>mance<br />
standards <strong>for</strong> individual green roof systems.<br />
Evalu<strong>at</strong>ing green roof <strong>stormw<strong>at</strong>er</strong> retention <strong>at</strong> the roof scale<br />
is a valuable first step in determining green roof applic<strong>at</strong>ion<br />
as a <strong>stormw<strong>at</strong>er</strong> BMP. Another important tool <strong>for</strong> <strong>stormw<strong>at</strong>er</strong><br />
managers is to know how green <strong>roofs</strong> can be incorpor<strong>at</strong>ed into<br />
a <strong>stormw<strong>at</strong>er</strong> <strong>management</strong> plan in a developed or developing<br />
w<strong>at</strong>ershed. This involves modeling w<strong>at</strong>ershed responses to hypothetical<br />
roof greening scenarios. Villarreal et al. (2004) demonstr<strong>at</strong>ed<br />
how green <strong>roofs</strong> could be used to increase <strong>stormw<strong>at</strong>er</strong><br />
runoff storage as part of an inner city urban <strong>stormw<strong>at</strong>er</strong> retrofit<br />
project in Sweden. Investig<strong>at</strong>ions <strong>at</strong> a range of sp<strong>at</strong>ial <strong>scales</strong>,<br />
from individual <strong>roofs</strong> to entire w<strong>at</strong>ersheds, can provide comprehensive<br />
guidance <strong>for</strong> effective ways to establish green <strong>roofs</strong> as<br />
a viable urban <strong>stormw<strong>at</strong>er</strong> BMP.<br />
This study examines the effects th<strong>at</strong> veget<strong>at</strong>ed, or green,<br />
<strong>roofs</strong> can have on <strong>stormw<strong>at</strong>er</strong> runoff volumes <strong>at</strong> a variety of<br />
sp<strong>at</strong>ial <strong>scales</strong> in a highly urbanized w<strong>at</strong>ershed in the Piedmont<br />
region of Georgia, USA. Our primary goal was to determine<br />
wh<strong>at</strong> the effect of widespread roof greening would be on the<br />
hydrology of a real-world urban w<strong>at</strong>ershed using runoff d<strong>at</strong>a<br />
from an established green roof system. The change in hydrology<br />
was investig<strong>at</strong>ed <strong>at</strong> four sp<strong>at</strong>ial <strong>scales</strong> to account <strong>for</strong> land use<br />
diversity within the w<strong>at</strong>ershed. We also modeled the <strong>stormw<strong>at</strong>er</strong><br />
outflow of the receiving w<strong>at</strong>er body under hypothetical roof<br />
greening scenarios to determine the effect th<strong>at</strong> roof greening has<br />
on the flow regime of an urban stream system. Finally, we examined<br />
how widespread green roof implement<strong>at</strong>ion may be used<br />
to accomplish st<strong>at</strong>ewide <strong>stormw<strong>at</strong>er</strong> <strong>management</strong> goals.<br />
2. M<strong>at</strong>erials and methods<br />
2.1. Study site<br />
The Tanyard Branch w<strong>at</strong>ershed in Athens, Georgia was<br />
selected as the test site <strong>for</strong> the sp<strong>at</strong>ial analysis and hydrologic<br />
modeling. Athens is loc<strong>at</strong>ed in northeast Georgia, approxim<strong>at</strong>ely<br />
100 km east of Atlanta. This region of Georgia averages approxim<strong>at</strong>ely<br />
123.2 cm of rainfall per year with March typically having<br />
the highest total rainfall. This 237 ha w<strong>at</strong>ershed encompasses<br />
much of the University of Georgia as well as the urban center of<br />
Athens. W<strong>at</strong>er quality sampling and physical habit<strong>at</strong> assessment<br />
has revealed the second order stream system has been neg<strong>at</strong>ively<br />
impacted by the effects of urbaniz<strong>at</strong>ion (Herbert et al., 2003).<br />
A green roof test plot was established on the Boyd Gradu<strong>at</strong>e<br />
Studies building in October 2003 on the campus of the University<br />
of Georgia. The test plot uses an engineered system from<br />
American Hydrotech, Inc., primarily comprised of loose-laid<br />
synthetic specialized layers underne<strong>at</strong>h the growing media and<br />
plant m<strong>at</strong>erial. This growing media is a blend of 55% Stalite<br />
expanded sl<strong>at</strong>e, 30% USGA sand, and 15% organic m<strong>at</strong>ter composed<br />
primarily of worm castings. This media has a bulk density<br />
of 1.508 g/cm 3 and the total porosity is 50.6%. The soil mix was<br />
spread to a depth of 7.62 cm across the plot. Six drought-tolerant<br />
plant species were selected <strong>for</strong> their ability to survive low nutrient<br />
conditions and extreme temper<strong>at</strong>ure fluctu<strong>at</strong>ions found <strong>at</strong><br />
the roof surface. The species included Sedum album “Murale”,<br />
Sedum album “Jellybean”, Sedum kamtsch<strong>at</strong>icum, Sedum sexangulare,<br />
Delosperma nubigenum, and Delosperma cooperi. The<br />
plants were supplied as 3.4 cm × 3.4 cm × 6.25 cm plugs which<br />
were planted in the growing media <strong>at</strong> a density of 50 plants/m 2 .<br />
A rainfall-runoff rel<strong>at</strong>ionship <strong>for</strong> the green roof system was<br />
established using 31 storm events over the time period of November<br />
2003–2004. This <strong>stormw<strong>at</strong>er</strong> retention per<strong>for</strong>mance d<strong>at</strong>a was<br />
used to develop a curve number (CN) of 86 <strong>for</strong> this green roof<br />
system. A detailed analysis of the methods and results from this<br />
green roof per<strong>for</strong>mance study is currently in press (Carter and<br />
Rasmussen, in press).<br />
2.2. W<strong>at</strong>ershed applic<strong>at</strong>ion<br />
To establish how widespread green roof per<strong>for</strong>mance could<br />
affect the hydrology in the Tanyard Branch w<strong>at</strong>ershed, detailed<br />
sp<strong>at</strong>ial analysis was per<strong>for</strong>med and hydrologic modeling methods<br />
were employed. The sp<strong>at</strong>ial analysis was done using<br />
ArcView 3.2, a commonly used geographic in<strong>for</strong>m<strong>at</strong>ion system
(GIS) software package (ESRI, 1999). A 2003 full color aerial<br />
photographs with 0.15 m pixel resolution were obtained from<br />
the city of Athens. From these photographs, the land coverage<br />
in the w<strong>at</strong>ershed was digitized <strong>at</strong> a scale of 1:500 (Fig. 1). Land<br />
uses were classified as <strong>roofs</strong>, fl<strong>at</strong> <strong>roofs</strong>, roads, parking, sidewalks,<br />
sport fields, or landscaping. Ground-truthing was also<br />
per<strong>for</strong>med where the authors randomly selected parcels on the<br />
aerial photographs and drove to those parcels to ensure the land<br />
use classific<strong>at</strong>ions were accur<strong>at</strong>e. Total impervious area (TIA)<br />
as well as existing pervious areas (landscaping) were then calcul<strong>at</strong>ed<br />
based on the digitized land coverages. This detailed sp<strong>at</strong>ial<br />
in<strong>for</strong>m<strong>at</strong>ion allowed <strong>for</strong> different green roofing scenarios to be<br />
explored across the w<strong>at</strong>ershed.<br />
2.3. Stormw<strong>at</strong>er runoff modeling<br />
The Soil Conserv<strong>at</strong>ion Service (SCS) curve number method<br />
was the infiltr<strong>at</strong>ion and runoff model chosen due to its simplicity<br />
and widespread use amongst engineers and w<strong>at</strong>ershed<br />
managers. SCS has developed CN values <strong>for</strong> land uses according<br />
to their runoff characteristics. This method is also recommended<br />
T. Carter, C.R. Jackson / Landscape and Urban Planning xxx (2006) xxx–xxx 3<br />
Fig. 1. Tanyard branch w<strong>at</strong>ershed impervious cover and stream network.<br />
in the Georgia Stormw<strong>at</strong>er Management Manual <strong>for</strong> use in urban<br />
w<strong>at</strong>ersheds of the size of our study area (ARC, 2001). Impervious<br />
areas were assigned a CN of 98. A CN of 84 was used <strong>for</strong><br />
land uses classified as landscaping. The experimentally derived<br />
CN of 86 was used <strong>for</strong> green <strong>roofs</strong>.<br />
Runoff modeling was also per<strong>for</strong>med using StormNet<br />
Builder, a <strong>stormw<strong>at</strong>er</strong> modeling software package which uses<br />
EPAs SWMM 5.0 analysis engine and CN infiltr<strong>at</strong>ion method <strong>for</strong><br />
routing runoff through a w<strong>at</strong>ershed (Boss Intern<strong>at</strong>ional, 2005).<br />
For this w<strong>at</strong>ershed routing model, we used five drainage areas<br />
as deline<strong>at</strong>ed <strong>for</strong> the composite CNs and land cover as deline<strong>at</strong>ed<br />
from the aerial photographs. The stormflow was routed<br />
between each subw<strong>at</strong>ershed using Kinem<strong>at</strong>ic Wave routing and<br />
the Manning equ<strong>at</strong>ion. Model storm events used a type II rainfall<br />
distribution <strong>for</strong> various 24 h design storms. Runoff was modeled<br />
in 15 min time steps over a 2-day period. This allowed <strong>for</strong> total<br />
outflow volumes and peak flows to be established under the different<br />
w<strong>at</strong>ershed development scenarios.<br />
Composite CNs were then established <strong>for</strong> different roof<br />
greening scenarios in the w<strong>at</strong>ershed using the sp<strong>at</strong>ial in<strong>for</strong>m<strong>at</strong>ion<br />
compiled in ArcView and the CNs <strong>for</strong> each land use type.
4 T. Carter, C.R. Jackson / Landscape and Urban Planning xxx (2006) xxx–xxx<br />
The percentage of a particular land use was multiplied by the CN<br />
<strong>for</strong> th<strong>at</strong> land use to get a single weighted CN <strong>for</strong> the evalu<strong>at</strong>ed<br />
drainage area. The changes in <strong>stormw<strong>at</strong>er</strong> volume were modeled<br />
<strong>for</strong> three scenarios: existing land cover, all <strong>roofs</strong> greened,<br />
and all fl<strong>at</strong> <strong>roofs</strong> greened. Five design storm volumes were modeled:<br />
a small storm event of 1.27 cm, the Georgia Stormw<strong>at</strong>er<br />
Manual’s w<strong>at</strong>er quality event of 3.05 cm, the 1-year–24 h event<br />
of 7.92 cm, the 25-year–24 h event of 15.85 cm, and the 100year–24<br />
h event of 19.51 cm. Analysis focused on the smaller<br />
storm events as their runoff characteristics have been shown to<br />
be most gre<strong>at</strong>ly affected by impervious surface cover which is<br />
directly connected to the stream system (Walsh et al., 2005b).<br />
Composite CNs were also developed <strong>at</strong> four sp<strong>at</strong>ial <strong>scales</strong>:<br />
total w<strong>at</strong>ershed, subw<strong>at</strong>ershed, zoning, and parcel (Fig. 2). The<br />
total w<strong>at</strong>ershed scale evalu<strong>at</strong>es all of the land in the Tanyard<br />
Branch w<strong>at</strong>ershed as one drainage area. Subw<strong>at</strong>ersheds were<br />
deline<strong>at</strong>ed using a w<strong>at</strong>ershed deline<strong>at</strong>ion extension in ArcView<br />
(Olivera, 2005). The five resulting subw<strong>at</strong>ersheds were identified<br />
<strong>for</strong> individual analysis. Zoning maps were obtained from<br />
the city of Athens and each zoning block was deline<strong>at</strong>ed and<br />
analyzed. Finally, five parcels were randomly selected within<br />
each zoning block. The land area containing the University of<br />
Georgia is not subdivided into parcels and there<strong>for</strong>e no parcel<br />
analysis was done on campus property. In the other zones, however,<br />
the parcels were evalu<strong>at</strong>ed individually <strong>for</strong> their <strong>stormw<strong>at</strong>er</strong><br />
contribution.<br />
3. Results<br />
3.1. Sp<strong>at</strong>ial analysis<br />
Fig. 2. Four sp<strong>at</strong>ial <strong>scales</strong> used <strong>for</strong> CN modeling (subw<strong>at</strong>ersheds are numbered).<br />
Sp<strong>at</strong>ial analysis revealed th<strong>at</strong> 53.8% of the Tanyard Branch<br />
w<strong>at</strong>ershed is covered in impervious surface. As the level of sp<strong>at</strong>ial<br />
resolution increases, the amount of imperviousness becomes<br />
more widely varied between the drainage areas. Areas zoned residential<br />
ranged from 35% to 45% TIA while commercial areas<br />
fell between 54% and 78% TIA. When evalu<strong>at</strong>ing the commercial<br />
parcel land coverage, however, the range of TIA swung<br />
widely from a high of just over 92% TIA to a low of around<br />
17% TIA (see Appendix A <strong>for</strong> complete list).<br />
Roofs accounted <strong>for</strong> 15.9% of the total land cover and 29.5%<br />
of impervious surfaces in the w<strong>at</strong>ershed. When evalu<strong>at</strong>ed <strong>at</strong> the
Fig. 3. Total impervious area (TIA) according to zoning class. Key: C-D, commercial<br />
downtown; C-G, commercial general; G, government; C-O, commercial<br />
office; RM-1, mixed density residential (16 U/0.4 ha); RM-2, mixed density residential<br />
(24 U/0.4 ha); RS-5, single family residential (6 U/0.4 ha); RS-8, single<br />
family residential (4 U/0.4 ha).<br />
zoning level, rooftops constitute less proportion of the TIA in<br />
commercial areas versus residential areas, although the amount<br />
of fl<strong>at</strong> <strong>roofs</strong> in the commercial and downtown areas are significantly<br />
higher than in areas zoned residential. Parcel d<strong>at</strong>a again<br />
showed a wide range of rooftop impervious area in the commercial<br />
areas with coverage ranging from 0% to 89% of the total<br />
impervious area in the parcels. Rooftops in single family residential<br />
areas are nearly always the largest amount of impervious<br />
surface in the parcel and often over 65% of the TIA in the parcel.<br />
Slightly under half of the <strong>roofs</strong> in the w<strong>at</strong>ershed (47%) are fl<strong>at</strong><br />
<strong>roofs</strong>. Fl<strong>at</strong> rooftops are concentr<strong>at</strong>ed in the downtown and commercial<br />
areas constituting anywhere from 25% to 85% of the<br />
rooftop coverage in these areas. As expected, residential zones<br />
contained few fl<strong>at</strong> <strong>roofs</strong> with zones ranging from slightly over<br />
8% to 0% fl<strong>at</strong> rooftop coverage.<br />
At the zoning scale, reductions in TIA are evident with both<br />
roof greening scenarios depending on the zoning class (Fig. 3).<br />
In some residential cases, greening all the rooftops drops the<br />
TIA from above 37% to below 20%. This drop would change<br />
the area from a “non-supporting” w<strong>at</strong>ershed to one th<strong>at</strong> was simply<br />
“impacted” according to the impervious cover model (CWP,<br />
2003). Other zoning areas show significant differences in TIA<br />
reduction depending on whether all <strong>roofs</strong> are greened or only fl<strong>at</strong><br />
<strong>roofs</strong> are greened. Commercial-downtown (c-d), commercialgeneral<br />
(c-g), and government (g) have the largest potential <strong>for</strong><br />
TIA reduction if only fl<strong>at</strong> <strong>roofs</strong> are considered as viable candid<strong>at</strong>es<br />
<strong>for</strong> greening.<br />
3.2. CN modeling<br />
T. Carter, C.R. Jackson / Landscape and Urban Planning xxx (2006) xxx–xxx 5<br />
Complete runoff values <strong>for</strong> all five design storms from existing<br />
land use and both roof greening scenarios are found in<br />
Tables 1 and 2. As design storms increase in size, runoff volumes<br />
increase and concomitant volume reductions from green<br />
roof scenarios are diminished. This expected decline in retentionTable 1<br />
Runoff volume <strong>for</strong> existing <strong>roofs</strong> and all green roof scenarios in hectare meters from five design storms with % change in parenthesis<br />
1.27 cm 3.05 cm 7.92 cm 15.85 cm 19.51 cm<br />
Existing All green Existing All green Existing All green Existing All green Existing All green<br />
Tanyard branch w<strong>at</strong>ershed 0.481 0.304 (−36.8) 3.194 2.653 (−16.9) 13.421 12.403 (−7.6) 31.590 30.301 (−4.1) 40.126 38.774 (−3.4%)<br />
Subw<strong>at</strong>ershed 1 0.240 0.149 (−37.9) 1.601 1.322 (−17.4) 6.735 6.206 (−7.8) 15.855 15.186 (−4.2) 20.140 19.437 (−3.5)<br />
Subw<strong>at</strong>ershed 2 0.041 0.028 (−31.2) 0.281 0.240 (−14.0) 1.190 1.116 (−6.2) 2.812 2.719 (−3.3) 3.575 3.476 (−2.8)<br />
Subw<strong>at</strong>ershed 3 0.033 0.020 (−36.3) 0.189 0.156 (−17.3) 0.750 0.692 (−7.8) 1.730 1.658 (−4.2) 2.188 2.113 (−3.4)<br />
Subw<strong>at</strong>ershed 4 0.119 0.076 (−36.1) 0.654 0.540 (−17.4) 2.521 2.324 (−7.8) 5.760 5.519 (−4.2) 7.272 7.021 (−3.4)<br />
Subw<strong>at</strong>ershed 5 0.071 0.046 (−35.9) 0.528 0.444 (−15.9) 2.32 2.155 (−7.1) 5.547 5.335 (−3.8) 7.068 6.844 (−3.2)<br />
Zoning<br />
Government (University) 0.222 0.144 (−34.6) 1.239 1.025 (−16.6) 4.776 4.420 (−7.4) 10.933 10.498 (−4.0) 13.810 13.357 (−3.3)<br />
Commercial downtown 0.112 0.062 (−45.1) 0.498 0.382 (−23.4) 1.744 1.558 (−10.6) 3.849 3.630 (−5.7) 4.828 4.602 (−4.7)<br />
Commercial general 0.043 0.029 (−32.3) 0.217 0.183 (−15.7) 0.811 0.753 (−7.0) 1.830 1.762 (−3.7) 2.304 2.235 (−3.1)<br />
Commercial office 0.061 0.039 (−34.3) 0.396 0.334 (−15.7) 1.655 1.539 (−7.0) 3.889 3.742 (−3.8) 4.937 4.784 (−3.1)<br />
Mixed density residential (16 U/0.4 ha) 0.053 0.033 (−38.6) 0.417 0.346 (−16.9) 1.873 1.731 (−7.6) 4.509 4.324 (−4.1) 5.753 5.559 (−3.4)<br />
Mixed density residential (24 U/0.4 ha) 0.028 0.017 (−35.4) 0.239 0.204 (−14.7) 1.124 1.050 (−6.5) 2.747 2.651 (−3.5) 3.516 3.414 (−2.9)<br />
Single family residential (6 U/0.4 ha) 0.006 0.003 (−47.0) 0.053 0.042 (−19.9) 0.251 0.228 (−8.9) 0.616 0.586 (−4.9) 0.789 0.757 (−4.0)<br />
Single family residential (4 U/0.4 ha) 0.023 0.013 (−40.0) 0.223 0.187 (−16.2) 1.086 1.008 (−7.2) 2.691 2.586 (−3.9) 3.454 3.342 (−3.2)
6 T. Carter, C.R. Jackson / Landscape and Urban Planning xxx (2006) xxx–xxx<br />
Table 2<br />
Runoff volume in hectare–meters <strong>for</strong> existing <strong>roofs</strong> and fl<strong>at</strong> green roof scenarios from five design storms with % change in parenthesis<br />
1.27 cm 3.05 cm 7.92 cm 15.85 cm 19.51 cm<br />
Existing All fl<strong>at</strong> green Existing All fl<strong>at</strong> green Existing All fl<strong>at</strong> green Existing All fl<strong>at</strong> green Existing All fl<strong>at</strong> green<br />
Tanyard branch w<strong>at</strong>ershed 0.481 0.391 (−18.9) 3.194 2.928 (−8.3) 13.421 12.935 (−3.6) 31.590 30.983 (−1.9) 40.126 39.490 (−1.6)<br />
Subw<strong>at</strong>ershed 1 0.240 0.193 (−19.9) 1.601 1.461 (−8.7) 6.735 6.477 (−3.8) 15.855 15.532 (−2.0) 20.140 19.802 (−1.7)<br />
Subw<strong>at</strong>ershed 2 0.041 0.038 (−7.7) 0.281 0.270 (−3.3) 1.190 1.174 (−1.4) 2.812 2.792 (−0.7) 3.575 3.553 (−0.6)<br />
Subw<strong>at</strong>ershed 3 0.033 0.020 (−36.3) 0.189 0.156 (−17.3) 0.750 0.692 (−7.8) 1.730 1.658 (−4.2) 2.188 2.113 (−3.4)<br />
Subw<strong>at</strong>ershed 4 0.119 0.089 (−24.9) 0.654 0.577 (−11.7) 2.521 2.392 (−5.1) 5.760 5.603 (−2.7) 7.272 7.110 (−2.2)<br />
Subw<strong>at</strong>ershed 5 0.071 0.066 (−8.3) 0.528 0.511 (−3.4) 2.32 2.286 (−1.5) 5.547 5.503 (−0.8) 7.068 7.021 (−0.6)<br />
Zoning<br />
Government (University) 0.222 0.162 (−26.6) 1.239 1.075 (−12.5) 4.776 4.511 (−5.5) 10.933 10.611 (−2.9) 13.810 13.477 (−2.4)<br />
Commercial downtown 0.112 0.068 (−39.9) 0.498 0.397 (−20.4) 1.744 1.584 (−9.1) 3.849 3.661 (−4.9) 4.828 4.635 (−4.0)<br />
Commercial general 0.043 0.033 (−22.7) 0.217 0.194 (−10.7) 0.811 0.772 (−4.7) 1.830 1.784 (−2.5) 2.304 2.258 (−2.0)<br />
Commercial office 0.061 0.054 (−9.7) 0.396 0.379 (−4.2) 1.655 1.625 (−1.8) 3.889 3.851 (−0.9) 4.937 4.898 (−0.8)<br />
Mixed density residential (16 U/0.4 ha) 0.053 0.051 (−3.8) 0.417 0.411 (−1.5) 1.873 1.860 (−0.65) 4.509 4.493 (−0.3) 5.753 5.737 (−0.3)<br />
Mixed density residential (24 U/0.4 ha) 0.028 0.027 (−1.4) 0.239 0.238 (−0.5) 1.124 1.121 (−0.2) 2.747 2.744 (−0.1) 3.516 3.513 (−0.1)<br />
Single family residential (6 U/0.4 ha) 0.006 0.006 (0.0) 0.053 0.053 (0.0) 0.251 0.251 (0.0) 0.616 0.616 (0.0) 0.789 0.789 (0.0)<br />
Single family residential (4 U/0.4 ha) 0.023 0.023 (0.0) 0.223 0.223 (0.0) 1.086 1.086 (0.0) 2.691 2.691 (−0.0) 3.454 3.454 (0.0)<br />
results from the green roof reaching field capacity then quickly<br />
releasing the excess rainfall from larger storm events similar to<br />
conventional <strong>roofs</strong>.<br />
The composite CN <strong>for</strong> existing land use <strong>at</strong> the w<strong>at</strong>ershed scale<br />
is 92 corresponding to 2.35 cm of storage volume across the<br />
w<strong>at</strong>ershed according to the SCS model. For this condition, the<br />
smallest design storm of 1.27 cm produces 0.481 ha m of runoff.<br />
When all the <strong>roofs</strong> in the w<strong>at</strong>ershed are greened, the composite<br />
CN is reduced to 90 and the runoff volume <strong>for</strong> the 1.27 cm<br />
storm event drops to 0.304 ha m. This is a 36.9% reduction in<br />
runoff volume. When only fl<strong>at</strong> <strong>roofs</strong> are greened, the resulting<br />
composite CN is 91 and the runoff volume <strong>for</strong> the 1.27 cm storm<br />
event is 0.391 ha m, an 18.9% reduction in runoff volume (see<br />
Appendix B <strong>for</strong> complete CN breakdowns).<br />
Using the existing land use CN <strong>for</strong> the largest design storm<br />
of 19.51 cm produces 40.126 ha m of runoff. When all the <strong>roofs</strong><br />
in the w<strong>at</strong>ershed are greened, the runoff volume <strong>for</strong> this design<br />
storm drops to 38.774 ha m, a 3.4% reduction in volume. When<br />
only fl<strong>at</strong> <strong>roofs</strong> are greened, the runoff volume <strong>for</strong> this design<br />
storm is 39.490 ha m, a 1.6% reduction in volume. Disaggreg<strong>at</strong>ing<br />
CN analysis <strong>at</strong> the four sp<strong>at</strong>ial <strong>scales</strong> results in gre<strong>at</strong>er<br />
fluctu<strong>at</strong>ions in runoff volumes according to w<strong>at</strong>ershed loc<strong>at</strong>ion<br />
and amount of TIA found in each grouping. At the subw<strong>at</strong>ershed<br />
(SW) level the primary differences are seen when the two<br />
green roofing scenarios are compared. SWs 2 and 5 lose much of<br />
their <strong>stormw<strong>at</strong>er</strong> retention per<strong>for</strong>mance when only fl<strong>at</strong> <strong>roofs</strong> are<br />
greened, with runoff reductions lessened from 31% and 36% to<br />
7.7% and 8.3%, respectively. Conversely, SW 3 contains all fl<strong>at</strong><br />
<strong>roofs</strong> and <strong>stormw<strong>at</strong>er</strong> reductions remained consistent between<br />
the all greened and all fl<strong>at</strong> greened scenarios retaining 36% of<br />
the 1.27 cm storm event.<br />
Applying green rooftop scenarios according to zoning classific<strong>at</strong>ion<br />
resulted in further sp<strong>at</strong>ial clarific<strong>at</strong>ion than did SW. The<br />
top retention values were found <strong>for</strong> the commercial-downtown<br />
(c-d) zone where all roof greening resulted in a 45% reduction<br />
in runoff volume <strong>for</strong> the 1.27 cm storm event and nearly 40%<br />
reduction in runoff volume when only fl<strong>at</strong> <strong>roofs</strong> are greened.<br />
Although greening the c-d zone produced the largest amount of<br />
<strong>stormw<strong>at</strong>er</strong> retention <strong>for</strong> fl<strong>at</strong> roof greening, this result is masked<br />
when considering roof greening <strong>at</strong> the SW level as the entire c-d<br />
zone falls in SW 1. SW 1 ranked third in <strong>stormw<strong>at</strong>er</strong> retention<br />
volume <strong>for</strong> fl<strong>at</strong> roofing scenarios when compared with the other<br />
four subw<strong>at</strong>ersheds. C-d, commercial-general (c-g), and government<br />
(g) zoning blocks showed the most promise <strong>for</strong> roof<br />
greening under all fl<strong>at</strong> roof greening scenarios.<br />
Residential zoning blocks illustr<strong>at</strong>ed the importance of differenti<strong>at</strong>ing<br />
between fl<strong>at</strong> and pitched <strong>roofs</strong> when considering roof<br />
greening scenarios. In the case of areas zoned single-family residential<br />
(rs-5 and rs-8), <strong>stormw<strong>at</strong>er</strong> volume reductions <strong>for</strong> the all<br />
roof greened scenario was among the highest in the w<strong>at</strong>ershed<br />
<strong>at</strong> 47% and 40%, respectively. When only fl<strong>at</strong> <strong>roofs</strong> were considered<br />
<strong>for</strong> greening, retention values dropped to zero in both<br />
cases.<br />
Parcel disaggreg<strong>at</strong>ion demonstr<strong>at</strong>es the extreme vari<strong>at</strong>ion th<strong>at</strong><br />
exists even within zoning c<strong>at</strong>egories. For example, in the zoning<br />
block with the highest <strong>stormw<strong>at</strong>er</strong> retention values, c-d, one parcel<br />
retained nearly 91% of the 1.27 cm storm event as over 80%
Fig. 4. Rainfall storage provided by rooftop parcel coverage.<br />
of the site was covered in rooftop. Another parcel in the same<br />
zone, however, provided no <strong>stormw<strong>at</strong>er</strong> retention <strong>at</strong> all under<br />
either roof greening scenarios as the majority of the site was<br />
surface parking. The r<strong>at</strong>io of the amount rooftop to parcel area<br />
is important in determining how much additional rainfall storage<br />
will be provided from this green roof system. The largest<br />
amount of land area taken up by rooftops was 83% in a downtown<br />
parcel with the majority of <strong>roofs</strong> accounting <strong>for</strong> 10–30%<br />
of land area (Fig. 4).<br />
3.3. StormNet builder modeling<br />
Modeling w<strong>at</strong>ershed outflow volumes resulted in significant<br />
peak flow reductions when all rooftops were greened in the<br />
w<strong>at</strong>ershed, particularly <strong>for</strong> smaller storm events. The 1.27 cm<br />
storm event resulted in peak flow volumes of 1.62 m 3 /s <strong>for</strong> existing<br />
land uses. Greening all the <strong>roofs</strong> produced a 26% reduction<br />
in peak runoff volumes <strong>for</strong> the 1.27 cm storm resulting in peak<br />
flows of 1.19 m 3 /s (Fig. 5). Greening all the <strong>roofs</strong> also resulted<br />
in a peak flow in the 1-year, 24 h storm event which was less<br />
than the existing 2-year 24 h storm event peak flow (Fig. 6)For<br />
larger storms, there was less reduction in peak outflows, although<br />
the peak outflow of 32.97 m 3 /s from greening all the <strong>roofs</strong> <strong>for</strong><br />
the 100-year, 24 h storm was very similar to the peak outflow of<br />
Fig. 5. Peak flow <strong>for</strong> five design storms with roof greening scenarios.<br />
T. Carter, C.R. Jackson / Landscape and Urban Planning xxx (2006) xxx–xxx 7<br />
Fig. 6. W<strong>at</strong>ershed outflow <strong>for</strong> two small storms under existing and roof greening<br />
scenarios.<br />
Fig. 7. W<strong>at</strong>ershed outflow <strong>for</strong> two large storms under existing and roof greening<br />
scenarios.<br />
32.23 m 3 /s from the existing 50-year, 24 h storm (Fig. 7). Greening<br />
all fl<strong>at</strong> <strong>roofs</strong> reduced peak flows by about half as much as<br />
greening all <strong>roofs</strong>, similar to CN results <strong>for</strong> the w<strong>at</strong>ershed scenarios.<br />
Green roof implement<strong>at</strong>ion did not result in any peak<br />
flow lag times occurring across the w<strong>at</strong>ershed. There was, however,<br />
a slight increase in outflow volumes on the falling limb of<br />
the green roof hydrographs.<br />
4. Discussions and conclusions<br />
To accur<strong>at</strong>ely assess the possibility of implementing green<br />
<strong>roofs</strong> as a <strong>stormw<strong>at</strong>er</strong> BMP in an urban w<strong>at</strong>ershed, detailed<br />
sp<strong>at</strong>ial analysis needs to be undertaken to direct <strong>management</strong><br />
ef<strong>for</strong>ts. This sp<strong>at</strong>ial analysis is best accomplished <strong>at</strong> a variety of<br />
sp<strong>at</strong>ial <strong>scales</strong> to evalu<strong>at</strong>e overall project feasibility in a w<strong>at</strong>ershed<br />
context as well as individual plot-level scenarios. In the<br />
case of the Tanyard Branch w<strong>at</strong>ershed, we found high potential
8 T. Carter, C.R. Jackson / Landscape and Urban Planning xxx (2006) xxx–xxx<br />
to use existing rooftops as <strong>stormw<strong>at</strong>er</strong> runoff <strong>management</strong> tools<br />
as they constitute significant land area in the highly urbanized<br />
w<strong>at</strong>ershed. Other studies th<strong>at</strong> disaggreg<strong>at</strong>e impervious surface<br />
cover in urban areas have typically only focused on a single<br />
zoning c<strong>at</strong>egory such as residential land use and found rooftop<br />
coverage to constitute around 1/3 of the impervious surface coverage<br />
(Lee and Heaney, 2003). Our sp<strong>at</strong>ial analysis revealed<br />
slightly less proportion of rooftop impervious coverage across<br />
the w<strong>at</strong>ershed with minimal vari<strong>at</strong>ion among zoning c<strong>at</strong>egories<br />
<strong>for</strong> the amount of total rooftop coverage. These results can superficially<br />
be misleading, however as the majority of areas contain<br />
sloped rooftops which are more difficult to veget<strong>at</strong>e.<br />
When only fl<strong>at</strong> <strong>roofs</strong> are disaggreg<strong>at</strong>ed from the sp<strong>at</strong>ial d<strong>at</strong>a,<br />
<strong>at</strong> the zoning level a clear hierarchy <strong>for</strong> green roof implement<strong>at</strong>ion<br />
emerges. The impervious surface cover of three zoning<br />
c<strong>at</strong>egories is domin<strong>at</strong>ed by over 65% of fl<strong>at</strong> rooftops while the<br />
remaining five zones contain impervious areas with less than<br />
26% fl<strong>at</strong> rooftops and a median fl<strong>at</strong> roof percentage of 3.4%.<br />
The three zoning c<strong>at</strong>egories with most fl<strong>at</strong> roof space are commercial<br />
areas and area upon which the University of Georgia is<br />
loc<strong>at</strong>ed which contains many institutional buildings and large<br />
dormitories. No industrial sites are loc<strong>at</strong>ed in the w<strong>at</strong>ershed.<br />
Residential sections of the w<strong>at</strong>ershed show little opportunity <strong>for</strong><br />
fl<strong>at</strong> roof greening. If the fl<strong>at</strong> green roof scenario is considered the<br />
most practical <strong>for</strong> implement<strong>at</strong>ion, then areas zoned commercial,<br />
industrial, or institutional centers which are known to contain<br />
large fl<strong>at</strong>-roofed buildings should be targeted <strong>for</strong> retrofit install<strong>at</strong>ions.<br />
In the Tanyard Branch w<strong>at</strong>ershed, 50.6% of the land area<br />
fit into these c<strong>at</strong>egories. When low impact development modeling<br />
scenarios are only centered on residential applic<strong>at</strong>ion (see<br />
Brander et al., 2004), there is little opportunity <strong>for</strong> practical green<br />
roof implement<strong>at</strong>ion. Evalu<strong>at</strong>ing all zoning classes, however,<br />
provides a convenient scale to analyze green roof implement<strong>at</strong>ion<br />
feasibility as the distinguishing fe<strong>at</strong>ures of each zoning<br />
class are directly rel<strong>at</strong>ed to the size and shape of rooftop.<br />
Changes in hydrology due to green roofing scenarios are<br />
clearly dependent upon the size of design storm event. Even with<br />
widespread green roof install<strong>at</strong>ion, change in hydrology across<br />
the w<strong>at</strong>ershed will be minimal <strong>for</strong> storm events gre<strong>at</strong>er than the<br />
2-year, 24-h event. In Athens, however, over 60% of storm events<br />
throughout the course of a year in Athens are 1.27 cm or less and<br />
over 80% are less than 2.54 cm (Fig. 8). For these smaller events<br />
across the w<strong>at</strong>ershed, the modeled results have a more noticeable<br />
effect on recommended tre<strong>at</strong>ment volumes. For example,<br />
Fig. 8. Frequency of small storm events <strong>for</strong> Athens, GA.<br />
the Georgia Stormw<strong>at</strong>er Manual recommends interception and<br />
tre<strong>at</strong>ment of all the runoff from 85% of the storms th<strong>at</strong> occur<br />
during the course of a year. In the case of Tanyard Branch, a<br />
volumetric runoff coefficient of 0.53 is multiplied by the 85th<br />
percentile rain event (3.05 cm) giving a w<strong>at</strong>er quality volume of<br />
3.85 ha m. Green <strong>roofs</strong> would retain approxim<strong>at</strong>ely 0.54 ha m or<br />
approxim<strong>at</strong>ely 15% of the volume needed to be intercepted and<br />
tre<strong>at</strong>ed. No “tre<strong>at</strong>ment” and re-release is actually occurring on<br />
this volume, as the w<strong>at</strong>er cycle is short-circuited <strong>at</strong> the roof.<br />
At the w<strong>at</strong>ershed, subw<strong>at</strong>ershed and zoning scale, modeling<br />
widespread roof greening illustr<strong>at</strong>es a number of important<br />
consider<strong>at</strong>ions <strong>for</strong> implementing green roof systems. The additional<br />
storage provided by green <strong>roofs</strong> in this w<strong>at</strong>ershed reduces<br />
the total peak outflow volumes in the w<strong>at</strong>ershed significantly.<br />
This decline in peak flow volume reduces the frequency of the<br />
bankfull flow events which may result in changes in bankfull<br />
cross-section dimensions originally expanded during urbaniz<strong>at</strong>ion<br />
(Doll et al., 2002). For future storm sewer retrofitting<br />
options, reductions in peak flow volumes from roof greening<br />
could provide economic benefits through decreasing the sizing<br />
of culverts and pipes designed <strong>for</strong> large storm events. The volume<br />
reductions <strong>for</strong> fl<strong>at</strong> roofing scenarios will primarily come<br />
from the zones of the w<strong>at</strong>ershed where impervious areas are<br />
most directly connected to the storm sewer system. Reducing<br />
the <strong>stormw<strong>at</strong>er</strong> contribution of these impervious surfaces in the<br />
w<strong>at</strong>ershed is particularly important due to their disproportion<strong>at</strong>e<br />
influence on the health of receiving w<strong>at</strong>er bodies (Walsh et al.,<br />
2005a).<br />
Volume reductions and subsequent stormflow velocity reduction<br />
has conflicting implic<strong>at</strong>ions <strong>for</strong> pollutant transport and<br />
receiving w<strong>at</strong>er quality. The green roof retention per<strong>for</strong>mance<br />
occurs during the early stages of rainfall as the well-documented<br />
“first flush” phenomenon (Sansalone and Cristina, 2004) transports<br />
the majority of toxicants into storm sewer systems. With<br />
lower runoff velocities, larger particles to which certain pollutants<br />
are bound may not be moved into the storm sewer system<br />
during the rising limb of the storm event. Conversely, the oper<strong>at</strong>ionally<br />
dissolved fraction of pollutant loads will be transported<br />
to the system in higher concentr<strong>at</strong>ions as they move easily even<br />
with reduced volumes of runoff. The areas where roof greening<br />
will be most effective are also the areas where the largest concentr<strong>at</strong>ions<br />
of vehicular-rel<strong>at</strong>ed pollutants occur. These factors<br />
may result in a focused pulse of toxicants during the early stages<br />
of a storm event with lower runoff volumes.<br />
For individual parcels, the r<strong>at</strong>io of rooftop coverage to parcel<br />
area is the most important factor in determining where to install<br />
green roof systems. Since green <strong>roofs</strong> serve to store w<strong>at</strong>er and<br />
release it into the <strong>at</strong>mosphere through evapor<strong>at</strong>ion or transpir<strong>at</strong>ion,<br />
they function as the interception mechanism found in<br />
<strong>for</strong>ested sites. Interception values <strong>for</strong> urban <strong>for</strong>ests have been<br />
reported as 1.6% of total rainfall (Xiao and McPherson, 2002).<br />
For nearly all parcels, this interception value was met through<br />
the use of green <strong>roofs</strong> <strong>for</strong> all storms including the 100-year,<br />
24 h storm event interception value of 0.31 cm. Other <strong>management</strong><br />
goals may wish to be met <strong>at</strong> the parcel level. The initial<br />
abstraction value in the curve number method, <strong>for</strong> example, is<br />
a volume designed to replic<strong>at</strong>e interception, evapor<strong>at</strong>ion, initial
infiltr<strong>at</strong>ion, and surface depression be<strong>for</strong>e runoff begins. When<br />
<strong>roofs</strong> cover over 30% of the site, this initial abstraction value<br />
is met. Depending on the goals of the <strong>stormw<strong>at</strong>er</strong> <strong>management</strong><br />
system, various decision-making criteria can be established <strong>at</strong><br />
the parcel-level to direct implement<strong>at</strong>ion ef<strong>for</strong>ts. The strong linear<br />
correl<strong>at</strong>ion between a parcel’s rooftop impervious cover and<br />
additional w<strong>at</strong>er storage makes applic<strong>at</strong>ion of these criteria quite<br />
straight<strong>for</strong>ward.<br />
Using the Tanyard Branch w<strong>at</strong>ershed as a case study, hydrologic<br />
modeling suggests th<strong>at</strong> green <strong>roofs</strong> alone cannot solely<br />
be relied upon to provide complete <strong>stormw<strong>at</strong>er</strong> <strong>management</strong> <strong>at</strong><br />
the w<strong>at</strong>ershed scale. Other studies have examined benefits provided<br />
by a variety of source control <strong>stormw<strong>at</strong>er</strong> <strong>management</strong><br />
tools similar to green <strong>roofs</strong> <strong>at</strong> the scale of a drainage basin or<br />
jurisdictional w<strong>at</strong>ershed and found th<strong>at</strong> a combin<strong>at</strong>ion of source<br />
control <strong>management</strong> str<strong>at</strong>egies and w<strong>at</strong>er reuse techniques are<br />
more cost effective than their traditional centralized counterpart<br />
(Coombes et al., 2002). Decentralized <strong>stormw<strong>at</strong>er</strong> <strong>management</strong><br />
practices can also be used in conjuction with a tradable <strong>stormw<strong>at</strong>er</strong><br />
allowance system which produces a low-cost altern<strong>at</strong>ive<br />
to a single, centralized system (Thurston et al., 2003). To the<br />
extent th<strong>at</strong> green <strong>roofs</strong> can be incorpor<strong>at</strong>ed into a similar w<strong>at</strong>ershed<br />
<strong>management</strong> plan th<strong>at</strong> emphasizes distributed <strong>stormw<strong>at</strong>er</strong><br />
controls, they may play an important role in areas particularly<br />
constrained by existing development and infrastructure.<br />
While <strong>roofs</strong> constitute nearly 30% of the total impervious<br />
area in the Tanyard Branch w<strong>at</strong>ershed, the amount of other types<br />
of land coverage lessens the hydrologic impact of widespread<br />
roof greening <strong>at</strong> the w<strong>at</strong>ershed scale. In w<strong>at</strong>ersheds of larger<br />
metropolitan areas or industrial sites which contain a proportionally<br />
larger percentage of rooftops rel<strong>at</strong>ive to other land coverage,<br />
a different conclusion may be reached. Green <strong>roofs</strong> do have the<br />
potential to replic<strong>at</strong>e portions of the predevelopment hydrograph<br />
which may be lost after urbaniz<strong>at</strong>ion, functioning to intercept<br />
and evapor<strong>at</strong>e rainfall be<strong>for</strong>e it reaches the ground. Using green<br />
<strong>roofs</strong> <strong>for</strong> this specific task could prove extremely beneficial in<br />
highly urbanized w<strong>at</strong>ersheds where opportunities <strong>for</strong> <strong>stormw<strong>at</strong>er</strong><br />
<strong>management</strong> are lacking.<br />
Jurisdictions and urban w<strong>at</strong>ersheds which have digitized land<br />
cover and zoning maps in a GIS may evalu<strong>at</strong>e the potential<br />
<strong>stormw<strong>at</strong>er</strong> benefits from green roof implement<strong>at</strong>ion using methods<br />
similar to the ones described in this study. Applying sp<strong>at</strong>ial<br />
prioritiz<strong>at</strong>ion is extremely important to target areas where green<br />
<strong>roofs</strong> may be most effectively implemented. Examining the benefits<br />
<strong>at</strong> an appropri<strong>at</strong>e scale also can help focus green roof policy<br />
development and lessen the <strong>stormw<strong>at</strong>er</strong> impacts from drainage<br />
areas th<strong>at</strong> may be particularly detrimental to the receiving w<strong>at</strong>er<br />
body. Land coverage found in dense urban cores and commercial<br />
areas are particularly well suited to extensive green roof<br />
systems.<br />
As jurisdictions continue to look <strong>for</strong> ways to innov<strong>at</strong>ively<br />
manage their <strong>stormw<strong>at</strong>er</strong>, additional tools serve to make this<br />
duty easier. In this study, the use of green <strong>roofs</strong> <strong>for</strong> <strong>stormw<strong>at</strong>er</strong><br />
<strong>management</strong> has been shown to be an effective tool <strong>for</strong><br />
managing small storms in highly developed areas. Incorpor<strong>at</strong>ing<br />
green <strong>roofs</strong> into larger w<strong>at</strong>ershed <strong>management</strong> plans will<br />
increase flexibility <strong>for</strong> w<strong>at</strong>ershed managers to mitig<strong>at</strong>e environ-<br />
T. Carter, C.R. Jackson / Landscape and Urban Planning xxx (2006) xxx–xxx 9<br />
mentally destructive land use practices and provide a new avenue<br />
<strong>for</strong> hydrologic remedi<strong>at</strong>ion of urban w<strong>at</strong>ersheds.<br />
Acknowledgements<br />
This research was funded, in part, by the University of Georgia,<br />
Georgia Forestry Commission, and Georgia Air and Waste<br />
Management Associ<strong>at</strong>ion. Software provided by Boss Intern<strong>at</strong>ional.<br />
Appendix A<br />
TIA and RIA values are given in Table A.1.<br />
Table A.1<br />
Total percent impervious area (TIA) and rooftop impervious area (RIA) <strong>at</strong> four<br />
sp<strong>at</strong>ial <strong>scales</strong><br />
% TIA % RIA % fl<strong>at</strong> roof<br />
of RIA<br />
Tanyard branch w<strong>at</strong>ershed 53.80 15.88 46.97<br />
Subw<strong>at</strong>ershed 1 54.91 16.43 48.02<br />
Subw<strong>at</strong>ershed 2 52.17 12.95 22.29<br />
Subw<strong>at</strong>ershed 3 59.42 16.47 89.91<br />
Subw<strong>at</strong>ershed 4 56.24 16.65 65.02<br />
Subw<strong>at</strong>ershed 5<br />
Zoning<br />
47.26 14.74 20.41<br />
Government (University) 58.75 15.80 73.66<br />
Commercial downtown 77.11 23.28 85.53<br />
Parcel 1 92.31 23.01 100<br />
Parcel 2 90.38 82.84 100<br />
Parcel 3 84.47 0 0<br />
Parcel 4 69.93 2.73 0<br />
Parcel 5 63.19 10.11 100<br />
Commercial general 69.24 14.92 66.57<br />
Parcel 1 54.08 21.68 100<br />
Parcel 2 63.23 20.51 99.42<br />
Parcel 3 86.79 61.54 0<br />
Parcel 4 22.14 10.85 0<br />
Parcel 5 39.00 9.51 0<br />
Commercial office 54.12 14.69 25.27<br />
Parcel 1 59.30 37.01 0<br />
Parcel 2 29.01 23.68 0<br />
Parcel 3 17.20 5.87 0<br />
Parcel 4 32.15 13.94 0<br />
Parcel 5 58.77 21.65 0.78<br />
Mixed density residential (16 U/0.4 ha) 45.21 15.63 8.38<br />
Parcel 1 52.10 0 0<br />
Parcel 2 41.76 39.23 0<br />
Parcel 3 25.09 0 0<br />
Parcel 4 54.01 21.86 0<br />
Parcel 5 33.04 24.48 0<br />
Mixed density residential (24 U/0.4 ha) 40.32 13.34 3.36<br />
Parcel 1 31.52 0 0<br />
Parcel 2 25.14 22.47 0<br />
Parcel 3 11.24 0 0<br />
Parcel 4 33.76 15.88 0<br />
Parcel 5 0 0 0<br />
Single family residential (6 U/0.4 ha) 37.79 18.36 0
10 T. Carter, C.R. Jackson / Landscape and Urban Planning xxx (2006) xxx–xxx<br />
Table A.1 (Continued )<br />
% TIA % RIA % fl<strong>at</strong> roof<br />
of RIA<br />
Parcel 1 36.15 22.48 0<br />
Parcel 2 20.70 14.29 0<br />
Parcel 3 33.87 26.20 0<br />
Parcel 4 44.06 24.82 0<br />
Parcel 5 22.16 9.86 0<br />
Single family residential (4 U/0.4 ha) 35.19 14.59 1.10<br />
Parcel 1 30.03 23.63 0<br />
Parcel 2 29.92 14.96 0<br />
Parcel 3 20.92 17.06 0<br />
Parcel 4 29.61 21.98 0<br />
Parcel 5 21.96 21.62 0<br />
Appendix B<br />
Curve numbers are given in Table B.1.<br />
Table B.1<br />
Curve numbers (CN) <strong>for</strong> three scenarios <strong>at</strong> four sp<strong>at</strong>ial <strong>scales</strong><br />
Existing<br />
composite CN<br />
All green<br />
<strong>roofs</strong> CN<br />
Tanyard branch w<strong>at</strong>ershed 92 90 91<br />
Subw<strong>at</strong>ershed 1 92 90 91<br />
Subw<strong>at</strong>ershed 2 91 90 91<br />
Subw<strong>at</strong>ershed 3 93 91 91<br />
Subw<strong>at</strong>ershed 4 93 91 92<br />
Subw<strong>at</strong>ershed 5<br />
Zoning<br />
91 89 90<br />
Government (University) 93 91 92<br />
Commercial downtown 95 92 92<br />
Parcel 1 97 94 94<br />
Parcel 2 97 87 87<br />
Parcel 3 96 96 96<br />
Parcel 4 94 93 94<br />
Parcel 5 93 92 92<br />
Commercial general 94 92 93<br />
Parcel 1 92 89 89<br />
Parcel 2 93 90 90<br />
Parcel 3 96 89 96<br />
Parcel 4 87 86 87<br />
Parcel 5 89 88 89<br />
Commercial office 92 90 91<br />
Parcel 1 92 88 92<br />
Parcel 2 88 85 88<br />
Parcel 3 86 86 86<br />
Parcel 4 89 87 89<br />
Parcel 5 92 90 92<br />
Mixed density residential<br />
(16 U/0.4 ha)<br />
90 88 90<br />
Parcel 1 91 91 91<br />
Parcel 2 90 85 90<br />
Parcel 3 88 88 88<br />
Parcel 4 92 89 92<br />
Parcel 5 89 86 89<br />
Mixed density residential<br />
(24 U/0.4 ha)<br />
90 88 90<br />
Parcel 1 88 88 88<br />
All fl<strong>at</strong> green<br />
<strong>roofs</strong> CN<br />
Table B.1 (Continued )<br />
Existing<br />
composite CN<br />
All green<br />
<strong>roofs</strong> CN<br />
Parcel 2 88 85 88<br />
Parcel 3 86 86 86<br />
Parcel 4 89 87 89<br />
Parcel 5 84 84 84<br />
Single family residential<br />
(6 U/0.4 ha)<br />
89 87 89<br />
Parcel 1 89 86 89<br />
Parcel 2 87 85 87<br />
Parcel 3 89 86 89<br />
Parcel 4 90 87 90<br />
Parcel 5 87 86 87<br />
Single family residential<br />
(4 U/0.4 ha)<br />
89 87 89<br />
Parcel 1 88 85 88<br />
Parcel 2 88 86 88<br />
Parcel 3 87 85 87<br />
Parcel 4 88 86 88<br />
Parcel 5 87 84 87<br />
References<br />
All fl<strong>at</strong> green<br />
<strong>roofs</strong> CN<br />
Alley, W.M., Veenhuis, J.E., 1983. Effective impervious area in urban runoff<br />
modeling. J. Hydraulic Eng. 109, 313–319.<br />
Atlanta Regional Commission (ARC), 2001. Georgia Stormw<strong>at</strong>er Management<br />
Manual. Available <strong>at</strong> http://www.georgia<strong>stormw<strong>at</strong>er</strong>.com. Accessed<br />
in September 2005.<br />
Boss Intern<strong>at</strong>ional, 2005. StormNet Builder. Wisconsin, Boss Intern<strong>at</strong>ional.<br />
Booth, D.B., Jackson, C.R., 1997. Urbaniz<strong>at</strong>ion of aqu<strong>at</strong>ic systems: degrad<strong>at</strong>ion<br />
thresholds, <strong>stormw<strong>at</strong>er</strong> detection, and the limits of mitig<strong>at</strong>ion. J.<br />
Am. W<strong>at</strong>er Resour. Assoc. 33, 1077–1089.<br />
Brander, K.E., Owen, K.E., Potter, K.W., 2004. Modeled impacts of development<br />
type on runoff volume and infiltr<strong>at</strong>ion per<strong>for</strong>mance. J. Am. W<strong>at</strong>er<br />
Resour. Assoc. 40, 961–969.<br />
Carter, T.L., Rasmussen, T.C., in press. Evalu<strong>at</strong>ion of the hydrologic behavior<br />
of green <strong>roofs</strong>. J. Am. W<strong>at</strong>er Resour. Assoc.<br />
Center <strong>for</strong> W<strong>at</strong>ershed Protection (CWP), 2003. Impacts of impervious cover<br />
on aqu<strong>at</strong>ic ecosystems. W<strong>at</strong>ershed Protection Research Monograph No.<br />
1. Center <strong>for</strong> W<strong>at</strong>ershed Protection, Ellicott City, Maryland.<br />
Coombes, P.J., Kuczera, G., Kalma, J.D., Argue, J.R., 2002. An evalu<strong>at</strong>ion<br />
of the benefits of source control measures <strong>at</strong> the regional scale. Urban<br />
W<strong>at</strong>er 4, 307–320.<br />
Denardo, J.C., Jarrett, A.R., Manbeck, H.B., Be<strong>at</strong>tie, D.J., Berghage, R.D.,<br />
2003. Green Roof Mitig<strong>at</strong>ion of Stormw<strong>at</strong>er and Energy Usage. ASAE<br />
Meeting paper No. 032305. ASAE, St. Joseph, Michigan.<br />
Doll, B.A., Wise-Frederick, D.E., Buckner, C.M., Wilkerson, S.D., Harman,<br />
W.A., Smith, R.E., Spooner, J., 2002. Hydraulic geometry rel<strong>at</strong>ionships<br />
<strong>for</strong> urban Streams throughout the piedmont of North Carolina. J. Am.<br />
W<strong>at</strong>er Resour. Assoc. 38, 641–651.<br />
Emilsson, T., Rolf, K., 2005. Comparison of establishment methods <strong>for</strong> extensive<br />
green <strong>roofs</strong> in Southern Sweden. Urban For. Urban Greening 3,<br />
103–111.<br />
Environmental Systems Research Institute, Inc. (ESRI), 1999. ArcView GIS<br />
3.2 <strong>for</strong> Windows. Environmental Systems Research Institute, Inc., Redlands,<br />
CA.<br />
Georgia Department of N<strong>at</strong>ural Resources (DNR), 2005. Ga. Comp. R. &<br />
Regs r. 391-3-16.<br />
H<strong>at</strong>t, B.E., Fletcher, T.D., Walsh, C.J., Taylor, S.L., 2004. The influence of<br />
urban density and drainage infrastructure on the concentr<strong>at</strong>ions and loads<br />
of pollutants in small streams. J. Environ. Manage. 34, 112–124.<br />
Herbert, S., England, L., Buesching, J., Crowley, J., Meyer, J., Summer 2002<br />
Design Studio, 2003. Tanyard Branch: demonstr<strong>at</strong>ing an interdisciplinary
approach to the design phase of an urban stream restor<strong>at</strong>ion. In: H<strong>at</strong>cher,<br />
K.J. (Ed.), Proceedings of the 2003 Georgia W<strong>at</strong>er Resources Conference.<br />
University of Georgia, Athens, GA.<br />
Lee, J.G., Heaney, J.P., 2003. Estim<strong>at</strong>ion of urban imperviousness and its<br />
impacts on storm w<strong>at</strong>er systems. J. W<strong>at</strong>er Resourc. Planning Manage.<br />
129, 419–426.<br />
Mentens, J., Raes, D., Hermy, M., in press. Green <strong>roofs</strong> as a tool <strong>for</strong> solving<br />
the rainw<strong>at</strong>er runoff problem in the urbanized 21st century? Landscape<br />
Urban Planning.<br />
Miltner, R.J., White, D., Yoder, C., 2004. The biotic integrity of streams<br />
in urban and suburbanizing landscapes. Landscape Urban Planning 69,<br />
87–100.<br />
Monterusso, M.A., Rowe, D.B., Rugh, C.L., Russell, D.K., 2005. Establishment<br />
and persistence of Sedum spp. and n<strong>at</strong>ive taxa <strong>for</strong> green roof<br />
applic<strong>at</strong>ions. Hortscience 40, 391–396.<br />
Niezgoda, S.L., Johnson, P.A., 2005. Improving the urban stream restor<strong>at</strong>ion<br />
ef<strong>for</strong>t: identifying critical <strong>for</strong>m and processes rel<strong>at</strong>ionships. Environ.<br />
Manage. 35, 579–592.<br />
Olguin, H.F., Salibian, A., Puig, A., 2000. Comper<strong>at</strong>ive sensitivity of<br />
Scenedesmus acutus and Chlorella pyrenoidosa as sentinel organisms <strong>for</strong><br />
aqu<strong>at</strong>ic ecotoxicity assessment: studies on a highly polluted urban river.<br />
Environ. Toxicol. 15, 14–22.<br />
Olivera, F., 2005. PrePro2002 Software. Dodson & Associ<strong>at</strong>es, Inc., Houston,<br />
TX.<br />
Sansalone, J.J., Cristina, C.M., 2004. First flush concepts <strong>for</strong> suspended and<br />
dissolved solids in small impervious w<strong>at</strong>ersheds. J. Environ. Eng. 130,<br />
1301–1313.<br />
Schueler, T., 1994. The importance of imperviousness. W<strong>at</strong>ershed Protect.<br />
Tech. 3, 551–596.<br />
Sutherland, A.B., Meyer, J.L., Gardiner, E.P., 2002. Effects of land cover<br />
on sediment regime and fish assemblage structure in four southern<br />
Appalachian streams. Freshw<strong>at</strong>er Biol. 47, 1791–1805.<br />
T. Carter, C.R. Jackson / Landscape and Urban Planning xxx (2006) xxx–xxx 11<br />
Thurston, H.W., Goddard, H.C., Szlag, D., Lemberg, B., 2003. Controlling<br />
<strong>stormw<strong>at</strong>er</strong> runoff with tradable allowances <strong>for</strong> impervious surfaces. J.<br />
W<strong>at</strong>er Resour. Planning Manage. 129, 409–418.<br />
VanWoert, N.D., Rowe, D., Andresen, J., Rugh, C., Fernandez, R., Xiao, L.,<br />
2005. Green roof <strong>stormw<strong>at</strong>er</strong> retention: effects of roof surface, slope, and<br />
media depth. J. Environ. Qual. 34, 1036–1044.<br />
Villarreal, E.L., Semadeni-Davies, A., Bengtsson, L., 2004. Inner city<br />
<strong>stormw<strong>at</strong>er</strong> control using a combin<strong>at</strong>ion of best <strong>management</strong> practices.<br />
Ecol. Eng. 22, 279–298.<br />
Wang, L., Lyons, J., Kanehl, P., 2001. Impacts of urbaniz<strong>at</strong>ion on stream<br />
habit<strong>at</strong> and fish across <strong>multiple</strong> sp<strong>at</strong>ial <strong>scales</strong>. Environ. Manage. 28, 255–<br />
266.<br />
Walsh, C.J., 2004. Protection of in-stream biota from urban impacts: minimize<br />
c<strong>at</strong>chment imperviousness or improve drainage design? Marine Freshw<strong>at</strong>er<br />
Res. 55, 317–326.<br />
Walsh, C.J., Papas, P.J., Crowther, D., Sim, P.T., Yoo, J., 2004. Stormw<strong>at</strong>er<br />
drainage pipes as a thre<strong>at</strong> to a stream-dwelling amphipod of conserv<strong>at</strong>ion<br />
significance, Austrogammarus australis, in southeastern Australia. Biodiv.<br />
Conserv. 13, 781–793.<br />
Walsh, C.J., Fletcher, T.D., Ladson, A.R., 2005a. Stream restor<strong>at</strong>ion in<br />
urban c<strong>at</strong>chments through redesigning <strong>stormw<strong>at</strong>er</strong> systems: looking to<br />
the c<strong>at</strong>chment to save the stream. J. N. Am. Benthol. Soc. 24, 690–<br />
705.<br />
Walsh, C.J., Roy, A.H., Feminella, J.W., Cottingham, P.D., Groffman,<br />
P.M., Morgan, R.P., 2005b. The urban stream syndrome: current knowledge<br />
and the search <strong>for</strong> a cure. J. N. Am. Benthol. Soc. 24, 706–<br />
723.<br />
Wolman, M.G., 1967. A cycle of sediment<strong>at</strong>ion and erosion in urban river<br />
channels. Geografiska Annaler 49, 385–395.<br />
Xiao, Q., McPherson, E.G., 2002. Rainfall interception by Santa Monica’s<br />
municipal urban <strong>for</strong>est. Urban Ecosyst. 6, 291–302.