Report - Center for Coastal Resources Management - Virginia ...
Report - Center for Coastal Resources Management - Virginia ...
Report - Center for Coastal Resources Management - Virginia ...

Create successful ePaper yourself
Turn your PDF publications into a flip-book with our unique Google optimized e-Paper software.
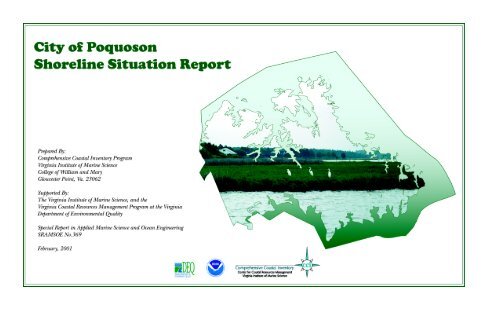
City of Poquoson<br />
Shoreline Situation <strong>Report</strong><br />
Supported by the <strong>Virginia</strong> Institute of Marine Science, Comprehensive <strong>Coastal</strong> Inventory Program, and the <strong>Virginia</strong> <strong>Coastal</strong> <strong>Resources</strong> <strong>Management</strong> Program at the Department of Environmental Quality through<br />
Grant # NA770Z0204 of the National Oceanic and Atmospheric Administration, Office of Ocean and <strong>Coastal</strong> Resource <strong>Management</strong>, under the <strong>Coastal</strong> Zone <strong>Management</strong> Act of 1972, as amended.<br />
Prepared By (in alphabetical order):<br />
Marcia Berman<br />
Harry Berquist<br />
Sharon Dewing<br />
Julie Glover<br />
Carl Hershner<br />
Tamia Rudnicky<br />
Daniel Schatt<br />
Kevin Skunda<br />
Project Supervisors:<br />
Marcia Berman - Director, Comprehensive <strong>Coastal</strong> Inventory Program<br />
Carl Hershner - Director, <strong>Center</strong> <strong>for</strong> <strong>Coastal</strong> <strong>Resources</strong> <strong>Management</strong><br />
Special <strong>Report</strong> in Applied Marine Science and Ocean Engineering No. 369 of the <strong>Virginia</strong> Institute of Marine Science<br />
February, 2001
CHAPTER I - Introduction<br />
1.1 Background<br />
In the 1970s, the <strong>Virginia</strong> Institute of Marine Science (VIMS) received a<br />
grant through the National Science Foundation’s Research Applied to National<br />
Needs Program to develop a series of reports which would describe the condition<br />
of tidal shorelines in the Commonwealth of <strong>Virginia</strong>. These reports became<br />
known as the Shoreline Situation <strong>Report</strong>s. They were published on a county by<br />
county basis with additional resources provided by the National Oceanic and<br />
Atmospheric Administration’s Office of <strong>Coastal</strong> Zone <strong>Management</strong> (Hobbs<br />
et.al., 1979).<br />
The Shoreline Situation <strong>Report</strong>s quickly became a common desktop<br />
reference <strong>for</strong> nearly all shoreline managers, regulators, and planners within the<br />
Tidewater region. They provided useful in<strong>for</strong>mation to address the common<br />
management questions and dilemmas of the time. Despite their age, these<br />
reports remain a desk top reference.<br />
The Comprehensive <strong>Coastal</strong> Inventory Program (CCI) is committed to<br />
developing a revised series of Shoreline Situation <strong>Report</strong>s which address the<br />
management questions of today. The series reports shoreline conditions on a<br />
county by county basis. <strong>Report</strong>s are distributed in hardcopy. CCI is exploring<br />
techniques <strong>for</strong> serving the publications online. Those interested should check<br />
the CCI web site periodically at www.vims.edu/ccrm/publications.html. The<br />
digital GIS coverages developed <strong>for</strong> the report are available on the web at<br />
www.vims.edu/ccrm/gis/gisdata.html.<br />
1.2 Description of the Locality<br />
The City of Poquoson includes approximately 15 square miles of land<br />
area, with nearly 5.5 square miles of major surface water (Figure 1). Poquoson<br />
resides on the geographic land mass known locally as the lower Peninsula. The<br />
city boundaries are contiguous to the the Northwest Branch of the Back River<br />
to the south, the Poquoson River to the North, the Chesapeake Bay toward the<br />
northeast, and the county of York on the southwest. The centerline of the<br />
Poquoson River divides Poquoson from York County, and the centerline of the<br />
Back River separates Poquoson from the city of Hampton. The major waterways<br />
influencing the coastal character of the city are the Back River and its<br />
Northwest Branch, the tributaries and bays draining the Poquoson River, and the<br />
Chesapeake Bay proper. Along the Chesapeake Bay shoreline Poquoson boasts<br />
extensive tidal marshes including the Plumtree Island National Wildlife Refuge.<br />
While nearly half the land mass is wetlands, the remaining land mass<br />
within the city boundaries has been significantly developed over time. Over<br />
history, development within the community has occurred from east to west, and<br />
the highest potential <strong>for</strong> growth is expected to occur in the western corner of<br />
the city over the next fifteen years. There are few remaining <strong>for</strong>ested areas in<br />
the city, and virtually no active farms. According to the 1999 Comprehensive<br />
Plan, 21 percent of the land mass remains either <strong>for</strong>ested, agriculture, or open<br />
space areas (City of Poquoson, 1999). Comprehensive planning initiatives<br />
identify the eastern section of the city to be preserved as a resource conservation<br />
area. The majority of the remaining land area is designated as low density<br />
residential development.<br />
Tidal shoreline protection is af<strong>for</strong>ded through regulations established by<br />
the Clean Water Act, and the Chesapeake Bay Preservation Act. The City of<br />
Poquoson established Resource Protection Areas (RPAs) in accordance with the<br />
Chesapeake Bay Preservation Act (100 foot buffers landward of all streams,<br />
adjoining wetlands, and related sensitive areas). Resource <strong>Management</strong> Areas<br />
(RMAs) established by the city include all other land areas not designated as an<br />
RPA of an Intensely Developed Area (IDA).<br />
1.3 Purpose and Goals<br />
This shoreline inventory has been developed as a tool <strong>for</strong> assessing<br />
conditions along the tidal shoreline in the City of Poquoson. Recent conditions<br />
are reported <strong>for</strong> three zones within the immediate riparian river area: riparian<br />
land use, bank and buffers, and the shoreline. A series of maps and tabular data<br />
are published to illustrate and quantify results of an extensive shoreline survey.<br />
The survey extends from the mouth of the Poquoson River, including Lambs<br />
Creek, Roberts Creek, Bennett Creek, White House Cove, Floyd’s Bay, Easton<br />
Cove, and Lyons Creek. Shoreline along the Chesapeake Bay was primarily<br />
surveyed using remote sensing techniques due to the shallow waters. Within<br />
Back Creek, the survey includes the primary shoreline of Back Creek, and the<br />
shoreline of High Cedar Creek, Long Creek, Fore Landing Creek, and the Northwest<br />
Branch of Back Creek. The Northwest Branch includes Topping Creek, and<br />
Cedar Creek (Figure 1).<br />
1.4 <strong>Report</strong> Organization<br />
This report is divided into several sections. Chapter 2 describes methods<br />
used to develop this inventory, along with conditions and attributes considered<br />
in the survey. Chapter 3 identifies potential applications <strong>for</strong> the data, with<br />
a focus on current management issues. From existing literature and the current<br />
survey, Chapter 4 reports the general state of the city’s shoreline, and integrates<br />
a series of maps which illustrate current conditions.<br />
1.5 Acknowledgments<br />
This report has been primarily funded by the Comprehensive <strong>Coastal</strong><br />
Inventory Program (CCI) with monies appropriated by the General Assembly.<br />
The <strong>Virginia</strong> <strong>Coastal</strong> <strong>Resources</strong> <strong>Management</strong> Program at the Department of<br />
Environmental Quality provided funds to support the publication of this document<br />
through Grant # NA770Z0204 of the National Oceanic and Atmospheric<br />
Administration, Office of Ocean and <strong>Coastal</strong> Resource <strong>Management</strong>, under the<br />
<strong>Coastal</strong> Zone <strong>Management</strong> Act of 1972, as amended.<br />
This work was completed entirely with staff support and management<br />
from the <strong>Virginia</strong> Institute of Marine Science’s CCI Program. A host of individuals<br />
are acknowledged. In addition to those listed as preparers, the project<br />
directors would like to thank Dave Weiss of CCI, the VIMS Vessel <strong>Center</strong>, and<br />
the VIMS Publication <strong>Center</strong> <strong>for</strong> their support.
CHAPTER 2 - The Shoreline Assessment: Approach and Considerations<br />
2.1 Introduction<br />
The Comprehensive <strong>Coastal</strong> Inventory Program (CCI) has developed a<br />
set of protocols <strong>for</strong> describing shoreline conditions along <strong>Virginia</strong>’s tidal shoreline.<br />
The assessment approach uses state of the art Global Positioning Systems<br />
(GPS), and Geographic In<strong>for</strong>mation Systems (GIS) to collect, analyze, and<br />
display shoreline conditions. These protocols and techniques have been developed<br />
over several years, incorporating suggestions and data needs conveyed by<br />
state agency and local government professionals.<br />
Three separate activities embody the development of a Shoreline<br />
Situation <strong>Report</strong>: data collection, data processing and analysis, and map generation.<br />
Data collection follows a three tiered shoreline assessment approach<br />
described below.<br />
2.2 Three Tiered Shoreline Assessment<br />
The data inventory developed <strong>for</strong> the Shoreline Situation <strong>Report</strong> is based<br />
on a three-tiered shoreline assessment approach. This assessment characterizes<br />
conditions in the shorezone, which extends from a narrow portion of the riparian<br />
zone seaward to the shoreline. This assessment approach was developed to<br />
use observations which could be made from a moving boat. To that end, the<br />
survey is a collection of descriptive measurements which characterize conditions.<br />
GPS units log location of conditions observed from a boat. No other<br />
field measurements are per<strong>for</strong>med.<br />
The three tiered shoreline assessment approach divides the shorezone<br />
into three regions: 1) the immediate riparian zone, evaluated <strong>for</strong> land use; 2) the<br />
bank, evaluated <strong>for</strong> height, stability and natural protection; and 3) the shoreline,<br />
describing the presence of shoreline structures <strong>for</strong> shore protection and recreational<br />
purposes. Each tier is described in detail below.<br />
2.2a) Riparian Land Use: Land use adjacent to the bank is classified into one of<br />
eight categories (Table 1). The categories provide a simple assessment of land<br />
use, and give rise to land management practices which could be anticipated.<br />
GPS is used to measure the linear extent along shore where the practice is<br />
observed. The width of this zone is not measured. Riparian <strong>for</strong>est buffers are<br />
considered the primary land use if the buffer width equals or exceeds 30 feet.<br />
This width is calculated from digital imagery as part of the quality control in<br />
data processing.<br />
2.2b) Bank Condition: The bank extends off the fastland, and serves as an<br />
interface between the upland and the shore. It is a source of sediment and<br />
nutrient fluxes from the fastland, and bears many of the upland soil characteristics<br />
which determine water quality in receiving waters. Bank stability is important<br />
<strong>for</strong> several reasons. The bank protects the upland from wave energy during<br />
storm activity. The faster the bank erodes, the sooner the upland will be at risk.<br />
Bank erosion can contribute high sediment loads to the receiving waters. Stability<br />
of the bank depends on several factors: height, slope, sediment composition,<br />
vegetative cover, and the presence of buffers to absorb energy impact to the<br />
bank itself.<br />
The bank assessment in this inventory addresses three major bank<br />
characteristics: bank height, bank stability, and the presence of stable or unstable<br />
natural buffers at the bank toe (Table 2). Conditions are recorded continuously<br />
using GPS as the boat moves along the shoreline. The GPS log reflects any<br />
changes in conditions observed.<br />
Table 1. Tier One - Riparian Land Use Classes<br />
Forest stands greater than 18 feet / width greater than 30 feet<br />
Scrub-shrub stands less than 18 feet<br />
Grass includes grass fields, pasture land, and crop land<br />
Residential includes single or multi family dwellings<br />
Commercial includes industrial, small business, recreational facilities<br />
Bare lot cleared to bare soil<br />
Timbered clear-cuts<br />
Unknown land use undetectable from the vessel<br />
A GPS operator observes shoreline conditions from a shoal draft boat.
Bank height is described as a range, measured from the toe of the bank<br />
to the top. Bank stability characterizes the condition of the bank face. Banks<br />
which are undercut, have exposed root systems, down vegetation, or exhibit<br />
slumping of material qualify as a “high erosion”. At the toe of the bank, natural<br />
marsh vegetation and/or beach material may be present. These features offer<br />
protection to the bank and enhance water quality. Their presence is noted in the<br />
field, and a general assessment (low erosion/high erosion) describes whether<br />
they are experiencing any erosion.<br />
Sediment composition and bank slope cannot be surveyed from a boat,<br />
and are not included. Bank cover was added as a feature to be surveyed<br />
subsequent to data collection <strong>for</strong> this inventory. Other Shoreline Situation<br />
<strong>Report</strong>s will include bank cover as a descriptive attribute.<br />
Table 2. Tier 2 - Bank Conditions<br />
Bank Attribute Range Description<br />
bank height 0-5 ft from the toe to the edge of the fastland<br />
5-10 ft from the toe to the edge of the fastland<br />
> 10 ft from the toe to the edge of the fastlan<br />
bank stability low erosion minimal erosion on bank face or toe<br />
high erosion includes slumping, scarps, exposed roots<br />
marsh buffer no no marsh vegetation along the bank toe<br />
yes fringe or pocket marsh present at banktoe<br />
marsh stability (if present) low erosion no obvious signs of erosion<br />
high erosion marsh edge is eroding or vegetation loss<br />
beach buffer no no sand beach present<br />
yes sand beach present<br />
beach stability (if present) low erosion accreting beach<br />
high erosion eroding beach or non emergent at low tide<br />
2.2c) Shoreline Features: Features added to the shoreline by property owners<br />
are recorded as a combination of points or lines. These features include defense<br />
structures, which are constructed to protect shorelines from erosion; offense<br />
structures, designed to accumulate sand in longshore transport; and recreational<br />
structures, built to enhance recreational use of the water. The location of these<br />
features along the shore are surveyed with a GPS unit. Linear features are<br />
surveyed without stopping the boat. Structures such as docks, and boat ramps<br />
are point features, and a static ten-second GPS observation is collected at the<br />
site. Table 3 summarizes shoreline features surveyed. Linear features are<br />
denoted with an “L” and point features are denoted by a “P.” The glossary<br />
describes these features, and their functional utility along a shore.<br />
Table 3. Tier 3 - Shoreline Features<br />
Feature Feature Type Comments<br />
Control Structures<br />
riprap L<br />
bulkhead L<br />
breakwaters L first and last of a series is surveyed<br />
groinfield L first and last of a series is surveyed<br />
jetty P<br />
miscellaneous L can include tires, rubble, tubes, etc.<br />
Recreational Structures<br />
2.3 Data Collection/Survey Techniques<br />
Data collection is per<strong>for</strong>med in the field, from a small, shoal draft vessel,<br />
navigating at slow speeds parallel to the shoreline. To the extent possible,<br />
surveys take place on a rising tide, allowing the boat to be as close to shore as<br />
possible. The field crew consists of a boat operator, and two data surveyors.<br />
The boat operator navigates the boat to follow the shoreline geometry. One<br />
surveyor collects in<strong>for</strong>mation pertinent to land use and bank condition. The<br />
second surveyor logs in<strong>for</strong>mation relevant to shoreline structures.<br />
Data is logged using the handheld Trimble GeoExplorer GPS unit.<br />
GeoExplorers are accurate to within 4 inches of true position with extended<br />
observations, and differential correction. Both static and kinematic data<br />
pier/wharf P includes private and public<br />
boat ramp P includes private and public<br />
boat house P all covered structures, assumes a pier<br />
marina L includes piers, bulkheads, wharfs
collection is per<strong>for</strong>med. Kinematic data collection is a collection technique<br />
where data is collected continuously along a pathway (in this case along the<br />
shoreline). GPS units are programmed to collect in<strong>for</strong>mation at a rate sufficient<br />
to compute a position anywhere along the course. The shoreline data is collected<br />
at a rate of one observation every five seconds. Land use, bank condition,<br />
and linear shoreline structures are collected using this technique.<br />
Static surveys are used to pin-point fixed locations which occur at very<br />
short intervals. The boat actually stops to collect these data, and the boat<br />
operator must hold the boat against tidal current, and surface wind waves.<br />
Static surveys log 10 GPS observations at a rate of one observation per second<br />
at the fixed station. The GPS receiver uses an averaging technique to compute<br />
one position based on the10 static observations. Static surveys are used to<br />
position point features like piers, boat ramps, and boat houses.<br />
Trimble Explorer GPS receivers include a function that allows a user to<br />
pre-program the complete set of features they are surveying in a “data dictionary”.<br />
The data dictionary prepared <strong>for</strong> this Shoreline Situation <strong>Report</strong> includes<br />
all features described in section 2.2. As features are observed in the field,<br />
surveyors use scroll down menus to continuously tag each geographic coordinate<br />
pair with a suite of characteristics which describe the shoreland’s land use,<br />
bank condition, and shoreline features present. The survey, there<strong>for</strong>e, is a<br />
complete suite of geographically referenced shoreline data.<br />
2.4 Data Processing<br />
Data processing occurs in two parts. Part one processes the raw GPS<br />
field data, and converts the data to GIS coverages (section 2.4a). Part two<br />
corrects the GIS coverages to reflect true shoreline geometry (section 2.4b).<br />
2.4a.) GPS Processing: Differential correction improves the accuracy of GPS<br />
data by including other “known” locations to refine geographic position. Any<br />
GPS base station within 124 miles of the field site can serve as one additional<br />
location. The VIMS’ base station was used <strong>for</strong> most of the data processing in<br />
Poquoson. Data from base stations maintained by the United States Coast<br />
Guard at Cape Henry, or the VA Department of Transportation in Richmond were<br />
also available. Both of these stations are no longer active.<br />
A hand-held Trimble Geo-Explorer logs field data observed from the boat.<br />
Differential correction is the first step to processing GPS data. Trimble’s<br />
Pathfinder Office GPS software is used. The software processes time synchronized<br />
GPS signals from field data and the selected base station. Differential<br />
correction improves the position of the GPS field data based on the known<br />
location of the base station, the satellites, and the satellite geometry. When<br />
Selective Availability was turned off in late Spring, 2000, the need to post<br />
process data has nearly been eliminated <strong>for</strong> the level of accuracy being sought in<br />
this project.<br />
Although the Trimble Geo-Explorers are capable of decimeter accuracy<br />
(~ 4 inches), the short occupation of sites in the field reduces the accuracy to 5<br />
meters (~16 feet). In many cases the accuracy achieved is better, but the<br />
overall limits established by the CCI program are set at 5 meters. This means<br />
that features are registered to within 5 meters (~16 feet) (or better) of their<br />
true position on the earth’s surface. In this case, positioning refers to the boat<br />
position during data collection.<br />
An editing function is used to clean the GPS data. Cleaning corrects <strong>for</strong><br />
breaks in the data which occur when satellite lock is lost during data collection.<br />
Editing also eliminates erroneous data collected when the boat circles off track,<br />
and the GPS unit is not switched to “pause” mode.<br />
The final step in GPS processing converts the files to three separate<br />
ArcInfo GIS coverages. The three coverages are: a land use and bank condition<br />
coverage (poq_lubc), a shoreline structure coverage (lines only) (poq_sstruc),<br />
and a shoreline structure coverage (points only) (poq_astruc).<br />
2.4b.) GIS Processing: GIS processing uses ESRI’s ArcInfo ® GIS software, and<br />
ERDAS’ Imagine ® software. Several data sets are integrated to develop the<br />
final inventory products. First, the shoreline situation data are derived from the<br />
GPS field data, and the three coverages discussed above. These attributes are<br />
summarized in Tables 1, 2, and 3. Second, the basemap coverage is derived<br />
from a digitized record of the high water shoreline illustrated on 7.5 minute,<br />
1:24,000 USGS topographic maps <strong>for</strong> the study area. Since it is available <strong>for</strong><br />
the entire Tidewater area, this shoreline has been selected as the baseline shoreline<br />
<strong>for</strong> development of all Shoreline Situation <strong>Report</strong>s. The digital coverage was<br />
developed by the CCI program in the early 1990s using most recent topographic<br />
maps available. These maps range from the late 1960s to the early<br />
1980s. As USGS updates these maps, revisions to the digital basemap series<br />
can be made. Finally, the third data set integrated is digital color infra-red<br />
imagery known as Digital Ortho Quarter Quadrangles (DOQQs). These products<br />
are circulated by the USGS. DOQQs are fully rectified digital imagery<br />
representing one quarter of a USGS 7.5 minute quadrangle. They were released<br />
in 1997, and use imagery flown in 1994. The imagery are used as background<br />
during data processing and map production. They are an important quality<br />
control tool <strong>for</strong> verifying the location of certain landscape attributes, and<br />
provide users with additional in<strong>for</strong>mation about the coastal landscape.<br />
GIS processing includes two separate parts. Step one checks the relative<br />
accuracy of the shoreline coverage. Since this coverage was developed from<br />
topographic maps dating back to the 1960s, significant changes in the shoreline<br />
orientation may have occurred. While this process does not attempt to recompute<br />
a shoreline position relative to a vertical tidal datum, it adjusts the<br />
horizontal geographic position to reflect the present shoreline geometry. Using<br />
ERDAS’ Imagine software, the 1994 DOQQ imagery is displayed onscreen<br />
behind the digitized USGS shoreline coverage. The operator looks <strong>for</strong> areas
where the digitized shoreline departs greatly from the land water interface<br />
depicted in the background image. The digitized shoreline coverage is then<br />
corrected using Imagine’s onscreen digitizing techniques to align more closely<br />
with the land water interface displayed. This revised shoreline coverage is used<br />
in all subsequent inventory steps and products.<br />
Step two corrects the coverages generated from the GPS field data to<br />
the shoreline record. These coverages, having been processed through GPS<br />
software, are geographically coincident with the path of the boat, from where<br />
observations are made. They are, there<strong>for</strong>e, located somewhere in the waterway.<br />
Step two transfers these data back to the corrected shoreline record so<br />
the data more precisely reflects the location being described along the shore.<br />
The majority of data processing takes place in step two, which uses all<br />
three data sets simultaneously. The corrected shoreline record, and the processed<br />
GPS field data are displayed at the same time onscreen as ArcInfo<br />
coverages. The imagery is used in the background <strong>for</strong> reference. The corrected<br />
shoreline is the base coverage. The remaining processing re-codes the<br />
base shoreline coverage <strong>for</strong> the shoreline attributes mapped along the boat<br />
track. Each time the boat track data (i.e GPS data) indicates a change in<br />
attribute type or condition, the digital shoreline arc is split, and coded appropriately<br />
<strong>for</strong> the attributes using ArcInfo techniques.<br />
This step endures a rigorous sequence of checks to insure the positional<br />
translation is as accurate as possible. Each field coverage; land use, bank<br />
condition, and shoreline condition, is processed separately. The final products<br />
are three new coded shoreline coverages. Each coverage has been checked<br />
twice onscreen by different GIS personnel. A final review is done on hardcopy<br />
printouts.<br />
2.4c.) Maps and Tables: Large <strong>for</strong>mat, color maps are generated to illustrate<br />
the attributes surveyed along the shore. A three-part map series has been<br />
designed to illustrate the three tiers individually. Plate A describes the riparian<br />
land use as color coded bars along the shore. A legend keys the color to the<br />
type of land use.<br />
Plate B depicts the condition of the bank and any natural buffers<br />
present. A combination of color and pattern symbology gives rise to a vast<br />
amount of bank and natural buffer in<strong>for</strong>mation. Erosional conditions are illus-<br />
trated in red <strong>for</strong> both bank and buffer. Stable or low erosion conditions are<br />
illustrated in green. Bank height varies with the thickness of the line; where the<br />
thickest lines designate the highest banks (> 10 feet). Natural buffers, when<br />
present, are described by small circles parallel to the shore. Open circles just<br />
seaward of the line indicate a natural fringe marsh along the base of the bank.<br />
Solid circles indicate a sand beach buffer at the base of the bank. It is possible<br />
to have both. The length of the symbology along the shore reflects the length<br />
alongshore that the features persist. The symbology changes as conditions<br />
change.<br />
Plate C combines recreational and shoreline protection structures in a<br />
composition called Shoreline Features. Linear features, described previously, are<br />
mapped using color coded bar symbols which follow the orientation of the<br />
shoreline. Point features use a combination of colors and symbols to plot the<br />
positions on the map.<br />
DOQQ imagery are used as a backdrop, upon which all shoreline data<br />
are superimposed. The imagery was collected in 1994. The color infra red<br />
image is used as a backdrop to Plate A. A gray-scale version of this same image<br />
is used <strong>for</strong> Plates B and C.<br />
For publication purposes the city is divided into a series of plates set at a<br />
scale of 1:12,000. The number of plates is determined by the geographic size<br />
and shape of Poquoson. An index is provided in Chapter 4 which illustrates the<br />
orientation of plates to each other. The city was divided into seven plates (plate<br />
1a, 1b, 1c, etc.), <strong>for</strong> a total of 21 map compositions.<br />
Tables 4 and 5 quantify features mapped in the city. These are generated<br />
using frequency analysis techniques in ArcInfo. Table 4 bases its calculations<br />
on the river reaches which were delineated in the 1970s by VIMS’ coastal<br />
geologists to represent short, process similar stretches of shoreline. They<br />
provide a unit of measure <strong>for</strong> comparative purposes over time (Byrne and<br />
Anderson, 1983). The reach boundaries are illustrated in Figure 2. Table 4,<br />
quantifies present conditions (1998) on a reach by reach basis. There are 55<br />
reaches in the City of Poquoson (reaches 76-81 and reaches 62-74 along the<br />
Poquoson River; reaches 48-61 along Big Salt Marsh and the shoreline of the<br />
Chesapeake Bay; and reaches 28-47 within the main stem and tidal tributaries<br />
of Back River). Table 4 reports the linear attribute data as a percent of the total<br />
reach length, and point data as the number of features per reach.<br />
Tables 5 also quantifies features mapped along the rivers using frequency<br />
analysis techniques in ArcInfo. The values quantify features on a plate<br />
by plate basis. For linear features, values are reported in actual miles surveyed.<br />
The number of point features surveyed are also listed on a plate by plate basis.<br />
The total miles of shoreline surveyed <strong>for</strong> each plate is reported. A total of<br />
168.51 miles of shoreline were surveyed in Poquoson. Since there is plate<br />
overlap, this number can not be reached by adding the total shoreline miles <strong>for</strong><br />
each plate. The last row of Table 5 does, however, report the total shoreline<br />
miles surveyed <strong>for</strong> the city and the total amount of each feature surveyed along<br />
the measured shoreline. Note, that only 59.51 miles of shoreline were surveyed<br />
in the field. The remaining 106 miles were surveyed remotely using image<br />
interpretation. These miles could not be accessed by boat due to shallow water<br />
conditions.<br />
Fringe marsh along <strong>for</strong>ested reparian zone in White House Cove.
Chapter 3. Applications <strong>for</strong> <strong>Management</strong><br />
3.1 Introduction<br />
There are a number of different management applications <strong>for</strong> which the<br />
Shoreline Situation <strong>Report</strong>s (SSRs) support. This section discusses four of them<br />
which are currently high profile issues within the Commonwealth or Chesapeake<br />
Bay watershed. The SSRs are data reports, and do not necessarily provide<br />
interpretation beyond the characteristics of the nearshore landscape. However,<br />
the ability to interpret and integrate these data into other programs is key to<br />
gleaming the full benefits of the product. This chapter offers some examples <strong>for</strong><br />
how data within the SSRs can be integrated and synthesized to support current<br />
state management programs.<br />
3.2 Shoreline <strong>Management</strong><br />
The first uses <strong>for</strong> SSRs were to prepare decision makers to bring about<br />
well in<strong>for</strong>med decisions regarding shoreline management. This need continues<br />
today, and perhaps with more urgency. In many areas, undisturbed shoreline<br />
miles are almost nonexistent. Development continues to encroach on remaining<br />
pristine reaches, and threatens the natural ecosystems which have prevailed. At<br />
the same time, the value of waterfront property has escalated, and the exigency<br />
to protect shorelines through stabilization has increased. Generally speaking,<br />
this has been an accepted management practice. However, protection of tidal<br />
shorelines does not occur without incidence.<br />
<strong>Management</strong> decisions must consider the current state of the shoreline,<br />
and understand what actions and processes have occurred to bring the shoreline<br />
to its current state. This includes evaluating existing management practices,<br />
assessing shore stability in an area, and determining future uses of the shore.<br />
The SSRs provide data to per<strong>for</strong>m these evaluations.<br />
Plate A defines the land use adjacent to the shoreline. To the extent<br />
that land use directs the type of management practices found, these maps can<br />
predict shoreline strategies which may be expected in the future. Residential<br />
areas are prone to shoreline alterations. Commercial areas may require structures<br />
along the shore <strong>for</strong> their daily operations. Others frequently seek structural<br />
alternatives to address shoreline stability problems. Forested riparian<br />
zones, and large tracts of grass or agricultural areas are frequently unmanaged<br />
even if chronic erosion problems exist.<br />
Stability at the shore is described in Plate B. The bank is characterized<br />
by its height, its state of erosion, and the presence or absence of natural buffers<br />
at the bank toe. Upland adjacent to high, stable banks with a stable natural<br />
buffer at the base are less prone to flooding or erosion problems resulting from<br />
storm activity. Upland adjacent to banks of lesser height (< 5feet) are at<br />
greater risk of flooding, but if banks are stable with marshes or beaches<br />
present, erosion may not be as significant a concern. Survey data reveals a<br />
strong correlation between banks of high erosion, and the absence of natural<br />
buffers. Conversely, the association between stable banks and the presence of<br />
marsh or beach is also well established. This suggests that natural buffers such<br />
as beaches and fringe marshes play an important role in bank protection. This is<br />
illustrated on the maps. Banks without natural buffers, yet classified as low<br />
erosion, are often structurally controlled with rip rap or bulkheads.<br />
Plate C delineates structures installed along the shoreline. These include<br />
erosion control structures, and structures to enhance recreational use of the<br />
waterway. This map is particularly useful <strong>for</strong> evaluating requests from property<br />
owners seeking structural methods <strong>for</strong> controlling shoreline erosion problems.<br />
Shoreline managers can evaluate the current situation of the surrounding shore<br />
including: impacts of earlier structural decisions, proximity to structures on<br />
neighboring parcels, and the vicinity to undisturbed lots. Alternative methods<br />
such as vegetative control may be evaluated by assessing the energy or fetch<br />
environment from the images. Use this plate in combination with Plate B to<br />
evaluate the condition of the bank proposed <strong>for</strong> protection.<br />
A close examination of shore conditions may suggest whether certain<br />
structural choices have been effective. Success of groin field and breakwater<br />
systems is confirmed when sediment accretion is observed. Low erosion conditions<br />
surveyed along segments with bulkheads and riprap indicate structures<br />
have controlled the erosion problem. The width of the shorezone, estimated<br />
from the background image, also speaks to the success of structures as a<br />
method of controlling erosion. A very narrow shorezone implies that as bulkheads<br />
or riprap have secured the erosion problem at the bank, they have also<br />
deflated the supply of sediment available to nourish a healthy beach. This is a<br />
typical shore response, and remains an unresolved management problem.<br />
Shoreline managers are encouraged to use all three plates together when<br />
developing management strategies or making regulatory decisions. Each plate<br />
provides important in<strong>for</strong>mation independent of the others, but collectively the<br />
plates become a more valuable management tool.<br />
3.3 Non-Point Source Targeting<br />
The identification of potential problem areas <strong>for</strong> non-point source<br />
pollution is a focal point of water quality improvement ef<strong>for</strong>ts throughout the<br />
Commonwealth. The three tiered approach provides a collection of data which,<br />
when combined, can allow <strong>for</strong> an assessment of potential non-point source<br />
pollution problems in a waterway.<br />
Grass land, which includes cultivated and pasture lands, has the highest<br />
potential <strong>for</strong> nutrient runoff. These areas are also prone to high sediment loads<br />
since the adjacent banks are seldom restored when erosion problems persist.<br />
Residential, bare, and commercial land uses also have the potential to contribute<br />
to the non-point source pollution problem due to the types of practices which<br />
prevail, and large impervious surface areas.<br />
The highest potential <strong>for</strong> non-point source pollution combines these land<br />
uses with “high” bank erosion conditions and no marsh buffer protection. The<br />
potential <strong>for</strong> non-point source pollution moderates as the condition of the bank<br />
changes from “high” bank erosion to “low” bank erosion, or with the presence<br />
or absence of stable marsh vegetation to function as a nutrient sink <strong>for</strong> runoff.<br />
Where defense structures occur in conjunction with “low” bank erosion, the<br />
structures are effectively controlling erosion at this time, and the potential <strong>for</strong><br />
non-point source pollution is reduced. If the following characteristics are<br />
delineated: low bank erosion, stable marsh buffer, riprap or bulkhead; the potential<br />
<strong>for</strong> non-point source pollution from any land use class can be lowered.<br />
At the other end of the spectrum, <strong>for</strong>ested and scrub-shrub sites do not<br />
contribute significant amounts of non-point source pollution to the receiving<br />
waterway. Forest buffers, in particular, are noted <strong>for</strong> their ability to uptake<br />
nutrients running off the upland. Forested areas with stable or defended banks,<br />
a stable fringe marsh, and a beach would have the lowest potential as a source<br />
of non-point pollution. Scrub-shrub with similar bank and buffer characteristics<br />
would also be very low.
A quick search <strong>for</strong> potential non-point source sites would begin on Plate<br />
A. Identify the “grass” areas. Locate these areas on Plate B, and find those<br />
which have eroding banks (in red) without any marsh protection. The hot spots<br />
are these sites where the banks are highest (thick red line), so the potential<br />
sediment volume introduced to the water is greatest. Finally check plate C to<br />
determine if any artificial stabilization to protect the bank has occurred. If these<br />
areas are without stabilizing structures, they indicate the hottest spots <strong>for</strong> the<br />
introduction of non-point source pollution.<br />
3.4 Designating Areas of Concern (AOC) <strong>for</strong> Best<br />
<strong>Management</strong> Practice (BMP) Sites<br />
Sediment load and nutrient management programs at the shore are<br />
largely based on installation of Best <strong>Management</strong> Practices (BMPs). Among<br />
other things, these practices include fencing to remove livestock from the water,<br />
installing erosion control structures, and bank re-vegetation programs. Installation<br />
of BMPs is costly. Cost share programs provide relief <strong>for</strong> property owners,<br />
but funds are scarce in comparison to the capacious number of waterway miles<br />
needing attention. Targeting Areas of Concern (AOC) can prioritize spending<br />
programs, and direct funds where most needed.<br />
Data collected <strong>for</strong> the SSR can assist with targeting ef<strong>for</strong>ts <strong>for</strong> designating<br />
AOCs. AOCs can be areas where riparian buffers are fragmented, and could<br />
be restored. Use Plate A to identify <strong>for</strong>ested upland. Breaks in the continuity<br />
of the riparian <strong>for</strong>est can be easily observed in the line segments, and background<br />
image. Land use between the breaks relates to potential opportunity <strong>for</strong><br />
restoring the buffer where fragmentation has occurred. Agricultural tracts<br />
which breach <strong>for</strong>est buffers are more logical targets <strong>for</strong> restoration than developed<br />
residential or commercial stretches. Agricultural areas, there<strong>for</strong>e, offer<br />
the highest opportunity <strong>for</strong> conversion. Priority sites <strong>for</strong> riparian <strong>for</strong>est restoration<br />
should target <strong>for</strong>ested tracts breached by “grass” land (green-yellow-green<br />
line pattern).<br />
Plate B can be used to identify sites <strong>for</strong> BMPs. Look <strong>for</strong> where “red”<br />
(i.e. eroding) bank conditions persist. The thickness of the line tells something<br />
about the bank height. The fetch, or the distance of exposure across the water,<br />
can offer some insight into the type of BMP which might be most appropriate.<br />
Re-vegetation may be difficult to establish at the toe of a bank with high exposure<br />
to wave conditions. Plate C should be checked <strong>for</strong> existing shoreline<br />
erosion structures in place.<br />
Tippett et.al.(2000) used similar stream side assessment data to target<br />
areas <strong>for</strong> bank and riparian corridor restoration. These data followed a comparable<br />
three tier approach and combine data regarding land use and bank stability<br />
to define specific reaches along the stream bank where AOCs have been noted.<br />
Protocols <strong>for</strong> determining AOCs are based on the data collected in the field.<br />
3.5 Targeting <strong>for</strong> Total Maximum Daily Load<br />
(TMDL) Modeling<br />
As the TMDL program in <strong>Virginia</strong> evolves, the importance of shoreline<br />
erosion in the lower tidal tributaries will become evident. Total maximum daily<br />
loads are defined as a threshold value <strong>for</strong> a pollutant, which when exceeded,<br />
impedes the quality of water <strong>for</strong> specific uses (e.g. swimming, fishing). Among<br />
the pollutants to be considered are: fecal coli<strong>for</strong>m, pathogens, nitrogen, phosphorous,<br />
and sediment load.<br />
State agencies will develop models to address each of these parameters.<br />
In upper watersheds, nutrient and fecal coli<strong>for</strong>m parameters will be critical where<br />
high agricultural land use practices prevail. Sediment loads will eventually be<br />
considered throughout the watershed. In the lower watersheds, loads from<br />
shoreline erosion must be addressed <strong>for</strong> a complete sediment source budget.<br />
Erosion from shorelines has been associated with high sediment loads in receiving<br />
waters (Hardaway et.al., 1992), and the potential <strong>for</strong> increased nutrient<br />
loads (Ibison et.al., 1990). <strong>Virginia</strong>’s TMDL program is still developing. Impaired<br />
stream segments are being used to initially identify where model development<br />
should focus. For <strong>Virginia</strong>, this streamlining has done little to reduce the<br />
scope of this daunting task, since much of the lower major tributaries are<br />
considered impaired. Additional targeting will be necessary to prioritize model<br />
development.<br />
Targeting to prioritize TMDL can be assisted by maps which delineate<br />
areas of high erosion, and potential high sediment loads. Plate B in this inventory<br />
delineates banks of high erosion. Waterways with extensive footage of<br />
eroding shorelines should be targeted. The volume of sediment entering a<br />
system is also a function of bank height. Actual volumes of sediment eroded<br />
can be estimated by using bank height, and the linear extent that the condition<br />
persists along the shore. Bank height is an attribute defined in Plate B by the<br />
width of the line. Eroding banks (in red) with heights in excess of 10 feet<br />
(thickest line) would be target areas <strong>for</strong> high sediment loads. Plate A can be<br />
used in combination with Plate B to determine the dominant land use practice,<br />
and assess whether nutrient enrichment through sediment erosion is also a<br />
concern. This would be the case along agriculturally dominated waterbodies.<br />
Tables 4 and 5 quantify the linear extent of high, eroding banks on a reach by<br />
reach, or plate by plate basis, respectively.<br />
Geese <strong>for</strong>age along the shoreline flats along Lambs Creek.
Chapter 4. The Shoreline Situation<br />
The shoreline situation is described <strong>for</strong> conditions in the City of<br />
Poquoson along its primary and secondary waterways. Characteristics are<br />
described <strong>for</strong> all navigable tidal waterways contiguous to these larger waterways.<br />
A total of 168.51 miles of shoreline are described. Sixty-two and one half miles<br />
were surveyed in the field. The remaining 106 miles are described using image<br />
interpretation techniques and ancillary data sources. These areas are dominated<br />
by the extensive network of tidal channels through salt marsh habitat. Photo<br />
interpretation was made using DOQQs to detect land use, natural buffers, and<br />
shoreline structures. Along the tidal channels and main shoreline of Big Salt<br />
Marsh, upland banks are assumed to be well protected by expansive salt marshes<br />
and tidal flats. The marsh edges are assumed to be relatively stable within the<br />
tidal channels, but undergoing erosion on the more exposed Chesapeake Bay<br />
shore side. Bank height conditions along reaches characterized using remote<br />
sensing techniques were estimated from USGS 1:24,000 topographic maps.<br />
Riprap protects the low-lying residential district in Lambs Creek.<br />
Brief descriptions of the city are provided on the basis of river segments,<br />
the boundaries of which are geographically determined. These descriptions<br />
summarize tabular data (Table 5) and notable features present. Three<br />
segments are defined. Segment 1 includes plates 1-2. Segment 2 includes<br />
plates 3-5, and Segment 3, plates 6-7. An index preceding the map compositions<br />
illustrates the plate boundaries. Important documentation pertaining to<br />
each plate follows the segment description.<br />
Segment 1 (Plates 1-2)<br />
Description: Segment 1 begins at the city border running along the center line<br />
of the Poquoson River into Lambs Creek. This segment also extends through<br />
Bennet Creek to Lloyd Bay. All 55.11 miles of shoreline in Segment 1 were<br />
surveyed in June, 1999. Fringing marshes are common along much of the<br />
shoreline until Lloyd Bay, where embayed marsh is more common. Approximately<br />
one quarter of these marshes are characteristically erosional. Of the<br />
27.25 miles of marsh, 6.73 miles around Blackwalnut Ridge are eroding. While<br />
marshes are common in Segment 1, very few beaches are found. Only 0.03<br />
mile of beach exist along the shoreline of this segment.<br />
Land Use: Much of the shoreline in Segment 1 has been developed. Approximately<br />
42% of the surveyed miles are residential. Scrub-shrub comprises the<br />
majority of the remaining land cover, and dominates along Easton Cove and<br />
around Blackwalnut Ridge. Thirteen percent of the shoreline is <strong>for</strong>ested, and<br />
2% is commercial. When compared with statistics reported in Anderson<br />
et.al.(1975), land use has not changed extensively over the last 23 years.<br />
Bank Condition: Bank heights along this segment are all below 5 feet. The<br />
majority of these banks were classified as stable or low erosion, confirming that<br />
the extensive marshes offer significant protection to the upland bank. Of the<br />
55.11 miles of banks, 2.65 miles are characterized as high erosion. According<br />
to Anderson et.al. (1975), flood hazard potential is high and critical in this<br />
segment due to the extreme low elevation of the fastland. This segment is very<br />
susceptible to flooding from all predicted flood levels.<br />
Shore Condition: Erosion control structures are not uncommon along the<br />
residential dominated shoreline in Segment 1. Erosion from tidal current and<br />
Owens Marina in Bennett Creek.<br />
boat wakes are suspected to be the principal cause <strong>for</strong> shoreline erosion. There<br />
is 7.58 miles of riprap and 3.29 miles of bulkhead. Pier density is high in this<br />
segment as well. The historical erosion rates reported in Byrne and Anderson<br />
(1983) <strong>for</strong> the reaches within this segment are minimal (SSR).<br />
Segment 2 (Plates 3-5)<br />
Description: Segment 2 covers Lloyd Bay, Cow Island, Big Salt Marsh, around<br />
Plumtree Point to Bells Oyster Gut. Almost all (97.8%) of the upland is protected<br />
by wide embayed marshes. A total of 103.34 miles of shoreline in this<br />
segment were surveyed. A significant portion of this shoreline was surveyed<br />
remotely (plates 4 and 5). Data collection in the field which did occur took<br />
place in June, 1999 (plate 3). Much of the primary shoreline is adjacent to or<br />
along the mainstem of the Chesapeake Bay. Shallow nearshore depths due to
the Drum Island Flats, and the absence of residential development has kept<br />
erosion minimal in Segment 2. There are 101.05 miles of marsh in Segment 2,<br />
but over 1/3 of these marshes are experiencing significant erosion. This is<br />
largely the result of exposure to long fetches from the Chesapeake Bay.<br />
Beaches, although not as common as marshes, are also found in Segment 2.<br />
Of the 13.77 miles of beaches, 2.06 miles are highly eroding.<br />
Land Use: The low-lying marshy habitat, in combination with the federal land<br />
holdings in this area restricts extensive residential development. Instead, scrubshrub<br />
dominates more than 96% of the land cover adjacent to this shoreline.<br />
The result is that land use has not changed significantly when compared to the<br />
assessment reported in Anderson et,al. (1975).<br />
Bank Condition: All banks in this segment are under 5 feet in elevation. Only<br />
3.31 miles are highly eroding, again mainly due to the extensive marshes in<br />
Segment 2. The high and critical flood hazard potential reported in Segment 1<br />
extends into this area as well. The absence of private residences, however,<br />
does not make this flood potential a serious threat to human life and property.<br />
Commercial waterfront at Messick Point.<br />
Private piers are abundant in Topping Creek.<br />
Shore Condition: Due to the lack of development and the presence of natural<br />
buffers (i.e. marshes) to protect the shoreline, there is very little shoreline<br />
armoring in Segment 2. Only 0.32 mile of riprap and 0.38 mile of bulkhead are<br />
found in this segment. Historical erosion rates in Segment 2 are known to be<br />
minimal (Byrne and Anderson, 1983).<br />
Segment 3 (Plates 6 - 7)<br />
Description: The last segment, Segment 3, covers the area from Bells Oyster<br />
Gut along the Back River into the Northwest Branch of this river to the city line<br />
in Brick Kiln Creek. Much of the immediate shorezone is undeveloped due to<br />
the low-lying marshes which prevail. All 24.44 miles of shoreline in this segment<br />
were surveyed in late June, 1999. While no beaches are present in<br />
Segment 3, fringing and embayed marshes stretch across more than 20 miles of<br />
the segment. These areas were noted to be relatively stable; exhibiting no major<br />
erosion problems.<br />
Land Use: The majority of the riparian landcover is scrub-shrub (>61%).<br />
Residential use accounts <strong>for</strong> only 18% of the riparian area, and <strong>for</strong>est cover<br />
another 16%. There are 1.03 miles of commercial land use along the<br />
shorezone. A comparison with earlier reports indicates only slight increases in<br />
residential land use in this segment since 1975 (Anderson, et.al., 1975).<br />
Bank Condition: All but 0.05 mile of shoreline in Segment 3 have bank heights<br />
less than 5 feet. The majority of banks in this segment are stable except <strong>for</strong><br />
3.34 miles of unstable banks. Unstable conditions dominated only in High<br />
Cedar Creek and Bells Oyster Gut. The potential <strong>for</strong> flooding is also high<br />
considering the low lying terrain.<br />
Shore Condition: Despite the extensive marshes protecting the undeveloped<br />
shorelines, riprap and bulkhead can be found protecting some of the private<br />
residences in Segment 3. There are 2.23 miles of bulkhead, but only 0.26 miles<br />
of riprap. These structures, are concentrated along the residential district in the<br />
vicinity of Topping Creek, and the commercial zone along Messick Point. Pier<br />
density is high in both these areas. Historically, the shoreline in this segment has<br />
not experienced significant erosion problems, and the erosion rate determined<br />
by Byrne and Anderson (1983) is slight to moderate but non-critical.
Map Compositions<br />
Plate 1<br />
Location: City boundary in Lambs Creek around Hunts Point along the<br />
Poquoson River and through Lyons Creek<br />
Reaches: 74-81<br />
Total Shoreline Miles: 23.17 miles<br />
Shoreline Miles Surveyed: 23.17 miles (no remote)<br />
Survey Date(s): 6/14/99 and 6/28/99<br />
Rotation: 43 degrees East<br />
Plate 2<br />
Location: Parts of Bennett Creek, including tributaries Lyons Creek,<br />
White House Cove, Floyds Bay, Easton Cove, and Lloyd Bay<br />
Reaches: 68, 70-74<br />
Total Shoreline Miles: 40.75 miles<br />
Shoreline Miles Surveyed: 40.75 miles (17.48 miles remotely surveyed)<br />
Survey Date(s): 6/28/99 and 6/29/99<br />
Rotation: 0 degrees<br />
Plate 3<br />
Location: Lloyd Bay to the end of Poquoson River at Marsh Point and<br />
around to Drum Point<br />
Reaches: 60-68, 70<br />
Total Shoreline Miles: 57.09 miles<br />
Shoreline Miles Surveyed: 57.09 miles (56.58 miles remotely surveyed)<br />
Survey Date(s): 6/29/99<br />
Rotation: 0 degrees<br />
Plate 4<br />
Location: Whalebone Island past Gun Hammock Creek<br />
Reaches: 51(partial), 52-56, 58-59<br />
Total Shoreline Miles: 37.32<br />
Shoreline Miles Surveyed: 37.32 miles (100% remotely surveyed)<br />
Survey Date(s): Not Applicable<br />
Rotation: 0 degrees<br />
Plate 5<br />
Location: Gun Hammock Creek around Plumtree Point to Bells<br />
Oyster Gut<br />
Reaches: 41-55<br />
Total Shoreline Miles: 33.21 miles<br />
Shoreline Miles Surveyed: 33.21 miles (29.05 miles remotely<br />
surveyed)<br />
Survey Date(s): 6/30/99<br />
Rotation: 90 degrees West<br />
Plate 6<br />
Location: Bells Oyster Gut around Tin Shell Point into the Northwest<br />
Branch of Back River<br />
Reaches: 34-43<br />
Total Shoreline Miles: 13.04 miles<br />
Shoreline Miles Surveyed: 13.04 miles (0.57 miles remotely surveyed)<br />
Survey Date(s): 6/30/99<br />
Rotation: 0 degrees
Plate 7<br />
Location: Topping Creek, Cedar Creek, and other<br />
parts of the Northwest Branch of Back<br />
River, to the city line in Brick Kiln Creek<br />
Reaches: 28-34<br />
Total Shoreline Miles: 11.98 miles<br />
Shoreline Miles Surveyed: 11.98 miles (2.23 miles remotely<br />
surveyed)<br />
Survey Date(s): 6/30/99<br />
Rotation: 0 degrees<br />
Riprap and bulkheading along the North West Branch of Back River.
Glossary of Shoreline Features Defined<br />
Bare - Land use defined as bare includes areas void of any vegetation or<br />
obvious land use. Bare areas include those which have been cleared <strong>for</strong> construction.<br />
Beaches - Beaches are sandy shores which are subaerial during mean high<br />
water. These features can be thick and persistent, or very thin lenses of sand.<br />
Boat house - A boathouse is considered any covered structure alongside a dock<br />
or pier built to cover a boat. They include true “houses” <strong>for</strong> boats with roof<br />
and siding, as well as awnings which offer only overhead protection. Since<br />
nearly all boat houses have adjoining piers, piers are not surveyed separately,<br />
but are assumed. Boat houses may be difficult to see in aerial photography. On<br />
the maps they are denoted with a blue triangle.<br />
Boat Ramp - Boat ramps provide vessels access to the waterway. They are<br />
usually constructed of concrete, but wood and gravel ramps are also found.<br />
Point identification of boat ramps does not discriminate based on type, size,<br />
material, or quality of the launch. Access at these sites is not guaranteed, as<br />
many may be located on private property. The location of these ramps was<br />
determined from static ten second GPS observations. Ramps are illustrated as<br />
purple squares on the maps.<br />
Breakwaters - Breakwaters are structures which sit parallel to the shore, and<br />
generally occur in a series along the shore. Their purpose is to attenuate and<br />
deflect incoming wave energy, protecting the fastland behind the structure. In<br />
doing so, a beach may naturally accrete behind the structures if sediment is<br />
available. A beach nourishment program is frequently part of the construction<br />
plan.<br />
The position of the breakwater offshore, the number of breakwaters in a<br />
series, and their length depends on the size of the beach which must be maintained<br />
<strong>for</strong> shoreline protection. Most breakwater systems sit with the top at or<br />
near MHW and are partially exposed during low water. Breakwaters can be<br />
composed of a variety of materials. Large rock breakwaters, or breakwaters<br />
constructed of gabion baskets filled with smaller stone are popular today.<br />
Breakwaters are not easily observed from aerial imagery. However, the symmetrical<br />
cuspate sand bodies which may accumulate behind the structures can<br />
be. In this survey, individual breakwaters are not mapped. The first and last<br />
breakwater in the series are surveyed as a ten-second static GPS observation.<br />
The system is delineated on the maps as a line paralleling the linear extent of the<br />
breakwater series along the shore.<br />
Bulkhead - Bulkheads are traditionally treated wood or steel “walls” constructed<br />
to offer protection from wave attack. More recently, plastics are being used in<br />
the construction. Bulkheads are vertical structures built slightly seaward of the<br />
problem area and backfilled with suitable fill material. They function like a<br />
retaining wall, as they are designed to retain upland soil, and prevent erosion of<br />
the bank from impinging waves. The recent proliferation of vertical concrete<br />
cylinders, stacked side by side along an eroding stretch of shore offer similar<br />
level of protection as bulkheads, and include some of the same considerations<br />
<strong>for</strong> placement and success. These structures are also included in the bulkhead<br />
inventory.<br />
Bulkheads are found in all types of environments, but they per<strong>for</strong>m best<br />
in low to moderate energy conditions. Under high energy situations, the erosive<br />
power of reflective waves off bulkheads can scour material from the base, and<br />
cause eventual failure of the structure.<br />
Bulkheads are common along residential and commercially developed<br />
shores. From aerial photography, long stretches of bulkheaded shoreline may be<br />
observed as an unnaturally straight or angular coast. In this inventory, they are<br />
mapped using kinematic GPS techniques. The data are displayed as linear<br />
features on the maps.<br />
Commercial - Commercial zones include small commercial operations and larger<br />
industrial facilities. These operations are not necessarily water dependent<br />
businesses.<br />
Dock/Pier - In this survey, a dock or pier is a structure, generally constructed of<br />
wood, which is built perpendicular or parallel to the shore. These are typical on<br />
private property, particularly residential areas. They provide access to the water,<br />
usually <strong>for</strong> recreational purposes. Docks and piers are mapped as point features<br />
on the shore. Pier length is not surveyed. In the map compositions, docks are<br />
denoted by a small green dot. Depending on resolution, docks can be observed<br />
in aerial imagery, and may be seen in the maps if the structure was built prior to<br />
1994, when the photography was taken.<br />
Forest Land Use - Forest cover includes deciduous, evergreen, and mixed <strong>for</strong>est<br />
stands greater than 18 feet high. The riparian zone is classified as <strong>for</strong>ested if<br />
the tree stand extends at least 33 feet inland of the seaward limit of the riparian<br />
zone.<br />
Grass - Grass lands include large unmanaged fields, managed grasslands adjacent<br />
to large estates, agriculture tracts reserved <strong>for</strong> pasture, and cultivated<br />
fields.<br />
Groinfield - Groins are low profile structures that sit perpendicular to the shore.<br />
They are generally positioned at, or slightly above, the mean low water line.<br />
They can be constructed of rock, timber, or concrete. They are frequently set in<br />
a series known as a groinfield, which may extend along a stretch of shoreline <strong>for</strong><br />
some distance.<br />
The purpose of a groin is to trap sediment moving along shore in the<br />
littoral current. Sediment is deposited on the updrift side of the structure and<br />
can, when sufficient sediment is available in the system, accrete a small beach<br />
area. Some fields are nourished immediately after construction with suitable<br />
beach fill material. This approach does not deplete the longshore sediment<br />
supply, and offers immediate protection to the fastland behind the system.<br />
For groins to be effective there needs to be a regular supply of sediment<br />
in the littoral system. In sediment starved areas, groin fields will not be particularly<br />
effective. In addition they can accelerate erosion on the downdrift side of<br />
the groin. The design of “low profile” groins was intended to allow some<br />
sediment to pass over the structure during intermediate and high tide stages,<br />
reducing the risk of down drift erosion.<br />
From aerial imagery, most groins cannot be observed. However, effective<br />
groin fields appear as asymmetrical cusps where sediment has accumulated<br />
on the updrift side of the groin. The direction of net sediment drift is also<br />
evident.<br />
This inventory does not delineate individual groins. In the field, the first<br />
and last groin of a series is surveyed. Others between them are assumed to be<br />
evenly spaced. On the map composition, the groin field is designated as a linear<br />
feature extending along the shore.
Marina - Marinas are denoted as line features in this survey. They are a collection<br />
of docks and wharfs which can extend along an appreciable length of shore.<br />
Frequently they are associated with extensive bulkheading. Structures associated<br />
with a marina are not identified individually. This means any docks, wharfs,<br />
and bulkheads would not be delineated separately. Marinas are generally commercial<br />
operations. Community docks offering slips and launches <strong>for</strong> community<br />
residents are becoming more popular. They are usually smaller in scale than a<br />
commercial operation. To distinguish these facilities from commercial marinas,<br />
the riparian land use map (Plate A) will denote the use of the land at the site as<br />
residential <strong>for</strong> a community facility, rather than commercial.<br />
Marshes - Marshes can be extensive embayed marshes, or narrow, fragmented<br />
fringe marshes. The vegetation must be relatively well established, although not<br />
necessarily healthy.<br />
Miscellaneous - Miscellaneous point features represent short isolated segments<br />
along the shore where material has been dumped to protect a section of shore<br />
undergoing chronic erosion. Longer sections of shore are illustrated as line<br />
features. They can include tires, bricks, broken concrete rubble, and railroad ties<br />
as examples.<br />
Residential - Residential zones include rural and suburban size plots, as well as<br />
multi-family dwellings.<br />
Riprap - Generally composed of large rock to withstand wave energy, riprap<br />
revetments are constructed along shores to protect eroding fastland. Revetments<br />
today are preferred to bulkhead construction. They reduce wave reflection<br />
which causes scouring at the base of the structure, and are known to<br />
provide some habitat <strong>for</strong> aquatic and terrestrial species. Most revetments are<br />
constructed with a fine mesh filter cloth placed between the ground and the<br />
rock. The filter cloth permits water to permeate through, but prevents sediment<br />
behind the cloth from being removed, and causing the rock to settle. Revetments<br />
can be massive structures, extending along extensive stretches of shore,<br />
and up graded banks. When a bulkhead fails, riprap is often placed at the base<br />
<strong>for</strong> protection, rather than a bulkhead replacement. Riprap is also used to<br />
protect the edge of an eroding marsh. This use is known as toe protection. This<br />
inventory does not distinguish among the various types of revetments.<br />
Riprap revetments are popular along residential waterfront as a mechanism<br />
<strong>for</strong> stabilizing banks. Along commercial or industrial waterfront development<br />
such as marinas, bulkheads are still more common since they provide a<br />
facility along which a vessel can dock securely.<br />
Riprap is mapped as a linear feature using kinematic GPS data collection<br />
techniques. The maps illustrate riprap as a linear feature along the shore.<br />
Scrub-shrub - Scrub-shrub zones include trees less than 18 feet high, and is<br />
usually dominated by shrubs and bushy plants.<br />
Commercial docks on Easton Cove.
References<br />
Anderson, G.L., Williams, G.B., Peoples, M.H., Rosen, P., and C.H. Hobbs,<br />
1975. Shoreline Situation <strong>Report</strong> - York County, <strong>Virginia</strong>. Special <strong>Report</strong> in<br />
Applied Marine Science and Ocean Engineering No. 82, <strong>Virginia</strong> Institute<br />
of Marine Science, Gloucester Point, VA, 62 pp.<br />
Byrne, R.J. and G.L. Anderson, 1983. Shoreline Erosion in Tidewater <strong>Virginia</strong>.<br />
Special <strong>Report</strong> in Applied Marine Science and Ocean Engineering No.<br />
111, <strong>Virginia</strong> Institute of Marine Science, Gloucester Point, VA, 102 pp.<br />
City of Poquoson, 1999. City of Poquoson - 1999 Comprehensive Plan<br />
2004, Prepared by the Office of Planning and Zoning, City of Poquoson,<br />
<strong>Virginia</strong>, pp. 198.<br />
Hardaway, C.S., Thomas, G.R., Glover, J.B., Smithson, J.B., Berman, M.R.,<br />
and A.K. Kenne, 1992. Bank Erosion Study. Special <strong>Report</strong> in Applied<br />
Marine Science and Ocean Engineering No. 319, <strong>Virginia</strong> Institute of<br />
Marine Science, School of Marine Science, College of William and Mary,<br />
Gloucester Point, VA, 73 pp.<br />
Hobbs, C.H., III, Owen, D.W., and L.C. Morgan, 1979. Summary of Shoreline<br />
Situation <strong>Report</strong>s <strong>for</strong> <strong>Virginia</strong>’s Tidewater Localities. Special <strong>Report</strong> in<br />
Applied Marine Science and Ocean Engineering No. 209, <strong>Virginia</strong> Institute<br />
of Marine Science, Gloucester Point, VA, 32 pp.<br />
Ibison, N.A., Baumer, J.C., Hill, C.L., Burger, N.H., and J.E. Frye, 1992.<br />
Eroding bank nutrient verification study <strong>for</strong> the lower Chesapeake Bay.<br />
Department of Conservation and Recreation, Division of Soil and Water<br />
Conservation, Shoreline Programs Bureau, Gloucester Point, VA.<br />
Tippett, J., Sharp, E., Berman, M., Havens, K., Dewing, S., Glover, J.,<br />
Rudnicky, T., and C. Hershner, 2000. Rapidan River Watershed - Riparian<br />
Restoration Assessment, final report to the Chesapeake Bay Restoration<br />
Fund through the <strong>Center</strong> <strong>for</strong> <strong>Coastal</strong> <strong>Management</strong> and Policy, <strong>Virginia</strong><br />
Institute of Marine Science, College of William and Mary.<br />
Egrets utilize fringe marshes along Cedar Creek.