The Rise of VAT in Africa – Impact and Challenges - empcom.gov.in
The Rise of VAT in Africa – Impact and Challenges - empcom.gov.in
The Rise of VAT in Africa – Impact and Challenges - empcom.gov.in

Create successful ePaper yourself
Turn your PDF publications into a flip-book with our unique Google optimized e-Paper software.
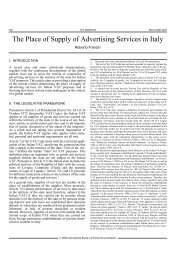
Table 3. <strong>VAT</strong> <strong>in</strong> <strong>Africa</strong> <strong>–</strong> ma<strong>in</strong> characteristics (2008)<br />
Country Year <strong>of</strong> adoption Rate(s) Registration threshold<br />
(<strong>in</strong> USD)<br />
Anglophone countries<br />
Botswana 2002 10 40,000 0.45<br />
Egypt 1992 10, 5, 20, 30 27,000 0.34<br />
Ethiopia 2003 15 54,000 0.32<br />
Ghana 1998 12.5 11,000 0.45<br />
Kenya 1990 16 75,000 0.32<br />
Lesotho 2003 14, 5, 15 80,000 0.37<br />
Malawi 2001 17.5 15,000 0.36<br />
Mauritius 1998 15 96,000 0.45<br />
Namibia 2000 15 28,000 0.33<br />
Nigeria 1994 5 0 0.33<br />
Rw<strong>and</strong>a 2001 18 38,000 0.27<br />
South <strong>Africa</strong> 1991 14 42,000 0.46<br />
Sudan 2000 10 50,000 0.13<br />
Tanzania 1998 20 32,000 0.26<br />
Ug<strong>and</strong>a 1996 18 20,000 0.23<br />
Zambia 1995 17.5 50,000 0.38<br />
Zimbabwe 2004 15 2,500 0.64<br />
Hispano/lusophone countries<br />
Cape Verde 2004 15 2,300 0.53<br />
Equatorial Gu<strong>in</strong>ea 2005 15 0 0.25<br />
Mozambique 1999 17 4,000 0.27<br />
Francophone countries<br />
Algeria 1992 17, 7 43,000 0.19<br />
Ben<strong>in</strong> 1991 18 80,000 2 0.35<br />
Burk<strong>in</strong>a Faso 1993 18 60,000 2 0.26<br />
Cameroon 1999 19.3 94,000 0.21<br />
Central <strong>Africa</strong> 2001 18 100,000 2 0.12<br />
Chad 2000 18 56,000 2 0.06<br />
Congo 1997 18.9, 5 36,000 2 0.18<br />
Gabon 1995 18, 10 150,000 2 0.12<br />
Gu<strong>in</strong>ea 1996 18 30,000 2 0.17<br />
Ivory Coast 1960 18 100,000 2 0.25<br />
Madagascar 1994 18 100,000 0.27<br />
Mali 1991 15, 10 60,000 0.45<br />
Mauritania 1995 14 24,000 2 0.38<br />
Morocco 1986 20, 7, 10, 14 200,000 2 0.33<br />
Niger 1986 19 60,000 2 0.09<br />
Senegal 1979 18 100,000 2 0.44<br />
Togo 1995 18 60,000 2 0.09<br />
Tunisia 1988 18, 6, 10, 29 78,000 2 0.34<br />
Efficiency ratio 1<br />
1. <strong>The</strong> ratio <strong>of</strong> <strong>VAT</strong> revenues to GDP divided by the st<strong>and</strong>ard rate <strong>of</strong> <strong>VAT</strong>. A different criterion to assess the efficiency <strong>of</strong> <strong>VAT</strong> is the “C-Efficiency ratio”, which is def<strong>in</strong>ed<br />
≈≈as the ratio <strong>of</strong> the share <strong>of</strong> <strong>VAT</strong> revenues <strong>in</strong> consumption, rather than GDP: see <strong>The</strong> Modern <strong>VAT</strong> (note 1), Chapter IV.<br />
2. Threshold applicable to supplies <strong>of</strong> goods. A different threshold applies to supplies <strong>of</strong> services.<br />
© IBFD INTERNATIONAL <strong>VAT</strong> MONITOR MAY/JUNE 2009<br />
Articles<br />
179