Handbook for Basic Process Improvement - Balanced Scorecard ...
Handbook for Basic Process Improvement - Balanced Scorecard ...
Handbook for Basic Process Improvement - Balanced Scorecard ...

You also want an ePaper? Increase the reach of your titles
YUMPU automatically turns print PDFs into web optimized ePapers that Google loves.
<strong>Handbook</strong><br />
<strong>for</strong><br />
<strong>Basic</strong> <strong>Process</strong><br />
<strong>Improvement</strong><br />
May 1996
<strong>Handbook</strong> <strong>for</strong> <strong>Basic</strong> <strong>Process</strong> <strong>Improvement</strong><br />
Table of Contents<br />
Section Page<br />
Introduction 1<br />
What is the new <strong>Handbook</strong> <strong>for</strong> <strong>Basic</strong> <strong>Process</strong> <strong>Improvement</strong>? 1<br />
What is a process? 1<br />
Who owns processes? 2<br />
What is process improvement? 2<br />
How does process improvement benefit the organization? 3<br />
How does an organization get started on process improvement? 3<br />
What’s in the <strong>Basic</strong> <strong>Process</strong> <strong>Improvement</strong> Model? 4<br />
Step 1: Select a process and establish the process improvement objective 7<br />
Step 2: Organize the “right” team 11<br />
Step 3: Flowchart the current process 17<br />
Step 4: Simplify the process and make changes 19<br />
Step 5: Develop a data collection plan and collect baseline data 21<br />
Step 6: Is the process stable? 23<br />
Step 7: Is the process capable? 25<br />
Step 8: Identify root causes <strong>for</strong> lack of capability 27<br />
Step 9: Plan to implement the process change 28<br />
Step 10: Modify the data collection plan, if necessary 30<br />
Step 11: Test the change and collect data 31<br />
Step 12: Is the modified process stable? 32<br />
Step 13: Did the process improve? 33<br />
Step 14: Standardize the process and reduce<br />
the frequency of data collection 35<br />
List of Forms<br />
<strong>Process</strong> Selection Worksheet 8<br />
Team Charter Worksheet 13<br />
<strong>Improvement</strong> Team Meeting Record 16<br />
i
ii<br />
<strong>Handbook</strong> <strong>for</strong> <strong>Basic</strong> <strong>Process</strong> <strong>Improvement</strong><br />
List of Illustrations<br />
Illustration Page<br />
<strong>Basic</strong> <strong>Process</strong> <strong>Improvement</strong> Model 5<br />
Step 1 flowchart 7<br />
Step 2 flowchart 11<br />
Sample Agenda 15<br />
Step 3 flowchart 17<br />
Step 4 flowchart 19<br />
Step 5 flowchart 21<br />
Step 6 flowchart 23<br />
Step 7 flowchart 25<br />
Plan-Do-Check-Act Cycle 26<br />
Step 8 flowchart 27<br />
Step 9 flowchart 28<br />
Step 10 flowchart 30<br />
Step 11 flowchart 31<br />
Step 12 flowchart 32<br />
Step 13 flowchart 33<br />
Step 14 flowchart 35
<strong>Handbook</strong> <strong>for</strong> <strong>Basic</strong> <strong>Process</strong> <strong>Improvement</strong><br />
Introduction<br />
What is the new <strong>Handbook</strong> <strong>for</strong> <strong>Basic</strong> <strong>Process</strong> <strong>Improvement</strong>?<br />
The new handbook has been developed to assist team leaders at all levels who are<br />
involved in process improvement ef<strong>for</strong>ts. Together with the <strong>Basic</strong> Tools <strong>for</strong> <strong>Process</strong><br />
<strong>Improvement</strong>, or “tools kit,” it provides the practical in<strong>for</strong>mation you need to initiate and<br />
successfully carry out process improvement activities.<br />
The approach and tools described in the handbook follow a <strong>Basic</strong> <strong>Process</strong> <strong>Improvement</strong><br />
Model. This model differs in many respects from the <strong>Process</strong> <strong>Improvement</strong> Flowchart<br />
found in the CNO-sponsored Starter Kit <strong>for</strong> <strong>Basic</strong> <strong>Process</strong> <strong>Improvement</strong> distributed to<br />
commanding officers several years ago. The <strong>Basic</strong> <strong>Process</strong> <strong>Improvement</strong> Model is much<br />
more detailed, in keeping with the “how to” approach used in the new handbook.<br />
Together, the model and handbook explain the actual actions teams must take to improve<br />
a process.<br />
Be<strong>for</strong>e diving into the step-by-step discussion, let’s first clarify some terms, look at the<br />
benefits of process improvement, and think about the best way to get started.<br />
What is a process?<br />
A process is no more than the steps and decisions involved in the way work is<br />
accomplished. Everything we do in our lives involves processes and lots of them.<br />
Here are some examples:<br />
writing a work order shooting a weapon getting out of bed<br />
repairing a valve ordering a part per<strong>for</strong>ming a test<br />
conducting an UNREP preparing a message loading a missile<br />
allocating a budget mooring a ship conducting a drill<br />
. . . and the list goes on.<br />
As you can see, the level of importance of processes varies.<br />
Some processes, such as conducting an UNREP or mooring a ship, are very<br />
important. If such a process per<strong>for</strong>ms very poorly—if it is not doing what it is<br />
supposed to do—the command might be unable to complete its mission.<br />
Other processes—<strong>for</strong> example, ordering a part, or developing a budget—are less<br />
significant in terms of the command’s mission. But, while they are less important to<br />
the overall operation of the command, such routine processes are still vital to the<br />
smooth functioning of an office or work center.<br />
1
2<br />
<strong>Handbook</strong> <strong>for</strong> <strong>Basic</strong> <strong>Process</strong> <strong>Improvement</strong><br />
Besides differing in importance, processes can be either simple or complicated.<br />
Some processes may be comparatively simple. Repairing a valve, <strong>for</strong> example,<br />
may be a relatively simple task involving only a few people and straight<strong>for</strong>ward<br />
procedures.<br />
On the other hand, some processes, such as conducting a main space fire drill, are<br />
very complicated. Many people are involved and numerous process steps and<br />
contributing processes are required.<br />
Who owns processes?<br />
Everyone has a stake in one or more processes. Groups of individuals usually share<br />
in—and “own”—the activities which make up a process. But the one individual who is<br />
ultimately responsible and accountable <strong>for</strong> the proper working of the process is known as<br />
the “process owner.” The process owner is the immediate supervisor or leader who has<br />
control over the entire process from beginning to end.<br />
A process owner may choose to be a team leader and participate directly in the actions of<br />
a process improvement team. Or, the process owner may decide to delegate the team<br />
leadership role to another person who is knowledgeable about the process. Whatever the<br />
case, it is very important <strong>for</strong> the process owner to stay in<strong>for</strong>med about the team’s actions<br />
and decisions affecting the process.<br />
What is process improvement?<br />
“<strong>Process</strong> improvement” means making things better, not just fighting fires or managing<br />
crises. It means setting aside the customary practice of blaming people <strong>for</strong> problems or<br />
failures. It is a way of looking at how we can do our work better.<br />
When we take a problem-solving approach or simply try to fix what’s broken, we may never<br />
discover or understand the root cause of the difficulty. Murphy’s Law comes into play and<br />
our ef<strong>for</strong>ts to “fix” things may actually make things worse.<br />
However, when we engage in true process improvement, we seek to learn what causes<br />
things to happen in a process and to use this knowledge to reduce variation, remove<br />
activities that contribute no value to the product or service produced, and improve<br />
customer satisfaction. A team examines all of the factors affecting the process: the<br />
materials used in the process, the methods and machines used to trans<strong>for</strong>m the materials<br />
into a product or service, and the people who per<strong>for</strong>m the work.
<strong>Handbook</strong> <strong>for</strong> <strong>Basic</strong> <strong>Process</strong> <strong>Improvement</strong><br />
How does process improvement benefit the organization?<br />
A standardized process improvement methodology allows us to look at how we per<strong>for</strong>m<br />
work. When all of the major players are involved in process improvement, they can<br />
collectively focus on eliminating waste—of money, people, materials, time, and<br />
opportunities. The ideal outcome is that jobs can be done cheaper, quicker, easier,<br />
and—most importantly—safer.<br />
A teamwork approach is intrinsic to life in the Navy. Using total quality tools and methods<br />
rein<strong>for</strong>ces teamwork. Using team members’ collective knowledge, experiences, and<br />
ef<strong>for</strong>ts is a powerful approach to improving processes. Through teamwork, the whole<br />
becomes greater than the sum of its parts.<br />
How does an organization get started on process improvement?<br />
An essential first step in getting started on process improvement is <strong>for</strong> the senior leader to<br />
make it a command priority. The importance of process improvement must be<br />
communicated from the top. Leaders need to foster an organizational environment in<br />
which a process improvement mentality can thrive and people are using quality-related<br />
tools and techniques on a regular basis.<br />
For the organization to reach this state, leaders must ensure that everyone receives the<br />
training that will enable them to carry out their process improvement ef<strong>for</strong>ts effectively.<br />
The TQL training made available within the DON provides background and learning<br />
experiences <strong>for</strong> leaders, quality advisors, TQL coordinators, and supervisors, who can then<br />
train teams on a just-in-time basis. In addition, this handbook has been developed to<br />
provide teams with a step-by-step approach <strong>for</strong> their process improvement ef<strong>for</strong>ts.<br />
Instilling a process improvement mentality in an organization can be difficult because it<br />
requires some different ways of thinking than we are accustomed to in the Navy. <strong>Process</strong><br />
improvement requires everyone to become a “fire preventer,” rather than a “fire fighter.”<br />
The focus is on improving a process over the long term, not just patching up procedures<br />
and work routines as problems occur. To get started on process improvement, leaders<br />
who have been fighting fires need to set aside the CO 2 bottle and start thinking in these<br />
terms:<br />
What process should we select <strong>for</strong> improvement?<br />
What resources are required <strong>for</strong> the improvement ef<strong>for</strong>t?<br />
Who are the right people to improve the selected process?<br />
What’s the best way to learn about the process?<br />
How do we go about improving the process?<br />
How can we institutionalize the improved process?<br />
3
4<br />
<strong>Handbook</strong> <strong>for</strong> <strong>Basic</strong> <strong>Process</strong> <strong>Improvement</strong><br />
What is in the <strong>Basic</strong> <strong>Process</strong> <strong>Improvement</strong> Model?<br />
The <strong>Basic</strong> <strong>Process</strong> <strong>Improvement</strong> Model is presented on the next page. It has two parts:<br />
A process simplification segment outlining steps 1 through 7 of the process<br />
improvement cycle is placed on the left. Teams begin process improvement<br />
activities with these steps. Depending on the stability and capability of the process,<br />
the team may continue on to step 8, or go directly to step 14.<br />
A Plan-Do-Check-Act (PDCA) Cycle consisting of steps 8 through 14 flows from<br />
the process simplification segment.<br />
Using all 14 steps of the model will increase the team’s process knowledge, broaden<br />
decision-making options, and enhance the likelihood of satisfactory long-term results.<br />
Let’s take a quick look at what’s in each of the steps in the model.<br />
Step 1: Select the process to be improved and establish a well-defined process<br />
improvement objective. The objective may be established by the team or come<br />
from outside tasking.<br />
Step 2: Organize a team to improve the process. This involves selecting the “right”<br />
people to serve on the team; identifying the resources available <strong>for</strong> the<br />
improvement ef<strong>for</strong>t, such as people, time, money, and materials; setting<br />
reporting requirements; and determining the team’s level of authority. These<br />
elements may be <strong>for</strong>malized in a written charter.<br />
Step 3: Define the current process using a flowchart. This tool is used to generate a<br />
step-by-step map of the activities, actions, and decisions which occur between<br />
the starting and stopping points of the process.<br />
Step 4: Simplify the process by removing redundant or unnecessary activities. People<br />
may have seen the process on paper in its entirety <strong>for</strong> the first time in Step 3.<br />
This can be a real eye-opener which prepares them to take these first steps in<br />
improving the process.<br />
Step 5: Develop a plan <strong>for</strong> collecting data and collect baseline data. These data will<br />
be used as the yardstick <strong>for</strong> comparison later in the model. This begins the<br />
evaluation of the process against the process improvement objective established<br />
in Step 1. The flowchart in Step 3 helps the team determine who should collect<br />
data and where in the process data should be collected.
Step 6<br />
Remove special<br />
cause(s)<br />
No<br />
<strong>Handbook</strong> <strong>for</strong> <strong>Basic</strong> <strong>Process</strong> <strong>Improvement</strong><br />
<strong>Basic</strong> <strong>Process</strong> <strong>Improvement</strong> Model<br />
Step 1<br />
Select a process and<br />
establish the improvement<br />
objective<br />
Step 2<br />
Organize the “right” team<br />
Step 3<br />
Flowchart the current<br />
process<br />
Step 4<br />
Simplify the process and<br />
make changes<br />
Step 5<br />
Develop a data<br />
collection plan and<br />
collect baseline data<br />
Step 6<br />
Is the process<br />
stable?<br />
Yes<br />
Step 7<br />
Is the process<br />
capable?<br />
No<br />
Yes<br />
Step 8<br />
Identify root causes <strong>for</strong><br />
lack of capability<br />
Step 12<br />
Remove the<br />
change<br />
A<br />
No<br />
Step 13<br />
Keep the<br />
change?<br />
Yes<br />
Step 14<br />
Is further<br />
improvement<br />
feasible?<br />
Yes<br />
No<br />
Step 10<br />
Modify the data collection<br />
plan (if necessary)<br />
No<br />
No<br />
A<br />
Step 9<br />
Plan to implement the<br />
process change<br />
Step 11<br />
Test the change and<br />
collect data<br />
Step 12<br />
Is the modified<br />
process<br />
stable?<br />
Yes<br />
Step 13<br />
Did the process<br />
improve?<br />
Yes<br />
Step 14<br />
Standardize the process<br />
and reduce the frequency<br />
of data collection<br />
5
6<br />
<strong>Handbook</strong> <strong>for</strong> <strong>Basic</strong> <strong>Process</strong> <strong>Improvement</strong><br />
Step 6: Assess whether the process is stable . The team creates a control chart or run<br />
chart out of the data collected in Step 5 to gain a better understanding of what is<br />
happening in the process. The follow-on actions of the team are dictated by<br />
whether special cause variation is found in the process.<br />
Step 7: Assess whether the process is capable . The team plots a histogram to<br />
compare the data collected in Step 5 against the process improvement objective<br />
established in Step 1. Usually the process simplification actions in Step 4 are<br />
not enough to make the process capable of meeting the objective and the team<br />
will have to continue on to Step 8 in search of root causes. Even if the data<br />
indicate that the process is meeting the objective, the team should consider<br />
whether it is feasible to improve the process further be<strong>for</strong>e going on to Step 14.<br />
Step 8: Identify the root causes which prevent the process from meeting the<br />
objective. The team begins the Plan-Do-Check-Act Cycle here, using the<br />
cause-and-effect diagram or brainstorming tools to generate possible reasons<br />
why the process fails to meet the desired objective.<br />
Step 9: Develop a plan <strong>for</strong> implementing a change based on the possible reasons <strong>for</strong><br />
the process’s inability to meet the objective set <strong>for</strong> it. These root causes were<br />
identified in Step 8. The planned improvement involves revising the steps in the<br />
simplified flowchart created after changes were made in Step 4.<br />
Step 10: Modify the data collection plan developed in Step 5, if necessary.<br />
Step 11: Test the changed process and collect data.<br />
Step 12: Assess whether the changed process is stable . As in Step 6, the team uses a<br />
control chart or run chart to determine process stability. If the process is stable,<br />
the team can move on to Step 13; if not, the team must return the process to its<br />
<strong>for</strong>mer state and plan another change.<br />
Step 13: Assess whether the change improved the process. Using the data collected in<br />
Step 11 and a histogram, the team determines whether the process is closer to<br />
meeting the process improvement objective established in Step 1. If the<br />
objective is met, the team can progress to Step 14; if not, the team must decide<br />
whether to keep or discard the change.<br />
Step 14: Determine whether additional process improvements are feasible. The team<br />
is faced with this decision following process simplification in Step 7 and again<br />
after initiating an improvement in Steps 8 through 13. In Step 14, the team has<br />
the choice of embarking on continuous process improvement by reentering the<br />
model at Step 9, or simply monitoring the per<strong>for</strong>mance of the process until<br />
further improvement is feasible.
Clearly state<br />
the process you are<br />
going to work on<br />
Establish the<br />
process improvement<br />
objective<br />
Write down the<br />
process improvement<br />
objective (be specific)<br />
Determine the<br />
starting and stopping<br />
points of the process<br />
Step 2<br />
<strong>Handbook</strong> <strong>for</strong> <strong>Basic</strong> <strong>Process</strong> <strong>Improvement</strong><br />
Step 1: Select a process and establish the<br />
process improvement objective<br />
Selecting the <strong>Process</strong><br />
When a command initially undertakes process improvement<br />
ef<strong>for</strong>ts, the Executive Steering Committee may identify problem<br />
areas and nominate the first processes to be investigated.<br />
Later, candidate processes may be identified at the deckplate<br />
level by work center supervisors. The <strong>Process</strong> Selection<br />
Worksheet on the next page can be used to guide selection at<br />
whatever level the choice is made.<br />
Some important considerations in selecting processes <strong>for</strong><br />
improvement are these:<br />
Total quality is predicated on understanding what is<br />
important to the customer. Every work unit—whether a large<br />
command or a small office—has both internal and external<br />
customers. Hence, the starting point in selecting a process<br />
<strong>for</strong> improvement is to obtain in<strong>for</strong>mation from customers<br />
about their satisfaction or dissatisfaction with the products or<br />
services produced by the organization.<br />
It’s best to start out small. Once people can handle<br />
improving a simple process, they can tackle more<br />
complicated ones.<br />
The selected process should occur often enough to be observed and documented. The<br />
team should be able to complete at least one improvement cycle within 30 to 90 days;<br />
otherwise, they may lose interest.<br />
The process boundaries have to be determined. These are the starting and stopping<br />
points of the process that provide a framework within which the team will conduct its<br />
process improvement ef<strong>for</strong>ts. As an example, the process by which a fire hose is<br />
routed to the scene of a casualty drill would have these boundaries:<br />
Starting Point - The drill is initiated or called away.<br />
Stopping Point - A properly manned fire hose is brought to bear on the fire.<br />
It is crucial to make sure that the steps involved in meeting the process improvement<br />
objective are located inside the boundaries.<br />
7
8<br />
<strong>Handbook</strong> <strong>for</strong> <strong>Basic</strong> <strong>Process</strong> <strong>Improvement</strong><br />
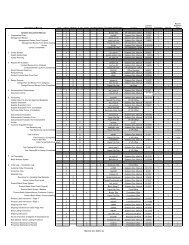
PROCESS SELECTION WORKSHEET<br />
STATE PROBLEMS OR EXPECTATIONS IDENTIFIED BY INTERVIEWING YOUR CUSTOMERS :<br />
a.<br />
b.<br />
c.<br />
d.<br />
PLACE A CHECKMARK NEXT TO ALL OF THE ITEMS THAT APPLY TO YOUR PROCESS :<br />
___1. The process can be defined. (Be careful not to pick something too big. It should be<br />
possible to complete the improvement ef<strong>for</strong>t within 90 days.)<br />
___2. A problem in the process occurs frequently. (A Pareto analysis may be helpful.)<br />
___3. The problem area is well-known and has visibility in the command, work center, or<br />
office.<br />
___4. <strong>Improvement</strong> of this process is important to the command.<br />
___5. People will appreciate it if the process is improved.<br />
___6. There is a good chance of success in improving the process.<br />
___7. No one else is currently working on this process.<br />
___8. Required changes can be put into effect with little or no outside help.<br />
___9. This is truly a process improvement ef<strong>for</strong>t, not just an attempt to impose a solution<br />
on a problem.<br />
NOTE: IF YOU HAVE SELECTED AN APPROPRIATE PROCESS, YOU<br />
SHOULD BE ABLE TO CHECK ALL OF THE ITEMS ABOVE.
<strong>Handbook</strong> <strong>for</strong> <strong>Basic</strong> <strong>Process</strong> <strong>Improvement</strong><br />
A Pareto analysis can help the team identify one or more factors or problems which<br />
occur frequently and can be investigated by the team. This analysis would be based on<br />
some preliminary data collected by the team. Pareto Charts are explained in the <strong>Basic</strong><br />
Tools <strong>for</strong> <strong>Process</strong> <strong>Improvement</strong>.<br />
After command members have some experience working with the <strong>Basic</strong> <strong>Process</strong><br />
<strong>Improvement</strong> Model, processes can be selected which have been per<strong>for</strong>ming poorly or<br />
which offer a potentially high payback in improving mission per<strong>for</strong>mance. The <strong>for</strong>mer<br />
category might include drills and procedures which are routinely accomplished in a less<br />
than satisfactory manner. The latter category includes mission critical processes, such<br />
as conducting main space fire drills. In each case, it’s best to move from the simple to<br />
the complicated, and from the better per<strong>for</strong>ming to the worst per<strong>for</strong>ming processes.<br />
A process that is primarily controlled, or significantly constrained, by outside factors is<br />
probably not a good candidate <strong>for</strong> improvement by command personnel. <strong>Process</strong>es<br />
selected must be controlled entirely within the lifelines of the command.<br />
Only one team should be assigned to work on each process improvement.<br />
Establishing the <strong>Process</strong> <strong>Improvement</strong> Objective<br />
Once a process is selected, the team needs to establish a well-defined process<br />
improvement objective. The definition of the objective should answer this question:<br />
What improvement do we want to accomplish by<br />
using a process improvement methodology?<br />
The process improvement objective is frequently discovered by listening to internal and<br />
external customers. The team can use interviews or written surveys to identify target<br />
values to use as goals <strong>for</strong> improving the product or service produced by the process.<br />
Identifying a problem associated with the process helps define the process improvement<br />
objective. The people working in the process can identify activities that take too long,<br />
involve too many man-hours, include redundant or unnecessary steps, or are subject to<br />
frequent breakdowns or other delays. But this is not just a problem-solving exercise; this<br />
is process improvement. Problems are symptoms of process failure, and it is the<br />
deficiencies in the process that must be identified and corrected.<br />
For an improvement ef<strong>for</strong>t to be successful, the team must start with a clear definition of<br />
what the problem is and what is expected from the process improvement. Let’s look at a<br />
couple of examples:<br />
Repairing the fourth stage seal of a high-pressure air compressor currently takes six<br />
hours. Internal customers would like that time reduced but are concerned that<br />
product quality may suffer if the process is changed. The team believes the repair<br />
9
10<br />
<strong>Handbook</strong> <strong>for</strong> <strong>Basic</strong> <strong>Process</strong> <strong>Improvement</strong><br />
time can be reduced to as little as four hours by improving the process. The<br />
process improvement objective can be stated this way: “High-pressure air<br />
compressor fourth stage seals are repaired in four hours or less, with no increase in<br />
the mean time between failures <strong>for</strong> the repaired parts.”<br />
If the way firefighters check <strong>for</strong> explosive gases in a compartment during a fire drill<br />
is described simply as “unsatisfactory,” few people will know how to state the<br />
process improvement objective. But, if the nature of the problem is clearly stated as<br />
“50 percent of the firefighters do not know how to operate the Explosivemeter,” the<br />
objective can be stated this way: “At least 95 percent of our firefighters can operate<br />
the Explosivemeter in a satisfactory manner.”<br />
A team <strong>for</strong>mulating a process improvement objective may find it helpful to proceed in this<br />
way:<br />
Write a description of the process, starting, “The process by which we...”<br />
Specify the objective of the process improvement ef<strong>for</strong>t.<br />
Operationally define the objective in writing. (See Module 1 of the <strong>Basic</strong> Tools <strong>for</strong><br />
<strong>Process</strong> <strong>Improvement</strong>.)<br />
Use numerical specification limits <strong>for</strong> process improvement objectives whenever<br />
possible. (See the discussion of process capability in Step 7.)<br />
A final note: Without a stated improvement objective, the team may conduct meetings but<br />
achieve little improvement in the effectiveness, efficiency, or safety of their process. A<br />
clearly stated process improvement objective keeps the team’s ef<strong>for</strong>ts focused on results.<br />
The tools the team needs to select the process to work on and establish the process<br />
improvement objective are described in the following modules of the <strong>Basic</strong> Tools <strong>for</strong><br />
<strong>Process</strong> <strong>Improvement</strong>:<br />
Module 1: Operational Definitions<br />
Module 2: Brainstorming<br />
Module 3: Decision-Making Tools<br />
Module 8: Pareto Chart
Step 1<br />
List all the people<br />
involved in steps<br />
within the boundaries<br />
of the process<br />
Pick members so<br />
the team covers<br />
knowledge of all<br />
of the steps<br />
Choose a<br />
team leader<br />
Execute a<br />
verbal or written<br />
charter <strong>for</strong> the team<br />
Assemble the team<br />
and brief them<br />
on the process<br />
Conduct team<br />
training on process<br />
improvement<br />
Step 3<br />
<strong>Handbook</strong> <strong>for</strong> <strong>Basic</strong> <strong>Process</strong> <strong>Improvement</strong><br />
Step 2: Organize the “right” team<br />
Team Composition<br />
Once the process has been selected and the boundaries<br />
established, the next critical step is selecting the “right” team<br />
to work on improving it. The right team consists of a good<br />
representation of people who work inside the boundaries of<br />
the process and have an intimate knowledge of the way it<br />
works.<br />
Team Size<br />
Teams consisting of 5 to 7 members seem to function most<br />
effectively. While larger teams are not uncommon, studies<br />
have shown that teams with more than 8 to 10 members may<br />
have trouble reaching consensus and achieving objectives.<br />
Team Leader<br />
The team leader may be chosen in any of several ways. The<br />
commanding officer, department head, or process owner may<br />
appoint a knowledgeable individual to lead the team, or the<br />
process owner may opt to fill the position personally.<br />
Alternatively, the team members may elect the team leader<br />
from their own ranks during the first meeting. Any of these<br />
methods of selecting a leader is acceptable.<br />
The team leader has the following responsibilities:<br />
Schedule and run the team’s meetings.<br />
Come to an understanding with the authority who <strong>for</strong>med<br />
or chartered the team on the following:<br />
The team’s decision-making authority. The team may only be able to make<br />
recommendations based on their data collection and analysis ef<strong>for</strong>ts; or, they may<br />
be granted authority to implement and test changes without prior approval.<br />
The time limit <strong>for</strong> the team to complete the improvement actions, if any.<br />
Determine how the team’s results and recommendations will be communicated to the<br />
chain of command.<br />
11
12<br />
<strong>Handbook</strong> <strong>for</strong> <strong>Basic</strong> <strong>Process</strong> <strong>Improvement</strong><br />
Arrange <strong>for</strong> the resources—money, material, training, other people—which the team<br />
needs to do the job.<br />
Decide how much time the team will devote to process improvement. Sometimes,<br />
improving a process is important enough to require a full-time ef<strong>for</strong>t by team members<br />
<strong>for</strong> a short period. At other times, the improvement ef<strong>for</strong>t is best conducted at intervals<br />
in one- or two-hour segments.<br />
Team Members<br />
Team members are selected by the team leader or the individual who <strong>for</strong>med the team.<br />
Members may be of various ranks, rates, paygrades, or ratings. Depending on the nature<br />
of the process, they may come from different departments, divisions, work centers, or<br />
offices. The key factor is that the people selected <strong>for</strong> the team should be closely involved<br />
in the process that is being improved.<br />
Being a team member has certain obligations. Members are responsible <strong>for</strong> carrying out<br />
all team-related work assignments, such as data collection, data analysis, presentation<br />
development, sharing knowledge, and participation in team discussions and decisions.<br />
Ideally, when actual process workers are on a team, they approach these responsibilities<br />
as an opportunity to improve the way their jobs are done, rather than as extra work.<br />
Team Charter<br />
A charter is a document that describes the boundaries, expected results, and resources to<br />
be used by a process improvement team. A charter is usually provided by the individual or<br />
group who <strong>for</strong>med the team. Sometimes the process owner or the team members develop<br />
a charter. A charter is always required <strong>for</strong> a team working on a process that crosses<br />
departmental lines. A charter may not be necessary <strong>for</strong> a team that is improving a process<br />
found solely within a work center of office space.<br />
A charter should identify the following:<br />
<strong>Process</strong> to be improved Time constraints, if applicable<br />
<strong>Process</strong> improvement objective Team’s decision-making authority<br />
Team leader assigned Resources to be provided<br />
Team members assigned Reporting requirements<br />
Other in<strong>for</strong>mation pertinent to the improvement ef<strong>for</strong>t may also be included, such as the<br />
names of the process owner and quality advisor, recommended frequency of meetings, or<br />
any other elements deemed necessary by those chartering the team. A <strong>for</strong>mat <strong>for</strong><br />
developing a team charter—the Team Charter Worksheet —is provided on the next page.
<strong>Handbook</strong> <strong>for</strong> <strong>Basic</strong> <strong>Process</strong> <strong>Improvement</strong><br />
TEAM CHARTER WORKSHEET<br />
PROCESS:_________________________________ PROCESS OWNER:________________<br />
PROCESS IMPROVEMENT OBJECTIVE : ___________________________________________<br />
________________________________________________________________________<br />
Team Leader:_____________________ Quality Advisor: ________________________<br />
TEAM MEMBER DEPT./DIV. TEAM MEMBER<br />
TEAM BOUNDARIES<br />
DEPT./DIV.<br />
DATE BEGIN: _________________________ DATE END:____________________________<br />
MEETING FREQUENCY: _______________________________________________________<br />
DECISION-MAKING AUTHORITY: _________________________________________________<br />
________________________________________________________________________<br />
________________________________________________________________________<br />
RESOURCES AVAILABLE: ______________________________________________________<br />
________________________________________________________________________<br />
________________________________________________________________________<br />
REPORTING REQUIREMENTS:___________________________________________________<br />
________________________________________________________________________<br />
OTHER INFORMATION:________________________________________________________<br />
________________________________________________________________________<br />
CHARTERED BY :____________________________________D ATE:_________________<br />
13
Team Ground Rules<br />
14<br />
<strong>Handbook</strong> <strong>for</strong> <strong>Basic</strong> <strong>Process</strong> <strong>Improvement</strong><br />
No process improvement team should go beyond Step 2 without developing a clear-cut set<br />
of ground rules <strong>for</strong> the operation of the team. The ground rules act as a code of conduct<br />
<strong>for</strong> team members and provide a basic structure <strong>for</strong> conducting effective meetings. Some<br />
areas in which ground rules should be established are:<br />
Attendance Expectation of regular attendance at meetings, acceptable reasons <strong>for</strong><br />
missing meetings, whether to allow alternates to attend when members<br />
must be absent, number of members required to conduct business.<br />
Promptness Starting and ending time <strong>for</strong> meetings.<br />
Preparation Expectation that team members will complete assignments in advance<br />
and come prepared <strong>for</strong> each meeting.<br />
Participation Active listening, suspending personal beliefs, and free communication by<br />
all members.<br />
Courtesy One person talks at a time; no interruptions or side conversations; no<br />
personal attacks; all members treated as partners, not adversaries.<br />
Assignments Methods <strong>for</strong> making and tracking assignments and selecting the recorder.<br />
Decisions Decision-making procedures—consensus or open or closed majority vote.<br />
Focus Things to do to stay focused on the future, not rooted in the past.<br />
Guidelines <strong>for</strong> Effective Team Meetings<br />
The <strong>Improvement</strong> Team Meeting Record on page 17 is provided to help teams follow the<br />
guidelines <strong>for</strong> conducting effective meetings that are outlined below.<br />
Follow the meeting ground rules.<br />
Use an agenda. (See the agenda example at the top of the next page.)<br />
List the items to be discussed in as much detail as space permits.<br />
State time available <strong>for</strong> each item.<br />
Name who is responsible <strong>for</strong> each item.<br />
Publish the agenda in advance.
<strong>Handbook</strong> <strong>for</strong> <strong>Basic</strong> <strong>Process</strong> <strong>Improvement</strong><br />
AGENDA EXAMPLE<br />
AGENDA ITEM TIME RESPONSIBILITY<br />
1. Warmup (flowchart review) 5 min. MM1 Benson<br />
2. Review minutes and agenda 5 min. LTJG Smith<br />
3. Modify simplified flowchart 20 min. Team<br />
4. Prepare brief <strong>for</strong> CO 20 min. Team<br />
5. Evaluate meeting 5 min. LTJG Smith<br />
6. Prepare agenda <strong>for</strong> next meeting 5 min. MMC Todd<br />
Record minutes and action items.<br />
Evaluate the meeting.<br />
How did we do?<br />
What went well?<br />
What can we improve?<br />
Prepare an agenda <strong>for</strong> the next meeting.<br />
Distribute in<strong>for</strong>mation to team members.<br />
Training <strong>for</strong> the Team<br />
At this juncture, team members need to receive some training that will help them reach<br />
their process improvement objective. The Team Leader or Quality Advisor should provide<br />
training on how to operate effectively as a team as well as just-in-time training in the use of<br />
statistical tools. All aspects of team <strong>for</strong>mation and functioning are discussed in the DON<br />
TQL course, Team Skills and Concepts. Statistical and process management tools is<br />
explained in the <strong>Basic</strong> Tools <strong>for</strong> <strong>Process</strong> <strong>Improvement</strong> as well as in numerous DON TQL<br />
courses.<br />
15
16<br />
<strong>Handbook</strong> <strong>for</strong> <strong>Basic</strong> <strong>Process</strong> <strong>Improvement</strong><br />
IMPROVEMENT TEAM MEETING RECORD<br />
PROCESS IMPROVEMENT OBJECTIVE :_______________ MEETING NO.:_______________<br />
____________________________________________ DATE:______________________<br />
____________________________________________ LOCATION : __________________<br />
TEAM SPONSOR/PROCESS OWNER:_____________________________________________<br />
MEETING ATTENDANCE<br />
Name Name<br />
Team Leader Recorder<br />
Member Member<br />
Member Member<br />
Member Member<br />
Facilitator Guest<br />
AGENDA ITEM TIME RESPONSIBILITY NOTES<br />
1. Warmup<br />
2. Review minutes & agenda<br />
3.<br />
4.<br />
5.<br />
6.<br />
7. Evaluate meeting<br />
8. Prepare next mtg agenda<br />
ITEMS FOR NEXT MEETING’S AGENDA: ACTIONS TO BE TAKEN:<br />
1. 1.<br />
2. 2.<br />
3. 3.<br />
4. 4.<br />
5. 5.
Yes<br />
Step 2<br />
Draw a flowchart of exactly<br />
what happens between the<br />
starting and stopping points<br />
of the process<br />
Does the<br />
team agree that the<br />
flowchart is<br />
correct?<br />
No<br />
Observe the work as it is<br />
actually per<strong>for</strong>med<br />
Using the observations,<br />
modify the flowchart to<br />
reflect reality<br />
Step 4<br />
<strong>Handbook</strong> <strong>for</strong> <strong>Basic</strong> <strong>Process</strong> <strong>Improvement</strong><br />
Step 3: Flowchart the current process<br />
Be<strong>for</strong>e a team can improve a process, the members<br />
must understand how it works. The most useful tool <strong>for</strong><br />
studying the current process is a flowchart . This tool is<br />
explained in the <strong>Basic</strong> Tools <strong>for</strong> <strong>Process</strong> <strong>Improvement</strong>.<br />
To develop an accurate flowchart, the team assigns<br />
one or more members to observe the flow of work<br />
through the process. It may be necessary <strong>for</strong> the<br />
observers to follow the flow of activity through the<br />
process several times be<strong>for</strong>e they can see and chart<br />
what actually occurs. This record of where actions are<br />
taken, decisions are made, inspections are per<strong>for</strong>med,<br />
and approvals are required becomes the “as-is”<br />
flowchart. It may be the first accurate and complete<br />
picture of the process from beginning to end.<br />
As the team starts work on this first flowchart, they<br />
need to be careful to depict what is really happening in<br />
the process. They don’t want to fall into the trap of<br />
flowcharting how people think the process is working,<br />
how they would like it to work, or how an instruction or<br />
manual says it should work. Only an as-is flowchart<br />
that displays the process as it is actually working today<br />
can reveal the improvements that may be needed.<br />
When teams work on processes that cross<br />
departmental lines, they may have to talk to people at<br />
all levels across the command who are involved in or<br />
affected by the process they are working on. It is even<br />
more important to get an accurate picture of these cross-functional processes than those<br />
whose boundaries are inside a work unit or office.<br />
As an example, “launching a helicopter” is a cross-functional process involving contributing<br />
processes per<strong>for</strong>med by bridge personnel, controllers in the CIC, firefighting teams, the<br />
fueling team, engineers, the cargo handling team, flight deck personnel, and others. Each<br />
of these contributing processes has to be accurately flowcharted and clearly understood<br />
be<strong>for</strong>e the larger process can be improved.<br />
The goal of this step is <strong>for</strong> the team to fully understand the process be<strong>for</strong>e making any<br />
attempt to change it. Changing a process be<strong>for</strong>e it is fully understood can cause more<br />
problems than already exist.<br />
17
18<br />
<strong>Handbook</strong> <strong>for</strong> <strong>Basic</strong> <strong>Process</strong> <strong>Improvement</strong><br />
The team can define the current situation by answering these questions:<br />
Does the flowchart show exactly how things are done now?<br />
If not, what needs to be added or modified to make it an as-is picture of the<br />
process?<br />
Have the workers involved in the process contributed their knowledge of the<br />
process steps and their sequence?<br />
Are other members of the command involved in the process, perhaps as<br />
customers? What did they have to say about how it really works?<br />
After gathering this in<strong>for</strong>mation, is it necessary to rewrite your process<br />
improvement objective (Step 1)?<br />
The tools the team needs to develop a flowchart of the current, or as-is, process are<br />
explained in the following modules of the <strong>Basic</strong> Tools <strong>for</strong> <strong>Process</strong> <strong>Improvement</strong> :<br />
Module 1: Operational Definitions<br />
Module 6: Flowchart
No<br />
Step 5<br />
Any more<br />
steps to<br />
check?<br />
Remove the step<br />
Keep the step<br />
Yes<br />
Draw the flowchart of<br />
the simplified process<br />
Change the process<br />
No<br />
<strong>Process</strong><br />
still works<br />
Yes<br />
<strong>Handbook</strong> <strong>for</strong> <strong>Basic</strong> <strong>Process</strong> <strong>Improvement</strong><br />
Step 4: Simplify the process and make changes<br />
<strong>Process</strong> does<br />
not work<br />
Step 3<br />
Going through the<br />
process step-by-step,<br />
identify redundant and<br />
unnecessary steps<br />
Is the step<br />
necessary?<br />
Yes<br />
What<br />
would happen<br />
if this step were<br />
removed?<br />
Per<strong>for</strong>m sanity check<br />
using existing directives<br />
Is the<br />
team authorized<br />
to make changes<br />
to the process?<br />
No<br />
Obtain permission<br />
The team described the current<br />
process by developing a flowchart in<br />
Step 3. Reviewing this depiction of<br />
how the process really works helps<br />
team members spot problems in the<br />
process flow. They may locate steps<br />
or decision points that are<br />
redundant. They may find that the<br />
process contains unnecessary<br />
inspections. They may discover<br />
procedures that were installed in the<br />
past in an attempt to goof-proof the<br />
process after errors or failures were<br />
experienced. All of these eat up<br />
scarce resources.<br />
Besides identifying areas where<br />
resources are being wasted, the<br />
team may find a weak link in the<br />
process that they can bolster by<br />
adding one or more steps.<br />
But be<strong>for</strong>e stepping in to make<br />
changes in the process based on<br />
this preliminary review of the as-is<br />
flowchart, the team should answer<br />
the following questions <strong>for</strong> each<br />
step of the process:<br />
Can this step be done in<br />
parallel with other steps,<br />
rather than in sequence?<br />
Does this step have to be<br />
completed be<strong>for</strong>e another can<br />
be started, or can two or more<br />
steps be per<strong>for</strong>med at the<br />
same time?<br />
What would happen if this step were eliminated? Would the output of the process<br />
remain the same? Would the output be unacceptable because it is incomplete or<br />
has too many defects?<br />
Would eliminating this step achieve the process improvement objective?<br />
19
20<br />
<strong>Handbook</strong> <strong>for</strong> <strong>Basic</strong> <strong>Process</strong> <strong>Improvement</strong><br />
Is the step being per<strong>for</strong>med by the appropriate person?<br />
Is the step a work-around because of poor training or a safety net inserted to<br />
prevent recurrence of a failure?<br />
Is the step a single repeated action, or is it part of a rework loop which can be<br />
eliminated?<br />
Does the step add value to the product or service produced by the process?<br />
If the answers to these questions indicate waste, the team should consider doing away<br />
with the step. If a step or decision block can be removed without degrading the process,<br />
the team is recovering resources which can be used elsewhere in the organization.<br />
Eliminating redundant or unnecessary steps confers an added benefit: a decrease in cycle<br />
time. Only part of the time it takes to complete most processes is productive time; the rest<br />
is delay. Delay consists of waiting <strong>for</strong> someone to take action, waiting <strong>for</strong> a part to be<br />
received, and similar unproductive activities. Consequently, removing a step which causes<br />
delay reduces cycle time by decreasing the total time it takes to complete the process.<br />
After making preliminary changes in the process, the team should create a flowchart of<br />
the simplified process . Now comes the sanity check:<br />
Can the simplified process produce products or services acceptable<br />
to customers and in compliance with applicable existing directives?<br />
If the answer is “yes,” and the team has the authority to make changes, they should<br />
institute the simplified flowchart as the new standard picture of the process. But perhaps<br />
the team is required to get permission to make the recommended changes. In that case, a<br />
comparison of the simplified flowchart with the original as-is flowchart can become the<br />
centerpiece of a briefing to those in a position to grant approval.<br />
At this point, the people working in the process must be trained using the new flowchart of<br />
the simplified process. It is vital to ensure that they understand and adhere to the new way<br />
of doing business. Otherwise, the process will rapidly revert to the way it was be<strong>for</strong>e the<br />
improvement team started work.<br />
The tools the team needs to simplify the current process and make preliminary changes<br />
are explained in the following modules of the <strong>Basic</strong> Tools <strong>for</strong> <strong>Process</strong> <strong>Improvement</strong> :<br />
Module 1: Operational Definitions<br />
Module 6: Flowchart
Step 4<br />
With the process improvement<br />
objective in mind, use the<br />
flowchart to determine where<br />
the characteristic is produced<br />
Annotate the flowchart with<br />
the measurement points<br />
Develop a data collection plan<br />
to ensure that all data takers<br />
know what, why, how, where,<br />
and how often to take data<br />
Create a data collection <strong>for</strong>m<br />
and train data collectors<br />
Begin collecting baseline<br />
data<br />
<strong>Handbook</strong> <strong>for</strong> <strong>Basic</strong> <strong>Process</strong> <strong>Improvement</strong><br />
Step 5: Develop a data collection plan<br />
and collect baseline data<br />
Steps 1 through 4 have taken the team through a process<br />
simplification phase of process improvement. In this<br />
phase, all decisions were based on experience, qualitative<br />
knowledge of the process, and perceptions of the best<br />
way to operate.<br />
For the remaining steps in the <strong>Basic</strong> <strong>Process</strong> <strong>Improvement</strong><br />
Model, the team will be using a more scientific approach.<br />
Steps 5 through 14 of the model rely on statistical data<br />
which, when collected and analyzed, are used to make<br />
decisions about the process. In Step 5, the team develops<br />
a data collection plan, as described in the <strong>Basic</strong> Tools <strong>for</strong><br />
<strong>Process</strong> <strong>Improvement</strong>.<br />
The process improvement objective established in Step 1<br />
is based on customers’ expectations and needs regarding<br />
the product or service produced by the process. When the<br />
team develops a data collection plan, they must first<br />
identify the characteristic of the product or service that<br />
has to be changed in order to meet the objective. Let’s<br />
look at an example:<br />
The local Navy Exchange food court prepares coffee and<br />
sells it to patrons. The coffee is brewed in a separate urn<br />
in the kitchen, then transferred to an urn on the food line.<br />
Lately, customers have been complaining that the coffee<br />
is too cold when dispensed on the food line.<br />
Step 6<br />
A team interested in improving this situation developed a<br />
process improvement objective that the coffee would be<br />
delivered to customers at a temperature between 109 and<br />
111 degrees Fahrenheit. They then looked at their<br />
simplified flowchart to identify individual steps where measurements should be taken.<br />
Some members of the team thought that the water temperature should be measured as it<br />
boiled prior to the actual brewing of the coffee. Others thought that such a measurement<br />
might be easy to obtain, and even interesting, but it would not help them understand why<br />
cold coffee was found on the serving line.<br />
21
22<br />
<strong>Handbook</strong> <strong>for</strong> <strong>Basic</strong> <strong>Process</strong> <strong>Improvement</strong><br />
The key to this segment of the model is to use process knowledge and common sense in<br />
determining where to take measurements. The team should ask:<br />
Will the data collected at this point help us<br />
decide what to do to improve the process?<br />
The team in the example investigated the process further and opted to take measurements<br />
of the temperature of the coffee at the urn on the serving line.<br />
Once the team determines what data to collect—and why, how, where, and when to collect<br />
it—they have the rudiments of a data collection plan. To implement the data collection<br />
plan, the team develops a data collection sheet. This data collection sheet must include<br />
explicit directions on how and when to use it. The team should try to make it as userfriendly<br />
as possible.<br />
The team can collect baseline data when, and only when, the data collection plan is in<br />
place, the data collection sheet has been developed, and the data collectors have been<br />
trained in the procedures to use.<br />
The tools the team needs to develop a data collection plan and begin collecting baseline<br />
data are explained in the following modules of the <strong>Basic</strong> Tools <strong>for</strong> <strong>Process</strong> <strong>Improvement</strong> :<br />
Module 1: Operational Definitions<br />
Module 2: Brainstorming<br />
Module 6: Flowchart<br />
Module 7: Data Collection
Use X-Bar and R<br />
or X and Moving<br />
Range Control<br />
Chart or Run Chart<br />
Plot the data on the<br />
applicable chart<br />
Are<br />
any of the<br />
rules <strong>for</strong> assessing<br />
stability<br />
violated?<br />
No<br />
Step 7<br />
Yes<br />
Variables<br />
Data<br />
<strong>Handbook</strong> <strong>for</strong> <strong>Basic</strong> <strong>Process</strong> <strong>Improvement</strong><br />
Step 6: Is the process stable?<br />
Step 5<br />
Assemble the data<br />
collection sheets<br />
from Step 5<br />
What type<br />
of data was<br />
collected?<br />
Attribute<br />
Data<br />
Use X and Moving<br />
Range Control Chart<br />
or Run Chart<br />
Find the reason(s)<br />
<strong>for</strong> the special cause<br />
variation<br />
Step 5<br />
In this step, the team analyzes the baseline<br />
data collected in Step 5. Two tools which<br />
are useful in this analysis are a control<br />
chart and a run chart . Both of these tools<br />
organize the data and allow the team to<br />
make sense of a mass of confusing<br />
in<strong>for</strong>mation. They are explained in the<br />
<strong>Basic</strong> Tools <strong>for</strong> <strong>Process</strong> <strong>Improvement</strong>.<br />
Control charts are better at revealing<br />
whether a process is stable and its future<br />
per<strong>for</strong>mance predictable. However, even if<br />
a team begins with the simpler run chart,<br />
they can convert it to a control chart with a<br />
little extra work. These two tools are<br />
important because they help teams identify<br />
special cause variation in the process.<br />
Whenever an individual or a team repeats a<br />
sequence of actions, there will be some<br />
variation in the process. Let’s look at an<br />
example:<br />
Think about the amount of time it took you<br />
to get up in the morning, get dressed, and<br />
leave your house <strong>for</strong> work during the past<br />
four weeks. Although the average time<br />
was 28 minutes, no two days were exactly<br />
the same. On one occasion it took 48<br />
minutes <strong>for</strong> you to get out of the house.<br />
This is where a control chart or a run chart can help you analyze the data. Control Charts,<br />
and to a lesser extent run charts, display variation and unusual patterns such as runs,<br />
trends, and cycles. Data which are outside the computed control limits, or unusual<br />
patterns in the graphic display of data, may be signals of the presence of special cause<br />
variation that should be investigated.<br />
In our example, investigation revealed that you were delayed by an early-morning phone<br />
call from one of your children who is at college. The data provided a signal of special<br />
cause variation in your getting-off-to-work process.<br />
23
24<br />
<strong>Handbook</strong> <strong>for</strong> <strong>Basic</strong> <strong>Process</strong> <strong>Improvement</strong><br />
But what if, over a period of 10 days, a series of times is recorded that averaged 48<br />
minutes? It seems that your getting-off-to-work process now includes making breakfast <strong>for</strong><br />
your son and daughter. This is not just a variation. The data indicate that your process<br />
has changed .<br />
While this example portrayed an obvious change in the process, subtle changes often<br />
occur without the knowledge of the workers. These minor changes produce enough<br />
variation to be evident when the data are analyzed. If special cause variation is found in<br />
the process, the team is obliged to find the cause be<strong>for</strong>e moving on to the next step in<br />
the model. Depending on the nature of the special cause, the team may act to remove it,<br />
take note of it but no action, or incorporate it in the process.<br />
When special cause variation reduces the effectiveness and efficiency of the process,<br />
the team must investigate the root cause and take action to remove it.<br />
If it is determined that the special cause was temporary in nature, no action may be<br />
required beyond understanding the reason <strong>for</strong> it. In the example above, the early<br />
phone call caused a variation in the data which was easily explained and required no<br />
further action.<br />
Occasionally, special cause variation actually signals an improvement in the process,<br />
bringing it closer to the process improvement objective. When that happens, the team<br />
may want to incorporate the change permanently.<br />
If the team fails to investigate a signal of special cause variation and continues on with<br />
their improvement activities, the process may be neither stable nor predictable in the<br />
future. This lack of stability and predictability may cause additional problems to occur,<br />
preventing the team from achieving the process improvement objective.<br />
The tools the team needs to assess whether the process is stable are explained in the<br />
following modules of the <strong>Basic</strong> Tools <strong>for</strong> <strong>Process</strong> <strong>Improvement</strong> :<br />
Module 1: Operational Definitions<br />
Module 2: Brainstorming<br />
Module 5: Cause-and-Effect Diagram<br />
Module 6: Flowchart<br />
Module 7: Data Collection<br />
Module 9: Run Chart<br />
Module 10: Control Chart
No<br />
Step 6<br />
Plot specification limits<br />
in the Histogram<br />
Are all<br />
data points inside<br />
the specification<br />
limits?<br />
Step 8<br />
Yes<br />
Plot the data collected in<br />
Step 5 in a Histogram<br />
Plot the process<br />
improvement objective<br />
as the target value in<br />
the Histogram<br />
Yes<br />
<strong>Handbook</strong> <strong>for</strong> <strong>Basic</strong> <strong>Process</strong> <strong>Improvement</strong><br />
Step 7: Is the process capable?<br />
Do<br />
specification<br />
limits exist?<br />
No<br />
Does the<br />
Histogram’s<br />
shape approximate<br />
a<br />
bell curve?<br />
Yes<br />
Are the<br />
data points<br />
close enough to<br />
the target?<br />
Yes<br />
No<br />
No<br />
Step 8<br />
Once the process has been<br />
stabilized, the data collected in Step<br />
5 is used again. This time the team<br />
plots the individual data points to<br />
produce a bar graph called a<br />
histogram . This tool is explained in<br />
the <strong>Basic</strong> Tools <strong>for</strong> <strong>Process</strong><br />
<strong>Improvement</strong>.<br />
To prepare the histogram, the team<br />
superimposes the target value <strong>for</strong><br />
the process on the bar graph. The<br />
target value was established in Step<br />
1 as the process improvement<br />
objective .<br />
If there are upper and/or lower<br />
specification limits <strong>for</strong> the process,<br />
the team should plot them also.<br />
(Note: Specification limits are not the<br />
same as the upper and lower control<br />
limits used in control charts.)<br />
Once the data, the target value, and<br />
the specification limits (if applicable)<br />
are plotted, the team can determine<br />
whether the process is capable . The<br />
following questions can be used to<br />
guide the team’s thinking:<br />
Step 14<br />
Are there any unusual<br />
patterns in the plotted data?<br />
Does the bar graph have<br />
multiple tall peaks and steep<br />
valleys? This may be an indication that other processes are influencing the process<br />
the team is investigating.<br />
Do all of the data points fall inside the upper and lower specification limits (if<br />
applicable)? If not, the process is not capable.<br />
If all of the data points fall within the specification limits, are the data grouped<br />
closely enough to the target value? This is a judgment call by the team. While the<br />
process is capable, the team may not be satisfied with the results it produces. If<br />
25
26<br />
<strong>Handbook</strong> <strong>for</strong> <strong>Basic</strong> <strong>Process</strong> <strong>Improvement</strong><br />
that’s the case, the team may elect to continue trying to improve the process by<br />
entering Step 8 of the <strong>Basic</strong> <strong>Process</strong> <strong>Improvement</strong> Model.<br />
If there are no specification limits <strong>for</strong> the process, does the shape of the<br />
histogram approximate a bell curve? After examining the shape created by<br />
plotting the data on the histogram, the team has to decide whether the shape is<br />
satisfactory and whether the data points are close enough to the target value.<br />
These are subjective decisions. If the team is satisfied with both the shape and the<br />
clustering of data points, they can choose to standardize the simplified process or to<br />
continue through the steps of the <strong>Basic</strong> <strong>Process</strong> <strong>Improvement</strong> Model.<br />
From here to the end of the <strong>Basic</strong> <strong>Process</strong> <strong>Improvement</strong> Model, the team is going to use a<br />
scientific methodology <strong>for</strong> conducting process improvement called the Plan-Do-Check-Act<br />
(PDCA) Cycle. They will plan a change, conduct a test and collect data, evaluate the test<br />
results to find out whether the process improved, and decide whether to standardize or<br />
continue to improve the process. The PDCA Cycle is just that: a cycle. There are no<br />
limitations on how many times the team can attempt to improve the process incrementally.<br />
Act<br />
(Steps 13 & 14)<br />
Check<br />
(Steps 12 & 13)<br />
Plan<br />
(Steps 9 & 10)<br />
Do<br />
(Step 11)<br />
The tools the team needs to assess whether the process is capable are explained in the<br />
following modules of the <strong>Basic</strong> Tools <strong>for</strong> <strong>Process</strong> <strong>Improvement</strong> :<br />
Module 1: Operational Definitions<br />
Module 7: Data Collection<br />
Module 11: Histogram
Use multivoting or Nominal<br />
Group Technique (Part 2) to<br />
identify the most likely cause<br />
<strong>for</strong> lack of process capability<br />
<strong>Handbook</strong> <strong>for</strong> <strong>Basic</strong> <strong>Process</strong> <strong>Improvement</strong><br />
Step 8: Identify root causes <strong>for</strong> lack of capability<br />
No<br />
Step 7<br />
Brainstorm causes that may be<br />
affecting the ability of the<br />
process to meet the process<br />
improvement objective<br />
Create a Cause-and-Effect<br />
Diagram<br />
Can the<br />
causes be verified<br />
from the data<br />
collected?<br />
Step 9<br />
Yes<br />
Plot the data in a Pareto Chart<br />
Select a root cause to work on<br />
to improve the process<br />
Assess whether other people<br />
are needed to help with this<br />
process improvement<br />
Steps 1 through 7 of the model<br />
were concerned with gaining an<br />
understanding of the process and<br />
documenting it. In Step 8, the<br />
team begins the PDCA Cycle by<br />
identifying the root causes of a<br />
lack of process capability.<br />
The data the team has looked at<br />
so far measure the output of the<br />
process. To improve the<br />
process, the team must find what<br />
causes the product or service to<br />
be unsatisfactory. The team uses<br />
a cause-and-effect diagram to<br />
identify root causes. This tool is<br />
explained in the <strong>Basic</strong> Tools <strong>for</strong><br />
<strong>Process</strong> <strong>Improvement</strong>.<br />
Once the team identifies possible<br />
root causes, it is important to<br />
collect data to determine how<br />
much these causes actually affect<br />
the results . People are often<br />
surprised to find that the data do<br />
not substantiate their predictions,<br />
or their gut feelings, as to root<br />
causes.<br />
The team can use a Pareto chart<br />
to show the relative importance of<br />
the causes they have identified.<br />
The tools the team needs to<br />
identify the root causes <strong>for</strong> lack of capability are explained in the following modules of the<br />
<strong>Basic</strong> Tools <strong>for</strong> <strong>Process</strong> <strong>Improvement</strong> :<br />
Module 1: Operational Definitions<br />
Module 2: Brainstorming<br />
Module 3: Decision-Making Tools<br />
Module 4: Affinity Diagram<br />
Module 5: Cause-and-Effect Diagram<br />
Module 8: Pareto Chart<br />
27
28<br />
Obtain<br />
permission<br />
No<br />
Step 8<br />
Plan a change in the process that<br />
either removes or reduces the<br />
effect of the root cause identified in<br />
Step 8<br />
Modify the flowchart to reflect the<br />
new process<br />
In<strong>for</strong>m all people affected by the<br />
change in the process of the<br />
modifications made<br />
Is the team<br />
authorized to change<br />
the process?<br />
Yes<br />
Change the process<br />
Step 10<br />
<strong>Handbook</strong> <strong>for</strong> <strong>Basic</strong> <strong>Process</strong> <strong>Improvement</strong><br />
Step 9: Plan to implement the process change<br />
Who is responsible <strong>for</strong> implementing the change?<br />
What has to be done to implement the change?<br />
Where will the change be implemented?<br />
How will the implementation be controlled?<br />
At what steps in the process will measurements be taken?<br />
How will data be collected?<br />
Step 9 begins the Plan phase of the PDCA<br />
Cycle. Steps 9 and 10 together comprise the<br />
whole Plan phase.<br />
After considering the possible root causes<br />
identified in Step 8, the team picks one to work<br />
on. They then develop a plan to implement a<br />
change in the process to reduce or eliminate<br />
the root cause.<br />
The major features of the plan include<br />
changing the simplified flowchart created in<br />
Step 4 and making all of the preparations<br />
required to implement the change.<br />
The team can use the following list of<br />
questions as a guide in developing the plan:<br />
What steps in the process will be<br />
changed?<br />
Are there any risks associated with the<br />
proposed change?<br />
What will the change cost? The cost<br />
includes not only money, but time,<br />
number of people, materials used, and<br />
other factors.<br />
What workers will be affected by the<br />
change?
<strong>Handbook</strong> <strong>for</strong> <strong>Basic</strong> <strong>Process</strong> <strong>Improvement</strong><br />
Is a small-scale test necessary prior to full implementation of the change?<br />
How long will the test last?<br />
What is the probability of success?<br />
Is there a downside to the proposed change?<br />
Once the improvement plan is <strong>for</strong>mulated, the team makes the planned changes in the<br />
process, if empowered by the team charter to do so. Otherwise, the team presents the<br />
improvement plan to the process owner, or other individual who <strong>for</strong>med the team, to obtain<br />
approval to proceed.<br />
The tools the team needs to plan to implement the process change are explained in the<br />
following modules of the <strong>Basic</strong> Tools <strong>for</strong> <strong>Process</strong> <strong>Improvement</strong> :<br />
Module 1: Operational Definitions<br />
Module 2: Brainstorming<br />
Module 3: Decision-Making Tools<br />
Module 4: Affinity Diagram<br />
Module 5: Cause-and-Effect Diagram<br />
Module 6: Flowchart<br />
Module 7: Data Collection<br />
29
30<br />
Step 9<br />
Is the Data<br />
Collection Plan<br />
developed in Step 5<br />
valid <strong>for</strong> measuring<br />
the changed<br />
process?<br />
No<br />
Modify the plan to<br />
provide the data needed<br />
to assess per<strong>for</strong>mance<br />
of the changed process<br />
Yes<br />
Step 11<br />
<strong>Handbook</strong> <strong>for</strong> <strong>Basic</strong> <strong>Process</strong> <strong>Improvement</strong><br />
Step 10: Modify the data collection plan, if necessary<br />
Step 10 concludes the Plan phase of the PDCA<br />
cycle.<br />
Reviewing the data collection plan<br />
The data collection plan was originally developed in<br />
Step 5. Since the process is going to change when<br />
the planned improvement is instituted, the team must<br />
now review the original plan to ensure that it is still<br />
capable of providing the data the team needs to<br />
assess process per<strong>for</strong>mance.<br />
Modifying the data collection plan<br />
If the determination is made that the data collection<br />
plan should be modified, the team considers the<br />
same things and applies the same methodologies as<br />
in Step 5.<br />
The tools the team needs to modify the data collection plan are explained in the following<br />
modules of the <strong>Basic</strong> Tools <strong>for</strong> <strong>Process</strong> <strong>Improvement</strong> :<br />
Module 1: Operational Definitions<br />
Module 2: Brainstorming<br />
Module 4: Affinity Diagram<br />
Module 6: Flowchart<br />
Module 7: Data Collection
Step 10<br />
Plan the test of the new process<br />
Train everyone involved in the<br />
test and standardize the process<br />
among the workers<br />
Distribute the data collection<br />
sheets<br />
Test the improved process and<br />
collect data<br />
Once the test is completed,<br />
retain and collate the data<br />
collection sheets<br />
Step 12<br />
<strong>Handbook</strong> <strong>for</strong> <strong>Basic</strong> <strong>Process</strong> <strong>Improvement</strong><br />
Step 11: Test the change and collect data<br />
Finalize the test plan.<br />
Prepare the data collection sheets.<br />
Train everyone involved in the test.<br />
Distribute the data collection sheets.<br />
Change the process to test the improvement.<br />
Collect and collate the data.<br />
Step 11 is the Do phase of the PDCA cycle.<br />
If feasible, the change should be implemented on a limited<br />
basis be<strong>for</strong>e it is applied to the entire organization. For<br />
example, the changed process could be instituted in a<br />
single office or work center while the rest of the command<br />
continues to use the old process. If the organization is<br />
working on a shift basis, the changed process could be<br />
tried on one shift while the other shifts continue as be<strong>for</strong>e.<br />
Whatever method the team applies, the goals are to prove<br />
the effectiveness of the change, avoid widespread failure,<br />
and maintain command-wide support.<br />
In some situations, a small-scale test is not feasible. If<br />
that is the case, the team will have to in<strong>for</strong>m everyone<br />
involved of the nature and expected effects of the change<br />
and conduct training adequate to support a full-scale test.<br />
The in<strong>for</strong>mation the team developed in Step 9 provides the<br />
outline <strong>for</strong> the test plan. During the test, it is important to<br />
collect appropriate data so that the results of the change<br />
can be evaluated. The team will have to take the<br />
following actions in conducting the test to determine<br />
whether the change actually resulted in process<br />
improvement:<br />
The tools the team needs to conduct the test and collect data are explained in the following<br />
modules of the <strong>Basic</strong> Tools <strong>for</strong> <strong>Process</strong> <strong>Improvement</strong> :<br />
Module 1: Operational Definitions<br />
Module 2: Brainstorming<br />
Module 4: Affinity Diagram<br />
Module 6: Flowchart<br />
Module 7: Data Collection<br />
31
32<br />
Use X-Bar and R or<br />
X and Moving<br />
Range Control Chart<br />
or a Run Chart<br />
Plot the data on the<br />
applicable chart<br />
Are<br />
any of the<br />
rules <strong>for</strong> assessing<br />
stability<br />
violated?<br />
No<br />
Step 13<br />
Variables<br />
Data<br />
Yes<br />
<strong>Handbook</strong> <strong>for</strong> <strong>Basic</strong> <strong>Process</strong> <strong>Improvement</strong><br />
Step 12: Is the modified process stable?<br />
Step 11<br />
Collect the data<br />
collection sheets<br />
from Step 11<br />
What type<br />
of data was<br />
collected?<br />
Step 9<br />
Attribute<br />
Data<br />
Use X and Moving<br />
Range Control Chart<br />
or a Run Chart<br />
Remove the<br />
change by returning<br />
the process to its<br />
earlier state<br />
Steps 12 and 13 together comprise the<br />
Check phase of the PDCA cycle.<br />
The team modified the process based on<br />
the improvement plan and conducted a<br />
test. During the test of the new procedure,<br />
data were collected. Now the team checks<br />
whether the expected results were<br />
achieved.<br />
The procedures in this step are identical to<br />
those in Step 6. The team uses the data<br />
they have collected to check the process<br />
<strong>for</strong> stability by preparing a control chart or<br />
run chart . Since the process has<br />
changed, it is appropriate to recompute the<br />
control limits <strong>for</strong> the control chart using the<br />
new data.<br />
If the data collected in Step 11 show that<br />
process per<strong>for</strong>mance is worse, the team<br />
must return to Step 8 and try to improve<br />
the process again. The process must be<br />
stable be<strong>for</strong>e the team goes on to the next<br />
step.<br />
The tools the team needs to assess<br />
whether the changed process is stable are<br />
explained in the following modules of the<br />
<strong>Basic</strong> Tools <strong>for</strong> <strong>Process</strong> <strong>Improvement</strong> :<br />
Module 1: Operational Definitions<br />
Module 2: Brainstorming<br />
Module 6: Flowchart<br />
Module 7: Data Collection<br />
Module 9: Run Chart<br />
Module 10: Control Chart
No<br />
Step 9<br />
Step 12<br />
Plot specification limits<br />
in the Histogram<br />
Are all<br />
data points<br />
inside the<br />
specification<br />
limits?<br />
Yes<br />
Yes<br />
<strong>Handbook</strong> <strong>for</strong> <strong>Basic</strong> <strong>Process</strong> <strong>Improvement</strong><br />
Step 13: Did the process improve?<br />
Plot the data<br />
collected in Step 11<br />
in a Histogram<br />
Plot the process<br />
improvement objective<br />
(developed in Step 1)<br />
as the target value in<br />
the Histogram<br />
Do specification<br />
limits exist?<br />
No<br />
Does<br />
the shape of<br />
the Histogram<br />
approximate a<br />
bell curve?<br />
Yes<br />
Are the<br />
data points<br />
close enough to<br />
the target?<br />
Yes<br />
No<br />
No<br />
Keep<br />
the<br />
change?<br />
Yes<br />
No<br />
Step 9<br />
Step 13 completes the Check<br />
phase of the PDCA cycle. The<br />
procedures are similar to those<br />
in Step 7.<br />
This is a good place <strong>for</strong> the team<br />
to identify any differences<br />
between the way they planned<br />
the process improvement and<br />
the way it was executed.<br />
The following questions will<br />
guide the team in checking the<br />
test results:<br />
Did the change in the<br />
process eliminate the<br />
root cause of the<br />
problem? Whether the<br />
answer is “yes” or “no,”<br />
describe what occurred.<br />
Are the data taken in<br />
Step 11 closer to the<br />
process improvement<br />
objective than the<br />
baseline data? This<br />
indicates how much or<br />
how little the process has<br />
improved.<br />
Were the expected<br />
Step 14<br />
results achieved? If not,<br />
the team should analyze<br />
the data further to<br />
find out why process per<strong>for</strong>mance improved less than expected or even became<br />
worse.<br />
Were there any problems with the plan? The team needs to review the planned<br />
improvement as well as the execution of the data collection ef<strong>for</strong>t.<br />
33
34<br />
<strong>Handbook</strong> <strong>for</strong> <strong>Basic</strong> <strong>Process</strong> <strong>Improvement</strong><br />
The tools the team needs to assess whether the change improved the process are<br />
explained in the following modules of the <strong>Basic</strong> Tools <strong>for</strong> <strong>Process</strong> <strong>Improvement</strong> :<br />
Module 1: Operational Definitions<br />
Module 2: Brainstorming<br />
Module 7: Data Collection<br />
Module 11: Histogram
Step 9<br />
Yes<br />
Step 14<br />
If the process<br />
is both stable and<br />
capable, are more<br />
changes<br />
feasible?<br />
No<br />
Standardize the process<br />
Reduce level of data<br />
collection conducted by<br />
in-process workers<br />
Generate lessons learned<br />
and spread the word<br />
<strong>Handbook</strong> <strong>for</strong> <strong>Basic</strong> <strong>Process</strong> <strong>Improvement</strong><br />
Step 14: Standardize the process and reduce<br />
the frequency of data collection<br />
Step 14 is the Act phase of the PDCA cycle. In this<br />
step, the team makes some important decisions.<br />
First, they must decide whether or not to implement<br />
the change on a full-scale basis. In making this<br />
decision, the team should answer the following:<br />
Is the process stable ?<br />
Is the process capable ?<br />
Do the results satisfy customers ?<br />
Does the team have authorization ?<br />
If the answers are affirmative, the changed process<br />
can be installed as the new standard process .<br />
Second, they must decide what to do next. Even<br />
when everything is in place <strong>for</strong> implementing and<br />
standardizing the process, the team still has to<br />
choose between two courses of action:<br />
Identifying possibilities <strong>for</strong> making further<br />
process changes. Assuming that resources are<br />
available and approval given, the team may<br />
choose to continue trying to improve the<br />
process by reentering the PDCA cycle at Step 9.<br />
Standardizing the changed process without further ef<strong>for</strong>ts to improve it. If this<br />
decision is made, the team is still involved—documenting the changes, monitoring<br />
process per<strong>for</strong>mance, and institutionalizing the process improvement.<br />
To standardize the changed process, the team initiates documentation changes<br />
involving procedures, instructions, manuals, and other related documentation.<br />
Training will have to be developed and provided to make sure everyone is using the<br />
new standard process.<br />
The team continues to use the data collection plan developed in Step 11 but<br />
significantly reduces the frequency of data collection by process workers. There are<br />
no hard-and-fast rules on how often to collect data at this stage, but, as a rule of<br />
thumb, the team can try reducing collection to a quarter of what is called <strong>for</strong> in the<br />
data collection plan. The team can then adjust the frequency of measurement as<br />
35
36<br />
<strong>Handbook</strong> <strong>for</strong> <strong>Basic</strong> <strong>Process</strong> <strong>Improvement</strong><br />
necessary. The point is, enough data must be collected to enable the team to<br />
monitor the per<strong>for</strong>mance of the process.<br />
The team must periodically assess whether the process remains stable and<br />
capable . To do this, the data collected in Step 14 should be entered into the control<br />
chart or run chart and histogram developed in Steps 12 and 13 respectively.<br />
Whichever course of action the team pursues, they should complete one last task:<br />
documenting the lessons learned during the process improvement ef<strong>for</strong>t and making<br />
the in<strong>for</strong>mation available to others.<br />
The tools the team needs to standardize the process and reduce the frequency of data<br />
collection are explained in the following modules of the <strong>Basic</strong> Tools <strong>for</strong> <strong>Process</strong><br />
<strong>Improvement</strong> :<br />
Module 2: Brainstorming<br />
Module 3: Decision-Making Tools<br />
Module 4: Affinity Diagram<br />
Module 6: Flowchart<br />
Module 7: Data Collection<br />
Module 9: Run Chart<br />
Module 10: Control Chart<br />
Module 11: Histogram