Midazolam and thiopentone co-induction - ResearchGate
Midazolam and thiopentone co-induction - ResearchGate
Midazolam and thiopentone co-induction - ResearchGate

You also want an ePaper? Increase the reach of your titles
YUMPU automatically turns print PDFs into web optimized ePapers that Google loves.
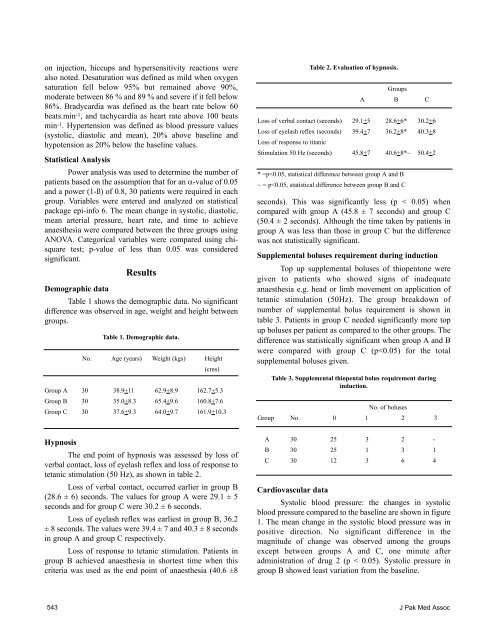
on injection, hiccups <strong>and</strong> hypersensitivity reactions were<br />
also noted. Desaturation was defined as mild when oxygen<br />
saturation fell below 95% but remained above 90%,<br />
moderate between 86 % <strong>and</strong> 89 % <strong>and</strong> severe if it fell below<br />
86%. Bradycardia was defined as the heart rate below 60<br />
beats.min -1, <strong>and</strong> tachycardia as heart rate above 100 beats<br />
min -1. Hypertension was defined as blood pressure values<br />
(systolic, diastolic <strong>and</strong> mean), 20% above baseline <strong>and</strong><br />
hypotension as 20% below the baseline values.<br />
Statistical Analysis<br />
Power analysis was used to determine the number of<br />
patients based on the assumption that for an α-value of 0.05<br />
<strong>and</strong> a power (1-ß) of 0.8, 30 patients were required in each<br />
group. Variables were entered <strong>and</strong> analyzed on statistical<br />
package epi-info 6. The mean change in systolic, diastolic,<br />
mean arterial pressure, heart rate, <strong>and</strong> time to achieve<br />
anaesthesia were <strong>co</strong>mpared between the three groups using<br />
ANOVA. Categorical variables were <strong>co</strong>mpared using chisquare<br />
test; p-value of less than 0.05 was <strong>co</strong>nsidered<br />
significant.<br />
Results<br />
Demographic data<br />
Table 1 shows the demographic data. No significant<br />
difference was observed in age, weight <strong>and</strong> height between<br />
groups.<br />
Hypnosis<br />
The end point of hypnosis was assessed by loss of<br />
verbal <strong>co</strong>ntact, loss of eyelash reflex <strong>and</strong> loss of response to<br />
tetanic stimulation (50 Hz), as shown in table 2.<br />
Loss of verbal <strong>co</strong>ntact, occurred earlier in group B<br />
(28.6 ± 6) se<strong>co</strong>nds. The values for group A were 29.1 ± 5<br />
se<strong>co</strong>nds <strong>and</strong> for group C were 30.2 ± 6 se<strong>co</strong>nds.<br />
Loss of eyelash reflex was earliest in group B, 36.2<br />
± 8 se<strong>co</strong>nds. The values were 39.4 ± 7 <strong>and</strong> 40.3 ± 8 se<strong>co</strong>nds<br />
in group A <strong>and</strong> group C respectively.<br />
Loss of response to tetanic stimulation. Patients in<br />
group B achieved anaesthesia in shortest time when this<br />
criteria was used as the end point of anaesthesia (40.6 ±8<br />
543<br />
Table 1. Demographic data.<br />
No. Age (years) Weight (kgs) Height<br />
(cms)<br />
Group A 30 38.9+11 62.9+8.9 162.7+5.3<br />
Group B 30 35.0+8.3 65.4+9.6 160.8+7.6<br />
Group C 30 37.6+9.3 64.0+9.7 161.9+10.3<br />
Table 2. Evaluation of hypnosis.<br />
A<br />
Groups<br />
B C<br />
Loss of verbal <strong>co</strong>ntact (se<strong>co</strong>nds) 29.1+5 28.6+6* 30.2+6<br />
Loss of eyelash reflex (se<strong>co</strong>nds)<br />
Loss of response to titanic<br />
39.4+7 36.2+8* 40.3+8<br />
Stimulation 50 Hz (se<strong>co</strong>nds) 45.8+7 40.6+8*~ 50.4+2<br />
* =p