DATA LOGGING HOT WIRE ANEMOMETER with CFM/CMM and 8:1 ...
DATA LOGGING HOT WIRE ANEMOMETER with CFM/CMM and 8:1 ...
DATA LOGGING HOT WIRE ANEMOMETER with CFM/CMM and 8:1 ...

You also want an ePaper? Increase the reach of your titles
YUMPU automatically turns print PDFs into web optimized ePapers that Google loves.
<strong>DATA</strong> <strong>LOGGING</strong><br />
<strong>HOT</strong> <strong>WIRE</strong> <strong>ANEMOMETER</strong> <strong>with</strong><br />
<strong>CFM</strong>/<strong>CMM</strong> <strong>and</strong> 8:1 IR THERMOMETER<br />
USER’S MANUAL<br />
CIH20DL<br />
Please read this manual carefully <strong>and</strong> thoroughly before using this product.
TABLE OF CONTENTS<br />
2<br />
Introduction . . . . . . . . . . . . . . . . . . . . . . . . . . . . . . . . . . . . . . . . . . . . . . . . 3 – 4<br />
Key Features . . . . . . . . . . . . . . . . . . . . . . . . . . . . . . . . . . . . . . . . . . . . . . . . . . 4<br />
Safety Instructions . . . . . . . . . . . . . . . . . . . . . . . . . . . . . . . . . . . . . . . . . . . . . 5<br />
What’s in the Case . . . . . . . . . . . . . . . . . . . . . . . . . . . . . . . . . . . . . . . . . . . . . 5<br />
Product Overview . . . . . . . . . . . . . . . . . . . . . . . . . . . . . . . . . . . . . . . . . . . 5 – 7<br />
Setup Instructions . . . . . . . . . . . . . . . . . . . . . . . . . . . . . . . . . . . . . . . . . . . . . . 8<br />
Install Battery . . . . . . . . . . . . . . . . . . . . . . . . . . . . . . . . . . . . . . . . . . . . 8<br />
Operating Instructions . . . . . . . . . . . . . . . . . . . . . . . . . . . . . . . . . . . . . . 8 – 21<br />
Getting Started . . . . . . . . . . . . . . . . . . . . . . . . . . . . . . . . . . . . . . . . . 8 – 9<br />
Measuring Air Speed <strong>and</strong> Temperature . . . . . . . . . . . . . . . . . . . . . . . . 9<br />
Measuring Airflow Volume . . . . . . . . . . . . . . . . . . . . . . . . . . . . . . . . . . 9<br />
Measuring Surface Temperature . . . . . . . . . . . . . . . . . . . . . . . . . . . . . 10<br />
Holding <strong>and</strong> Storing Measurements . . . . . . . . . . . . . . . . . . . . . . . . . . 10<br />
Displaying Maximum, Minimum <strong>and</strong> Average Values . . . . . . . . 10 – 11<br />
Recalling <strong>and</strong> Erasing Stored Measurements . . . . . . . . . . . . . . 11 – 12<br />
Using the Advanced Settings Menu . . . . . . . . . . . . . . . . . . . . . . 12 – 13<br />
Data Logging <strong>with</strong> a Computer . . . . . . . . . . . . . . . . . . . . . . . . . . 14 – 21<br />
Install Software <strong>and</strong> Drivers . . . . . . . . . . . . . . . . . . . . . . . . . 14 – 15<br />
Connecting the Meter to Your Computer . . . . . . . . . . . . . . . . . . . 15<br />
Viewing Real-Time Measurements on the Dashboard . . . . . 15 – 17<br />
Using the Meter to Log Data . . . . . . . . . . . . . . . . . . . . . . . . . 17 – 18<br />
Uploading Record Data . . . . . . . . . . . . . . . . . . . . . . . . . . . . . . . . . 18<br />
Viewing Record Data Graphically . . . . . . . . . . . . . . . . . . . . . 19 – 20<br />
Uploading <strong>and</strong> Viewing Data Logs . . . . . . . . . . . . . . . . . . . . 20 – 21<br />
Specifications . . . . . . . . . . . . . . . . . . . . . . . . . . . . . . . . . . . . . . . . . . . . . . . . 22<br />
Maintenance Tips . . . . . . . . . . . . . . . . . . . . . . . . . . . . . . . . . . . . . . . . . . . . . 23<br />
Warranty Information . . . . . . . . . . . . . . . . . . . . . . . . . . . . . . . . . . . . . . . . . . 23<br />
Return for Repair Policy . . . . . . . . . . . . . . . . . . . . . . . . . . . . . . . . . . . . . . . . 23<br />
Appendix . . . . . . . . . . . . . . . . . . . . . . . . . . . . . . . . . . . . . . . . . . . . . . 24 – 25
INTRODUCTION<br />
Thank you for purchasing General Tools & Instruments’ CIH20DL Data Logging Hot Wire<br />
Anemometer <strong>with</strong> <strong>CFM</strong>/<strong>CMM</strong> <strong>and</strong> 8:1 IR Thermometer. Please read this user’s manual<br />
carefully <strong>and</strong> thoroughly before using the instrument.<br />
The CIH20DL is a professional-grade, h<strong>and</strong>held hot wire anemometer that can not only<br />
measure the speed of air exiting the grille or register of an HVAC/R system or blower or fan,<br />
but also convert those readings to airflow volume measurements in units of <strong>CFM</strong> (cubic feet<br />
per minute or ft 3 /min) or <strong>CMM</strong> (cubic meters per minute or m 3 /min). The conversions are<br />
possible because the meter allows the user to enter the free area dimensions of grilles <strong>and</strong><br />
output ductwork.<br />
The instrument can also measure the temperature of cooling or heating air, as well as<br />
surface temperatures. Air temperatures from 32° to 158°F (0° to 70°C) are measured by a<br />
thermistor located next to the hot wire sensor at the end of a 6 ft. (1.8m) long telescoping<br />
metal probe <strong>and</strong> cable. Surface temperatures from -25° to 999°F (-32° to 538°C) are<br />
measured by an integral infrared (IR) thermometer <strong>with</strong> a distance-to-spot (D:S) ratio of 8:1.<br />
A hot wire anemometer measures air speed in the following way. When the instrument is<br />
powered on, direct current is passed through its hot wire sensor for about 15 seconds. After<br />
the sensor has been warmed to a constant temperature, the instrument detects how much<br />
current is required to maintain that temperature as wind passing across the sensor acts to<br />
cool it. The amount of current required is directly proportional to the square of the wind<br />
speed.<br />
Hot wire anemometers are as accurate as vane anemometers, but hot wire units are better<br />
able to measure very slow air currents because they have no moving parts <strong>and</strong> therefore<br />
no inertia. For example, the CIH20DL can measure air speeds as low as 2 ft/min. A typical<br />
vane anemometer of comparable quality <strong>and</strong> accuracy cannot measure air speeds lower<br />
than 80 ft/min.<br />
The CIH20DL has a large backlit display <strong>with</strong> three readouts: one shows air speed or airflow<br />
volume, another is for IR temperature, <strong>and</strong> the third is dedicated to air temperature.<br />
Normally, each of these readouts shows real-time measurements, which can be held (frozen)<br />
<strong>and</strong> read later to enable work in dark areas. End users can opt to have the readouts show<br />
maximum, minimum or average measurements instead. End users also can store up to nine<br />
sets of the three readings (air speed or airflow volume, air temperature <strong>and</strong> IR temperature)<br />
in an internal nonvolatile memory <strong>and</strong> recall them at any time in chronological order.<br />
In addition to storing the nine sets of readings, the CIH20DL also can capture—over long<br />
periods of time—<strong>and</strong> time-stamp up to 20,000 air speed/airflow volume, air temperature<br />
<strong>and</strong> surface temperature measurements at a user-selected sampling rate from 5 seconds<br />
to 1 hour. These time-stamped readings, called data logs, can be copied to a PC running<br />
Windows ® 7, Windows ® Vista or Windows ® XP via an included USB cable. Once in the<br />
computer, the logs can be displayed as graphs or tables, formats that make it easy to spot<br />
trends or unexpected excursions in readings.<br />
Windows ® 7, Windows ® Vista <strong>and</strong> Windows ® XP are registered trademarks of Microsoft Corporation.<br />
3
The CIH20DL can be configured to display air speed in any of five Imperial or metric units,<br />
airflow volume in <strong>CFM</strong> or <strong>CMM</strong>, <strong>and</strong> temperature in degrees Fahrenheit or Celsius. The<br />
instrument’s IR thermometer, which can be precisely aimed by a low-power laser pointer,<br />
assumes by default that its target has an emissivity of 0.95, which is true for 90% of<br />
applications.<br />
The meter is normally powered by one “9V” battery (included). To enable long-term data<br />
logging, the meter also can be powered by a 110V or 220V AC supply. When the meter is<br />
powered by the battery, it automatically shuts off after 10 minutes of inactivity to extend<br />
battery life. When running on AC power, the auto power off period is extended to 30 minutes<br />
when the meter is not in data logging mode. When the meter is running on AC power in data<br />
logging mode, the auto power off function is disabled to enable logging sessions longer than<br />
30 minutes. When the meter is connected to a computer via the included USB cable, the<br />
meter is powered through the computer's USB port. In this mode, the Auto Power Off<br />
function is disabled. This prevents unexpected meter shutoffs from interrupting data uploads.<br />
KEY FEATURES<br />
• Measures <strong>and</strong> displays air speed or airflow volume in several Imperial or metric units<br />
• Simultaneously measures <strong>and</strong> displays ambient temperature from 32° to 158°F<br />
(0° to 70°C) in °F or °C <strong>with</strong> ±2% accuracy<br />
• Measures air speeds from 2 ft/min to 7874 ft/min (20 mm/sec to 40 m/sec) <strong>with</strong><br />
±3% accuracy<br />
• Measures airflow volumes from 0 to 2.5 million <strong>CFM</strong> (0 to 72,000 <strong>CMM</strong>) <strong>with</strong><br />
±3% accuracy<br />
• Displays maximum, minimum or maximum air speed plus temperature<br />
• Also has 8:1 infrared thermometer for remote, non-contact measurement of surface<br />
temperatures from -25° to 999°F (-32° to 538°C) <strong>with</strong> ±3% accuracy<br />
• Telescoping probe <strong>and</strong> cable extend reach of hot wire sensor <strong>and</strong> thermistor to up to<br />
6 ft. (1.8m)<br />
• Jumbo backlit LCD <strong>with</strong> three readouts<br />
• Stores/recalls up to nine sets of three readings in nonvolatile memory<br />
• Time-stamps <strong>and</strong> saves up to 20,000 data points at user-selected sampling rate from<br />
5 seconds to 1 hour<br />
• Included USB cable <strong>and</strong> interface/data logging software enable transfer of stored data<br />
logs from the meter’s internal memory to a PC for tabular or graphic display <strong>and</strong><br />
analysis<br />
• Data hold <strong>and</strong> auto power off functions<br />
• CE <strong>and</strong> RoHS approved<br />
4
SAFETY INSTRUCTIONS<br />
CAUTION!<br />
The CIH20DL’s targeting laser is a Class II type that emits less than 1mW of power between<br />
630nm <strong>and</strong> 660nm. Avoid direct eye contact <strong>with</strong> laser light radiation. U.S. law prohibits<br />
pointing a laser beam at aircraft; doing so is punishable by a fine of up to $10,000 <strong>and</strong><br />
imprisonment.<br />
WHAT’S IN THE CASE<br />
The CIH20DL <strong>and</strong> its accessories come in a custom molded plastic case. The instrument<br />
itself has two main components: a h<strong>and</strong>held meter <strong>with</strong> a digital display, <strong>and</strong> a telescoping<br />
metal probe <strong>with</strong> two sensors at one end <strong>and</strong> a plug for connecting the probe to the meter<br />
at the other. Also in the case are the following accessories:<br />
• A USB cable for connecting the meter to a Windows computer, enabling the meter to<br />
upload captured air speed, airflow volume <strong>and</strong> surface temperature data. This cable<br />
has a mini B-type plug at one end <strong>and</strong> an A-type plug at the other.<br />
• An AC adapter <strong>and</strong> power cable for connecting the meter to a 110V or 220VAC supply<br />
to enable long-term data logging. This cable has a mini B-type plug at one end <strong>and</strong> a<br />
socket <strong>with</strong> a spring-loaded latch at the other. The latch makes it easy to attach <strong>and</strong><br />
detach either of two kinds of plugs: one <strong>with</strong> American-style blades <strong>and</strong> the other<br />
<strong>with</strong> European-style round prongs. One plug of each type is included in the case.<br />
• A “9V” Alkaline battery.<br />
• A plastic bag containing: 1) a CD <strong>with</strong> Windows-compatible software <strong>and</strong> drivers for<br />
using the CIH20DL <strong>with</strong> a PC running Windows7 (32- or 64-bit), Windows Vista or<br />
Windows XP; 2) a Certificate of Traceable Calibration; <strong>and</strong> 3) this user’s manual.<br />
PRODUCT OVERVIEW<br />
Fig. 1 shows the labels <strong>and</strong> positions of the controls <strong>and</strong> connectors on the front <strong>and</strong><br />
top of the CIH20DL. Fig. 2 shows all possible indications on the LCD. Familiarize yourself <strong>with</strong><br />
the controls’ functions <strong>and</strong> the meanings of the display indications before moving on to the<br />
Setup Instructions.<br />
1. (Power) button<br />
2. LCD <strong>with</strong> three readouts<br />
3. IR (Record) Temp button: When pressed briefly, stores values shown on all three readouts in<br />
one of nine nonvolatile memory locations, <strong>and</strong> then advances the location counter by one.<br />
When pressed <strong>and</strong> held for 3+ seconds, begins logging measurement data (air speed or<br />
airflow volume, air temperature <strong>and</strong> IR temperature) at preset sampling time. Logs are<br />
stored in the meter’s internal memory space (as opposed to in nonvolatile memory). Also<br />
used to change fields when setting sampling time, date or time <strong>and</strong> to clear the meter’s<br />
internal data logging memory space.<br />
5
IR Temp 4. button: Activates laser pointer when<br />
enabled (unless readouts are displaying<br />
IR Temp<br />
recalled values)<br />
5. button<br />
6. (Anemometer HOLD) button:<br />
Freezes air speed <strong>and</strong> airflow volume<br />
readings only<br />
7. AC power/USB cable jack (on left side)<br />
IR8.<br />
Temp A two-function button: Laser<br />
pointer enable/disable <strong>and</strong> backlight<br />
on/off. Pressing button four times cycles<br />
through the four possible combinations<br />
of states (see figure below). After the<br />
backlight is activated, it stays on for 15<br />
seconds <strong>and</strong> then automatically shuts<br />
off.<br />
9. MODE SET button: When pressed briefly <strong>and</strong> repeatedly, cycles readouts to show: realtime<br />
measurements; maximum, minimum <strong>and</strong> average readings; <strong>and</strong> recalled stored<br />
measurements.<br />
When pressed <strong>and</strong> held for 3+ seconds (unless readouts are displaying recalled values),<br />
places meter in advanced setup mode. In this mode, the user can change default<br />
measurement units, enter a grille area, set the data logging sampling time <strong>and</strong> the current<br />
date <strong>and</strong> time, <strong>and</strong> clear the meter’s data logging memory space.<br />
10. button<br />
11. Hot wire probe socket<br />
12. IR measuring window<br />
13. Laser pointer port<br />
14. Hot wire probe head<br />
15. Hot wire probe plug<br />
6<br />
Fig. 1. The CIH20DL’s controls <strong>and</strong><br />
connectors<br />
TOP
Fig. 2. All possible display indications<br />
A Clock, backlight on <strong>and</strong> laser pointer enabled icons<br />
B Secondary readout<br />
C Memory Space/CLR (clear) <strong>and</strong> Memory indications<br />
D X10 <strong>and</strong> X100 indications<br />
E Primary readout<br />
F MAX, MIN <strong>and</strong> AVG display indications<br />
G <strong>DATA</strong> [#] RECALL <strong>and</strong> <strong>DATA</strong> LOG indications<br />
H [PC] LINK indication<br />
I IR Temp [IR Temperature] HOLD indication<br />
J Battery charge indicator<br />
K IR Temp temperature measurement unit (°C or °F)<br />
L Time <strong>and</strong> date field indications<br />
M [Anemometer] HOLD indication<br />
N Air speed <strong>and</strong> airflow volume measurement units<br />
O Tertiary readout<br />
7
SETUP INSTRUCTIONS<br />
INSTALL BATTERY<br />
The meter’s battery compartment is accessible<br />
from the back of the unit (Fig. 3).<br />
Before installing the 9V battery included in the<br />
carrying case, remove the plastic covering its<br />
terminals. Open the battery compartment by<br />
pushing the tab at the bottom of its cover forward<br />
(Fig. 3, Step 1). Lift the cover <strong>and</strong> set it aside<br />
(Step 2). Then plug the battery into the wired<br />
socket inside the compartment. The terminals of Fig. 3. The back of the CIH20DL<br />
the battery <strong>and</strong> the socket mate in only one way,<br />
<strong>with</strong> the smaller male terminal plugging into the<br />
larger female terminal. Replace the battery compartment cover <strong>and</strong> push down on its bottom<br />
until it snaps shut.<br />
The CIH20DL also can be powered by connecting it to an AC outlet or a computer's USB port.<br />
There is no reason to do so unless you plan to use the meter for extended data logging<br />
sessions. Connecting the meter to an external power supply does not charge the included<br />
“9V” Alkaline battery, which is not rechargeable.<br />
See “Data Logging <strong>with</strong> a Computer”, beginning on p. 14, for ways to connect the CIH20DL<br />
to an external power source.<br />
OPERATING INSTRUCTIONS<br />
GETTING STARTED<br />
To prepare the CIH20DL for use, line up the hot wire<br />
probe plug (Fig. 1, Callout 15) <strong>with</strong> the hot wire probe<br />
socket on the top of the meter (Callout 11) so the<br />
black arrow on the probe connector faces the back of<br />
the meter. Then insert the probe plug into the socket.<br />
Before extending the telescoping probe, extract<br />
the probe head (Callout 14) from the probe body<br />
by grasping the round black plastic end piece<br />
(Fig. 4 left, top callout) <strong>with</strong> two fingers <strong>and</strong> pulling<br />
slowly. Take care not to touch either the hot wire air<br />
speed sensor or the air temperature sensor <strong>with</strong>in<br />
the head; both are extremely delicate. Pull out the<br />
probe head to expose 1 inch of probe body. Exposing<br />
the probe head now will allow you to telescope the<br />
probe to any length later by grasping its body rather than its delicate head.<br />
Following each measurement session, carefully push the probe head back into the probe<br />
body (Fig. 4, right) in order to protect the sensors.<br />
8<br />
Ready For Use Not in Use<br />
Black plastic<br />
end piece<br />
Hot wire air<br />
speed sensor<br />
Air temperature<br />
sensor<br />
Fig. 4. The probe head assembly
To power on the meter, press the button. The display will initially show the clock icon at<br />
upper left <strong>and</strong> numbers on the primary readout counting down from 15. The numbers track<br />
the time needed to heat the hot wire to prepare it for use. After 15 seconds, the meter will<br />
be ready for use. It will automatically enter “normal” (air speed or airflow volume +<br />
temperature) measurement mode <strong>and</strong> display a screen similar to Fig. 5. By default, the<br />
primary (middle) readout shows real-time air speed in ft/min <strong>and</strong> the tertiary (lower) readout<br />
shows real-time air temperature in degrees Fahrenheit. The secondary (upper) display also<br />
uses °F as its default unit.<br />
To change the default air speed or temperature unit, skip<br />
ahead to “Using the Advanced Settings Menu,” beginning on p. 12.<br />
MEASURING AIR SPEED AND TEMPERATURE<br />
To measure the speed <strong>and</strong> temperature of a blower’s<br />
or HVAC system’s output, fully extend the telescoping hot wire<br />
ft/min<br />
probe <strong>and</strong> position the head of the probe in the airstream leaving<br />
the system’s duct or register. Be sure the black arrow on the round<br />
<strong>DATA</strong><br />
black plastic end piece points in, or opposite to, the direction of air<br />
F<br />
flow (see Fig. 6). The primary (middle) readout will show the air<br />
speed in ft/min <strong>and</strong> the tertiary (bottom) readout will show the Fig. 5. The initial display<br />
temperature of the airstream in °F.<br />
after powering on<br />
When making air speed or airflow volume measurements, it’s<br />
important to make sure the air flows directly through the larger window in the probe<br />
head containing the hot wire. If some of the airflow goes around the cavity, the hot wire<br />
will not be cooled to the maximum extent, <strong>and</strong> air speed <strong>and</strong> airflow volume measurements<br />
will consequently be low. To ensure that the hot wire is perpendicular to the airflow, slowly<br />
twirl the probe while watching the primary (middle) readout. When the highest values are<br />
seen, the hot wire is fully perpendicular to the flow of air.<br />
MEASURING AIRFLOW VOLUME<br />
To prepare to measure the amount of air exiting a duct,<br />
grille or register, first measure its area. Then skip ahead to<br />
“Using the Advanced Settings Menu” beginning on p. 12.<br />
Following the instructions in Fig. 8, use the MODE SET button<br />
<strong>and</strong> the <strong>and</strong> buttons to 1) place the meter in airflow<br />
volume measurement mode <strong>and</strong> 2) enter the area of the duct,<br />
grille or register.<br />
Once you have measured <strong>and</strong> entered the area, fully extend the<br />
telescoping hot wire probe <strong>and</strong> position the head of the probe<br />
in the airstream. Make sure the hot wire window is<br />
perpendicular to the airstream, as when measuring air speed.<br />
The primary (middle) readout will show the airflow volume<br />
in the default unit of <strong>CFM</strong> (cubic feet/minute) <strong>and</strong> the tertiary<br />
(bottom) readout will show the temperature of the airstream in °F.<br />
Fig. 6. How to orient the<br />
hot wire probe<br />
F<br />
9
Temp<br />
MEASURING SURFACE TEMPERATURE<br />
To use the meter’s IR thermometer to measure the surface temperature of an object<br />
from a distance, make sure the meter is in “normal” measurement mode, <strong>with</strong> the<br />
primary (middle) readout tracking air speed or airflow volume <strong>and</strong> the tertiary (lower)<br />
readout tracking air temperature. Then make sure the laser pointer is enabled (indicated by<br />
the icon at the top of the display). It may be necessary to press the IR Temp button once or<br />
twice to enable the pointer.<br />
With the laser pointer enabled, point the top of the meter at an object or surface <strong>and</strong> press<br />
IR Temp the button. The IR thermometer will measure the surface temperature <strong>and</strong> show it on the<br />
secondary (upper) readout. Note that releasing the IR Temp button turns off the laser pointer <strong>and</strong><br />
causes the measurement to be held (indicated by the return of the HOLD icon above the<br />
IR Temp<br />
measurement). All IR temperature measurements are automatically held on-screen until the<br />
IR Temp<br />
button is pressed again or the meter is powered off—whichever comes first.<br />
To improve your surface temperature measurements, learn to determine how close to the<br />
target the CIH20DL must be so the area whose temperature you wish to measure is <strong>with</strong>in<br />
the spot area of the meter’s IR thermometer. Refer to the Appendix, which begins on p. 24,<br />
for the theory <strong>and</strong> practice of making accurate IR measurements.<br />
IR Temp<br />
IR Temp<br />
HOLDING AND STORING MEASUREMENTS<br />
To hold any pair of measurements (air speed + temperature or airflow + temperature) made<br />
by the sensors in the probe head, press the button. This will freeze the value shown on<br />
IR Temp<br />
the primary readout <strong>and</strong> cause the HOLD icon to appear above it. Held measurements<br />
are erased when the meter is powered off<br />
To release the hold, press the button again.<br />
The CIH20DL contains enough nonvolatile memory to store nine sets of three readings (air<br />
speed or airflow volume, air temperature <strong>and</strong> surface temperature. To store a set of three<br />
measurements, first make sure the meter is in “normal” measurement mode or<br />
measurement hold mode. Then note the number to the right of the word <strong>DATA</strong> at the lower<br />
left of the display <strong>and</strong> briefly press the IR button. Temp Doing so will store the values shown by all<br />
three readouts in the indicated memory location <strong>and</strong> then advance the location counter by<br />
one. The new number (<strong>DATA</strong> X +1) is the memory location that will be used the next time the<br />
IR button Temp is pressed.<br />
While the readings are being stored, the meter will continue to operate in normal<br />
measurement mode. In contrast to held readings, readings stored in nonvolatile memory are<br />
not erased when the meter powers off. However, a reading will be overwritten if its memory<br />
location is next in the queue when the IR button Temp is pressed.<br />
DISPLAYING MAXIMUM, MINIMUM AND AVERAGE VALUES<br />
The MODE SET button is the gateway to two multi-option menus. The menu that opens<br />
depends on how long you press the button. Pressing the MODE SET button briefly lets you<br />
choose to display values other than real-time measurements on the three readouts. Pressing<br />
<strong>and</strong> holding the button opens up the Advanced Settings Menu, which is detailed in the next<br />
section, beginning on p. 12.<br />
10
Fig. 7 is a flowchart of the menu made available by briefly pressing the MODE SET button.<br />
Starting from normal measurement mode, one press of the button makes all three readouts<br />
show the maximum values of the three main parameters measured since the meter was<br />
powered up. The term MAX appears at the lower left of the display to indicate what the<br />
readings represent.<br />
MODE<br />
SET<br />
Normal Measuring Mode<br />
Three readouts show maximum<br />
values since power on<br />
Three readouts show minimum<br />
values since power on<br />
Three readouts show average<br />
values since power on<br />
Three readouts show the<br />
parameters stored together at<br />
the same in nonvolatile memory<br />
Fig. 7. The menu made available by briefly<br />
pressing the MODE SET button<br />
Pressing the MODE SET button again switches the readouts to show the minimum (MIN)<br />
values of the three parameters measured since the meter was last powered on. Pressing the<br />
button a third time switches the readouts to show the average (AVG) values of the three<br />
parameters.<br />
RECALLING AND ERASING STORED READINGS<br />
Pressing the MODE SET button a fourth time begins retrieval <strong>and</strong> display of the<br />
measurements stored in nonvolatile memory. The first set of three values retrieved are the<br />
three measurements most recently stored. Their memory location is indicated by the word<br />
<strong>DATA</strong> <strong>and</strong> a number from 1 to 9 at the lower left of the display. The word RECALL appears at<br />
the right of the number to indicate that the three readouts are showing stored values.<br />
11
To retrieve other triple sets of measurements in either order (newest to oldest, or oldest to<br />
newest), use the <strong>and</strong> buttons, respectively. For example, if the first set of values<br />
retrieved (the most recently stored) is tagged <strong>DATA</strong>2, pressing the button would retrieve<br />
the values stored in memory location <strong>DATA</strong>1. These represent the next oldest measurements,<br />
compared to <strong>DATA</strong>2. To continue retrieving data using a reverse timeline (newest to oldest),<br />
continue to press the button.<br />
To retrieve measurement data using a forward timeline (oldest to newest), use the button.<br />
Whichever timeline you choose, when you reach memory location <strong>DATA</strong>0 (either by moving<br />
up from <strong>DATA</strong>9 or down from <strong>DATA</strong>1) the display will change radically. <strong>DATA</strong>0 RECALL will<br />
appear on the bottom line <strong>and</strong> all three readouts will show dashes instead of measurement<br />
values <strong>and</strong> units. That’s because <strong>DATA</strong>0 is a non-storing memory location. In addition, the<br />
letters CL <strong>and</strong> CLE will be superimposed on the dashes of the secondary <strong>and</strong> primary<br />
readouts. Also, the words “Memory Space CLR-Memory” will appear in the space between<br />
CL <strong>and</strong> CLE.<br />
This unique display gives you the opportunity to bulk-erase the meter’s nonvolatile memory.<br />
To do so, press the IR button. Temp This will cause the entire primary readout (the letters CLE<br />
superimposed on dashes) to flash continuously, indicating that all stored measurements have<br />
been erased. To confirm the erasure, repeatedly press either the or button <strong>and</strong> note<br />
that all <strong>DATA</strong> [X] RECALL displays now show three readouts <strong>with</strong> dashes rather than<br />
measurement values.<br />
To return the meter to normal measurement mode after bulk-erasing the nonvolatile<br />
memory, press the MODE SET button.<br />
USING THE ADVANCED SETTINGS MENU<br />
Pressing <strong>and</strong> holding the MODE SET button for 3+ seconds opens up the meter’s second<br />
multi-option menu, the Advanced Settings Menu. Figure 8 is a flowchart of the options made<br />
available from this menu by subsequent brief presses of the MODE SET button. Once you<br />
have entered the Advanced Settings Menu (indicated by the word SET on the bottom line of<br />
the display), moving to the next box down the flowchart requires only a brief press of the<br />
MODE SET button. Pressing <strong>and</strong> holding the MODE SET button exits the Advanced Settings<br />
Menu <strong>and</strong> returns the meter to operating in normal measurement mode.<br />
Unlike the first virtual menu accessible from the MODE SET button, the Advanced Settings<br />
Menu gives you only six seconds to choose an option at each decision box moving down the<br />
flowchart. If no button is pushed <strong>with</strong>in six seconds, the menu closes <strong>and</strong> the meter resumes<br />
operating in normal measurement mode. Once you gain experience using the meter, you will<br />
find that six seconds is sufficient to exercise any option presented by the menu.<br />
12
Fig. 8. The Advanced Settings Menu<br />
Normal Measuring<br />
mode<br />
Air Speed or Airflow<br />
Volume mode<br />
Air speed unit<br />
Airflow<br />
volume unit<br />
Temperature unit<br />
Enter area of<br />
grille or register<br />
Sampling time of<br />
data log<br />
Clear data<br />
logging memory<br />
Set current date<br />
Set current time<br />
MODE<br />
SET<br />
Press <strong>and</strong> hold the MODE SET button for 3+ seconds to enter/exit<br />
menu from/to normal measuring mode.<br />
Press the or button to select <strong>CMM</strong>, <strong>CFM</strong> (for Airflow Volume<br />
mode) or m/s, ft/min, km/h, mile/h, knots (for Air Speed mode).<br />
When your choice flashes, press the MODE SET button to store it.<br />
Press the or button to select m/s, ft/min, km/h, mile/h or knots.<br />
When your choice flashes, press the MODE SET button to store it.<br />
Press the or button to select <strong>CMM</strong> or <strong>CFM</strong>. When your choice<br />
flashes, press the MODE SET button to store it.<br />
Press the or button to select °F or °C. When your choice<br />
flashes, press the MODE SET button to store it.<br />
Press (<strong>and</strong> hold, if convenient) the or button to adjust the value<br />
on the primary readout to the measured area. The area can be<br />
adjusted from 0.01 to 322.92 ft 2 in increments of 0.01 ft 2 , or from<br />
0.001 to 30m 2 in increments of 0.001 m 2 . After entering the correct<br />
area, press the MODE SET button to store it.<br />
Use the button to toggle between the minutes <strong>and</strong> seconds fields of<br />
IR Temp<br />
the time shown on the secondary readout. Use the <strong>and</strong> buttons<br />
(holding them, if convenient) to adjust the flashing value <strong>with</strong>in each<br />
field. The sampling time can be set to any value between 5 seconds<br />
(00:00:05) <strong>and</strong> 59 minutes, 59 seconds (00:59:59). After entering the<br />
desired sampling time, press the MODE SET button to store it.<br />
Press the button to clear the meter’s internal data logging memory.<br />
IR Temp<br />
Doing so resets the five-digit Memory Space counter <strong>and</strong> causes it<br />
<strong>and</strong> the text CLR-Memory above it to flash, confirming the erasure.<br />
After six seconds, the meter will automatically exit the Advanced<br />
Settings Menu <strong>and</strong> enter normal measuring mode.<br />
Use the button to toggle between the year, month <strong>and</strong> day fields of<br />
IR Temp<br />
the date shown on the secondary readout. Use the <strong>and</strong> buttons<br />
(holding them, if convenient) to adjust the flashing value <strong>with</strong>in each<br />
field. After entering the current date, press the MODE SET button to<br />
store it.<br />
Use the button to toggle between the hours, minutes <strong>and</strong> seconds<br />
IR Temp<br />
fields of the time shown on the secondary readout. Use the <strong>and</strong> <br />
buttons (holding them, if convenient) to adjust the flashing value<br />
<strong>with</strong>in each field. Remember to use the 24-hour format when setting<br />
the hour. After entering the current time, press the MODE SET button<br />
to store it.<br />
13
<strong>DATA</strong> <strong>LOGGING</strong> WITH A COMPUTER<br />
In addition to making <strong>and</strong> displaying real-time air speed, airflow volume <strong>and</strong> temperature<br />
measurements <strong>and</strong> storing up to nine sets of these readings in nonvolatile memory, the<br />
CIH20DL also can make <strong>and</strong> time-stamp up to 20,000 measurements over extended periods<br />
of time at user-selected sampling rates. These measurements, called data logs, are stored<br />
in a separate internal memory. They can be uploaded to a PC using the USB cable <strong>and</strong><br />
interface/driver/data logging software provided <strong>with</strong> the instrument.<br />
After uploading, the data logs can be analyzed for trends <strong>and</strong> anomalies using the software’s<br />
presentation options. Examples include graphical <strong>and</strong> tabular displays of data that make it<br />
easy to spot excursions of air temperature or gradual decreases in airflow volume over time.<br />
Install Software <strong>and</strong> Drivers<br />
1. Place the installation disc, shiny side<br />
down, in your computer’s CD/DVD<br />
drive <strong>and</strong> close the drawer.<br />
2. Double-click the icon "Run setup.exe",<br />
or the icon representing the disc to<br />
initiate AutoPlay. The screen shown in<br />
Fig. 9 will appear.<br />
3. Click Next to install the anemometer's<br />
application program (Anemometer AP,<br />
Version 3) in your C:\Program Files<br />
(x86) folder in a new subfolder named<br />
. (If you want to install the<br />
software elsewhere, click Browse <strong>and</strong><br />
choose another location.) Doing so will Fig. 9. The initial software installation<br />
also install software for other National screen<br />
Instruments products in another new Program Files subfolder named .<br />
4. On the next dialog box (the National Instruments Software License Agreement),<br />
click the circle to the left of “I accept the License Agreement” <strong>and</strong> then click Next.<br />
5. On the next dialog box (the License Agreement), again left-click the circle to the left<br />
of “I accept the License Agreement” <strong>and</strong> then left-click Next.<br />
6. On the next dialog box (Start Installation), click Next. On some computers, the two<br />
software installations may take as long as 20 minutes.<br />
7. When the next dialog box (Installation Complete) notifies you that “The installer has<br />
finished updating your system,” click Next.<br />
8. The next dialog box prepares for installation of the PL-2303 USB-to-Serial driver on<br />
your computer. Click Next to continue.<br />
9. When the next dialog box (InstallShield Wizard Complete) appears, click Finish.<br />
14
10. You may or may not be prompted now to restart your computer to complete<br />
installation of the Anemometer Application. If you are prompted to do so, click<br />
Restart.<br />
Whether or not you restart, note that an Anemometer Application icon has been<br />
added to your desktop, start button, or both locations. To facilitate access to the<br />
program, right-click on whichever icon has been added <strong>and</strong> pin it to both locations<br />
<strong>and</strong> your taskbar. You can now eject the installation disc <strong>and</strong> store it <strong>with</strong> your other<br />
important software.<br />
Connecting the Meter to Your Computer<br />
Before using the CIH20DL to log data, familiarize yourself <strong>with</strong> how the meter <strong>and</strong> the<br />
software you have just installed work together.<br />
To begin, connect the meter to your computer by plugging the mini B-type plug of the<br />
included USB cable into the jack on the left side of the meter (Fig. 1, Callout 7). Next, insert<br />
the A-type plug at the other end of the cable into an open USB port of your computer. Power<br />
on the meter <strong>and</strong> wait 15 seconds for the hot wire sensor to heat up to operating<br />
temperature.<br />
The first time you connect the meter to your computer, the system tray at lower right will<br />
pop-up two notifications: 1) “Installing Device Driver Software”, followed by “Prolific USB-to-<br />
Serial COMM Port ((COM[X])) Device Driver Software Installed Successfully”. Depending on<br />
which Windows OS you are running <strong>and</strong> which USB port you have chosen, the “X” in<br />
“(COMX)” may be any number from 1 to 9. Write down the number shown in the<br />
notification. Knowing the number will speed up each subsequent connection of the meter<br />
to your computer—as long as you use the same USB port each time.<br />
The interface/data logging software is now ready to be used <strong>with</strong> the CIH20DL.<br />
Viewing Real-Time Measurements<br />
on the Dashboard<br />
The software installations should have added an<br />
“Anemometer AP” or “Anemometer Application” icon<br />
to your Start button <strong>and</strong>/or desktop, <strong>and</strong>/or an “IR-A"<br />
icon to the Quick Start (left) section of the taskbar at<br />
the bottom of your computer screen.<br />
Open the Anemometer AP program via the icon on the<br />
Start button, desktop or Taskbar. Two overlaid screens<br />
will appear (see Fig. 10).<br />
The larger, bottom screen is called a dashhboard <strong>and</strong><br />
it serves the same purpose as the dashboard of a<br />
vehicle: displaying all important measurements in one<br />
place. The smaller, top screen will show a pulldown<br />
menu of COM port selections at right, <strong>with</strong> a default<br />
COM port selection of COM4.<br />
Fig. 10. The startup Anemometer<br />
Application screen<br />
15
Fig. 11. the Anemometer<br />
Application's dashboard<br />
To access the dashboard, you must use this pulldown to select the number of the COM port<br />
you are using to connect the meter. This is the number you were advised to write down<br />
earlier. If you have forgotten it, you can still identify the “correct” port by trial <strong>and</strong> error.<br />
Selecting the correct COM port will illuminate the green STATUS light on the small overlaid<br />
screen <strong>and</strong> make the CONNECT virtual button available to press. You may need to refresh the<br />
COM Port window until the number of the COM port into which you plugged the USB cable<br />
appears.<br />
Once the STATUS light on the smaller screen illuminates, click on CONNECT. A successful<br />
connection will cause the smaller screen to disappear, enabling the dashboard (Fig. 11) to<br />
appear in full <strong>and</strong> begin mirroring real-time readings on the meter’s LCD. The connection will<br />
also cause the word LINK to appear on the bottom line of the meter’s LCD.<br />
16<br />
WARNING!<br />
If your computer is running the 64-bit version of Windows7, NEVER disconnect the<br />
CIH20DL from the computer (by unplugging either end of the USB cable) <strong>with</strong>out<br />
first closing the Anemometer AP (IR-A) application. Disconnecting the meter while<br />
the application is running will cause your computer to crash (shut down hard, <strong>with</strong><br />
the same consequences as losing power or pressing <strong>and</strong> holding the POWER<br />
button) every time. When your computer crashes, all open applications will close<br />
immediately <strong>and</strong> all of your unsaved work will be lost.<br />
If you do not know which version of Windows7 you are running, right-click the<br />
“My Computer” icon on your desktop or double-click “Computer” in Windows<br />
Explorer. In the “System” section, the “System type” line will indicate whether you<br />
are running the 32-bit or 64-bit version of Windows7.
On the dashboard, the default units are °F for temperature <strong>and</strong> m/s for air speed. To change<br />
the air speed unit, left-click the red box containing m/s <strong>and</strong> select one of the four other units<br />
as the default. To switch to °F as the IR <strong>and</strong> air temperature unit, click on °F in the red box.<br />
These defaults must be reset each time you the open the program.<br />
Using the Meter to Log Data<br />
Before logging data, close the Anemometer AP program <strong>and</strong> disconnect the CIH20DL<br />
from your computer in that order (see Warning on p. 16). You should then use the<br />
Advanced Settings Menu (see p. 12 <strong>and</strong> following) to set the current time <strong>and</strong> date in the<br />
meter. Doing so will give the data you log an absolute temporal reference point, making it<br />
more credible <strong>and</strong> valuable. The Advanced Settings Menu also allows you to use air speed<br />
<strong>and</strong> temperature units other than the default m/s <strong>and</strong> °F, respectively.<br />
Finally—<strong>and</strong> most important—the Advanced Settings Menu enables you to determine the<br />
optimum value of sampling time for the purposes of your application. Using the shortest<br />
setting of 5 seconds may result in too much essentially identical data being stored in<br />
memory, potentially limiting its capacity to capture important events such as an unexpected<br />
excursion of temperature or humidity. Conversely, using the longest sampling time setting of<br />
59 minutes, 59 seconds will likely cause important events to go undetected.<br />
If you are an experienced data logger, you already know how to choose the optimum<br />
sampling time for your application. If you are a novice, pick a sampling time closer to the<br />
minimum than the maximum sampling time, on the assumption that the meter probably has<br />
enough memory (20,000 sets of readings) to store all the data you ask the meter to log—<br />
unless you use it to log data for months, rather than weeks or days.<br />
Because most data logging is done over a long period of time, General recommends that you<br />
change the meter’s power supply from its 9V battery to an external source of AC power<br />
before beginning a logging session. Running on AC power enables the meter to log data<br />
indefinitely, not just until the battery discharges.<br />
To switch to AC power, attach the correct type of plug for your locale (American-style<br />
blades or European-style round prongs) to the socket of the supplied power cable. The top of<br />
each plug has square corners. Push the lip on the plug’s top edge at an angle into the slot in<br />
the top of the socket’s cavity (marked by an arrow). Then push the bottom of the plug down<br />
<strong>and</strong> into the cavity until the spring-loaded latch secures it. Finally, insert the mini B-type plug<br />
end of the power cable into the USB jack on the side of the meter (Fig. 1, Callout 7) <strong>and</strong> plug<br />
the other end into an AC outlet.<br />
To begin logging data, extend <strong>and</strong> secure the probe as the application dictates <strong>and</strong> then<br />
press <strong>and</strong> hold the REC button for at least 3 seconds. This will cause the phrase <strong>DATA</strong> LOG<br />
to appear on the bottom of the meter’s LCD.<br />
To stop logging data, press <strong>and</strong> hold the REC button again. This will cause the <strong>DATA</strong> LOG<br />
indication to disappear. Once the meter exits Data Logging mode, it will automatically power<br />
off in 30 minutes (assuming you plugged it into an AC outlet for the logging session, as<br />
recommended earlier). Finally, disconnect the cable applying AC power from both the meter<br />
<strong>and</strong> the AC outlet. Using the instructions above as a guide, reconfigure the power cable as a<br />
USB cable by detaching the power plug from the socket at the cable’s mini-A plug end.<br />
17
Be aware that after you reconfigure the power cable as a USB cable <strong>and</strong> before you connect<br />
the meter to your computer, the meter will automatically resume drawing power from its<br />
internal battery. The switch will re-enable the Auto Power Off function, which will then<br />
automatically power the meter off if no buttons on it are pushed <strong>with</strong>in any 10-minute<br />
interval.<br />
When you connect the meter to your computer via the USB cable for the purpose of<br />
uploading data (the subject of the next section), the meter will begin drawing power from the<br />
computer’s USB port. The connection will disable the Auto Power Off function to prevent<br />
unexpected interruptions of data transfers between the meter <strong>and</strong> your computer.<br />
Uploading Record Data<br />
At any time after ending a data logging session, connect the meter to your computer by<br />
inserting the mini-B plug at one end of the cable into the jack on the side of the meter, <strong>and</strong><br />
the mini-A plug at the other end into an open USB port of your computer. Power on the meter<br />
<strong>and</strong> open the Anemometer AP program.<br />
Once the meter is connected to your computer, you can upload two different kinds of data to<br />
the PC. The first kind—“Record” data—comprises sets of three parameters (air velocity, air<br />
temperature <strong>and</strong> IR temperature) whose newest values represent real-time measurements<br />
<strong>and</strong> which stretch backward in time from the present. The data is “rolled over” (oldest values<br />
are overwritten to make room for newer values) continuously. Record data is analogous to<br />
video data that a digital video recorder (DVR) records continuously as long as it is powered<br />
on. On most consumer DVRs, you can retrieve video received at any time from the present<br />
until one hour ago (unless the channel is changed). On the CIH20DL, the length of the<br />
corresponding “reverse time” interval is a function of the default sampling time.<br />
To upload this Record data, click on the STOP UPLOAD virtual button under RECORD at the<br />
bottom of the dashboard (see Fig. 11). The button label will change to UPLOAD. Wait a<br />
minute or two, <strong>and</strong> then click on UPLOAD.<br />
You will then be prompted to choose a storage location for this .txt/.xlsx Data Record file. You<br />
can also rename the file now. To avoid confusing this file <strong>and</strong> other files, General suggests<br />
that you add the date as a suffix to the generic “Data Record” file name <strong>and</strong> store the file on<br />
your computer’s desktop. Once you have done so, click the OK button of the dialog box.<br />
Locate the file on your desktop, double-click on its icon, <strong>and</strong> open the file in Microsoft Excel,<br />
Microsoft Notepad or Microsoft WordPad. Depending on the version of Excel you are using,<br />
you may be prompted to verify the integrity of the file (by clicking Yes) prior to opening it.<br />
Note the tabular format of the data as well as the column headings <strong>and</strong> the time stamps (the<br />
third column in Notepad <strong>and</strong> WordPad, <strong>and</strong> Column C in Excel). As explained earlier, Record<br />
data comprises three sets of readings (IR Temperature, Air Velocity <strong>and</strong> Air Temperature) that<br />
are expressed in default units <strong>and</strong> displayed in chronological order starting at the time the<br />
meter was connected to your computer <strong>and</strong> ending at the present time. Also note from the<br />
table that Record data is captured as often as several times per second (some<br />
hour:minute:second time stamps have up to three entries, while others have none or one).<br />
18
Viewing Record Data Graphically<br />
You can also view Record data by using the<br />
dashboard’s integrated chart function. With the<br />
meter connected to your computer (indicated<br />
by a green light at the upper left of the<br />
dashboard <strong>and</strong> the word LINK on the bottom<br />
line of the meter’s LCD, click on the OPEN<br />
virtual button under CHART at the bottom of<br />
the dashboard. A screen similar to Fig. 12 will<br />
appear on your computer’s display. Note that<br />
only two parameters (air velocity <strong>and</strong> air<br />
temperature) are plotted because they are the<br />
only values that the meter captures<br />
automatically when powered on <strong>and</strong> operating<br />
unattended in Data Logging mode. The IR<br />
temperature data contained in the tables<br />
generated by uploaded .txt/.xlsx Data Record<br />
files are not plotted.<br />
The dashboard’s chart function is useful for<br />
quickly viewing trends in ambient air speed<br />
<strong>and</strong> temperature values captured by the probe<br />
since the meter was last powered on. Unlike<br />
Record data, the data in plots generated by the<br />
dashboard’s chart function are not—<strong>and</strong><br />
cannot be—given absolute date <strong>and</strong> time<br />
stamps.<br />
You can, however, make this plotted data<br />
easier to correlate <strong>with</strong> tables of uploaded<br />
Record data by changing the plots’ x-axis label<br />
via the dashboard. To do so, right-click on any<br />
of the three icons in the graph palette (below<br />
the m/s <strong>and</strong> °F buttons shown in Fig. 12).<br />
Using the pulldown menu, select Visible<br />
Items, <strong>and</strong> left-click Scale Legend to put a<br />
check mark to its left. You can also change the<br />
units of the air speed <strong>and</strong> temperature plots by<br />
clicking their red virtual buttons. As an<br />
example, compare Fig. 13 to Fig. 12. On Fig.<br />
13, the scale legend has been changed from<br />
Numbers to Sample No., <strong>and</strong> the unit of air<br />
speed measurement has been changed from<br />
m/s to ft/min.<br />
Fig. 12. The initial CHART display,<br />
activated from the dashboard<br />
13. A modified CHART display<br />
19
Other selections in the pulldown menus that appear when you right-click on any of the three<br />
icons of the graph palette can be used to:<br />
• Make other chart items visible<br />
• Auto-scale plots along their X <strong>and</strong> Y axes<br />
• Export images<br />
• Copy data<br />
• Change the way that plots are updated<br />
• Add descriptions <strong>and</strong> tips to charts<br />
It is also possible to left-click on two of the three icons of the graph palette. Doing so enables<br />
you to manipulate Record data plots using two powerful techniques: zooming <strong>and</strong> panning:<br />
• If you left-click on the center icon of the graph palette—the Zoom button—six<br />
display options will appear for selection. Clicking on the icon in the middle of the<br />
bottom row turns the left button of your computer’s mouse, touch pad or trackball<br />
into a “zoom lens” through which you can greatly increase the resolution of the data<br />
in plots of air velocity <strong>and</strong> air temperature vs. time.<br />
• Left-clicking on the right icon of the graph palette turns your mouse, touch pad or<br />
trackball into a panning control. Doing so changes the icon of your cursor into a h<strong>and</strong>.<br />
When placed <strong>with</strong>in a plot area, moving the h<strong>and</strong> left or right shifts the time axis<br />
forward or backward.<br />
The remaining two sets of three interactive icons on the dashboard are located at the bottom<br />
left, below the plots. The icon at left—a lock—is called the Scale Lock button. Left-click it<br />
to toggle in <strong>and</strong> out of autoscaling for each plot. To the right of the Scale Lock button are<br />
two icons—called Scale Format buttons—that you can right-click to configure the format,<br />
precision <strong>and</strong> mapping mode of plotted data, set the visibility of the scale <strong>and</strong> scale label,<br />
<strong>and</strong> change the grid <strong>and</strong> plot colors.<br />
Uploading <strong>and</strong> Viewing Data Logs<br />
To upload your data logs, click on the STOP UPLOAD virtual button under <strong>DATA</strong>LOG at the<br />
bottom of the dashboard. When you do so, the button label will change to UPLOAD <strong>and</strong> the<br />
orange segment of the progress bar running horizontally across the middle of the dashboard<br />
will turn green <strong>and</strong> slowly grow longer to the right. When the bar stops growing, click on<br />
UPLOAD.<br />
As was the case for Record data, you will then be prompted to choose a storage location for<br />
this .txt/.xlsx DataLog file. Add the date as a suffix to the generic “DataLog” file name <strong>and</strong><br />
store the file on your computer’s desktop. Once you have done so, click the OK button of the<br />
dialog box.<br />
Locate the file on your desktop, double-click on its icon, <strong>and</strong> open the file in Microsoft Excel,<br />
Microsoft Notepad or Microsoft WordPad. As before, depending on the version of Excel you<br />
are using, you may be prompted to verify the integrity of the file (by clicking Yes) prior to<br />
opening it.<br />
20
Note the tabular format of the data as well as the column headings <strong>and</strong> the time stamps (the<br />
third column in Notepad <strong>and</strong> WordPad, <strong>and</strong> Column C in Excel). Like Record data, Data Logs<br />
comprise three sets of readings (IR Temperature, Air Velocity <strong>and</strong> Air Temperature) that are<br />
expressed in default units <strong>and</strong> displayed in chronological order. Unlike Record data, the<br />
time stamps of Data Logs begin when you started data logging <strong>and</strong> stop when you stopped<br />
logging. Also, unlike Record data, Data Log data points are captured at the sampling rate you<br />
selected (or the previous default sampling rate, if you chose not to select a new rate) before<br />
beginning a data logging session.<br />
Finally, note that when you upload data logs, all logs in the instrument’s memory are<br />
uploaded, not just the logs of your most recent session. To clear the data logging memory<br />
in the CIH20DL, follow the instruments for the “Clear Data Logging Memory” box of the<br />
flowchart (Fig. 8) on p. 13.<br />
Instructions for optimizing the graphical presentation of data logs are beyond the scope of<br />
this manual. Using Excel, rather than Notepad or WordPad, to open data log files offers the<br />
most options for viewing flexibility.<br />
21
SPECIFICATIONS<br />
Air Speed Measurement Range 2 ft/min to 7874 ft/min (20 mm/sec to 40 m/sec)<br />
Air Speed Measurement Basic Accuracy ±3% of reading<br />
Air Speed Measurement Resolution 0.1 ft/min; 0.01 m/s; 0.01 km/h; 0.01 mph;<br />
0.01 knots<br />
Airflow Volume Measurement Range 0 to 2.5 million <strong>CFM</strong> (0 to 72,000 <strong>CMM</strong>)<br />
Airflow Volume Measurement Basic Accuracy ±3% of reading<br />
Airflow Volume Measurement Resolution 1 <strong>CMM</strong>; 1 <strong>CFM</strong> from 0 to 99,999 <strong>CFM</strong>;<br />
10 <strong>CFM</strong> from 100,000 to 999,999 <strong>CFM</strong>;<br />
100 <strong>CFM</strong> from 1,000,000 to 2,500,000 <strong>CFM</strong><br />
Air Temperature Measurement Range 32° to 158°F (0° to 70°C)<br />
Air Temperature Measurement Basic Accuracy ±3% of reading<br />
Air Temperature Measurement Resolution 0.1°F (0.1°C)<br />
IR (Surface) Temperature Measurement Range -25° to 999°F (-32° to 538°C)<br />
IR Temperature Measurement Accuracy ±5.4°F (3°C) from -25° to -4°F (-32° to 20°C);<br />
±3.6°F (2°C) from -4° to 212°F (-20° to 100°C);<br />
2% of reading from 212° to 999°F (100° to 538°C)<br />
IR Temperature Measurement Resolution 0.1°F (0.1°C)<br />
IR Thermometer Emissivity 0.95 (fixed)<br />
IR Thermometer Distance-to-Spot Ratio 8:1<br />
Airflow Register Area Range 0.01 to 322.92 ft 2 in increments of 0.01 ft 2 ,<br />
or 0.001 to 30m 2 in increments of 0.001 m 2<br />
Sampling Time Range 5 seconds to 59 minutes, 59 seconds<br />
Internal Measurement Storage Capacity 9 sets of 3 readings<br />
Internal Data Log Storage Capacity 20,000 points<br />
Auto Power Off After 10 minutes of inactivity on battery power;<br />
after 30 minutes of inactivity on AC power;<br />
disabled when meter is running on AC power in<br />
Data Logging mode<br />
Backlight Duration 15 seconds<br />
Display Size 1.69 x 2.4 in. (33 x 51mm)<br />
Operating Temperature 32° to 122°F (0° to 50°C) @ 10 to 90% RH<br />
Storage Temperature 14° to 140°F (-10° to 60°C)<br />
Dimensions of Instrument 7.24 x 2.75 x 1.57 in. (184 x 70 x 40mm)<br />
Weight of Instrument 11.3 oz. (320g)<br />
Extended Length of Telescoping Probe <strong>and</strong> Cable 70.8 in. (1.8m)<br />
Power Source 1 “9V” battery (included)<br />
Dimensions of Protective Carrying Case 10.88 x 10.50 x 2.88 in. (276 x 267 x 73mm)<br />
Weight of Instrument, Accessories <strong>and</strong> Case 44.5 oz. (1.26kg)<br />
22
MAINTENANCE TIPS<br />
Remove the battery before storing the meter for an extended period of time.<br />
Do not drop or disassemble the meter or immerse it in water.<br />
WARRANTY INFORMATION<br />
General Tools & Instruments’ (General’s) CIH20DL Data Logging Hot Wire Anemometer <strong>with</strong><br />
<strong>CFM</strong>/<strong>CMM</strong> <strong>and</strong> 8:1 IR Thermometer is warranted to the original purchaser to be free from<br />
defects in material <strong>and</strong> workmanship for a period of one year. Subject to certain restrictions,<br />
General will repair or replace this instrument if, after examination, the company determines it<br />
to be defective in material or workmanship.<br />
This warranty does not apply to damages that General determines to be from an attempted<br />
repair by non-authorized personnel or misuse, alterations, normal wear <strong>and</strong> tear, or<br />
accidental damage. The defective unit must be returned to General Tools & Instruments or to<br />
a General-authorized service center, freight prepaid <strong>and</strong> insured.<br />
Acceptance of the exclusive repair <strong>and</strong> replacement remedies described herein is a condition<br />
of the contract for purchase of this product. In no event shall General be liable for any<br />
incidental, special, consequential or punitive damages, or for any cost, attorneys’ fees,<br />
expenses, or losses alleged to be a consequence of damage due to failure of, or defect in<br />
any product including, but not limited to, any claims for loss of profits.<br />
RETURN FOR REPAIR POLICY<br />
Every effort has been made to provide you <strong>with</strong> a reliable product of superior quality.<br />
However, in the event your instrument requires repair, please contact our Customer Service<br />
to obtain an RGA (Return Goods Authorization) number before forwarding the unit via prepaid<br />
freight to the attention of our Service Center at this address:<br />
General Tools & Instruments<br />
80 White Street<br />
New York, NY 10013<br />
212-431-6100<br />
Remember to include a copy of your proof of purchase, your return address, <strong>and</strong> your phone<br />
number <strong>and</strong>/or e-mail address.<br />
23
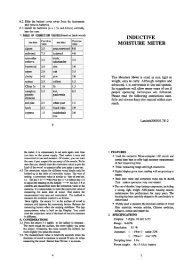
APPENDIX<br />
24<br />
mm 25@200<br />
inches<br />
1@8<br />
50@400 75@600<br />
2@16<br />
3@24<br />
Numbers indicate spot size@distance<br />
The field of view of the CIH20DL's IR thermometer<br />
HOW TO MAKE ACCURATE IR MEASUREMENTS<br />
The CIH20DL has a distance-to-spot (D:S) ratio of 8:1. This means that the target area<br />
(spot) whose infrared radiation (temperature) is being measured increases in<br />
diameter by 1 inch for every 8 inches you move away from the target. Conversely, the<br />
diameter of the target area measured decreases by 1 inch for every 8 inches you<br />
move closer to the target.<br />
All IR thermometers (IRTs), including the CIH20DL, take the average temperature of all<br />
objects <strong>with</strong>in a circular target area (spot). Although the distance “D” in the D:S ratio<br />
is defined as a linear value <strong>and</strong> the “S” defines the diameter of the spot (see above<br />
figure), the critical parameter is the target area. Depending on the distance to the<br />
target (the object whose temperature you want to measure), the target area may<br />
include both the target <strong>and</strong> background objects near or behind the thermometer’s<br />
field of view, which defines the target area or spot.<br />
To explain the relationship between D:S ratio <strong>and</strong> measurement accuracy, consider<br />
how the CIH20DL would be used to measure the temperature of a small AC motor<br />
suspected of overheating. The motor measures approximately 1 ft. x 1 ft., so it has an<br />
area of 1 ft 2 . If the CIH20DL is used to make the measurement from 24 ft. away, the<br />
reading will have a large error. At this distance, the target area is 3 ft 2 . Therefore, the<br />
CIH20DL will measure not just the temperature of the motor, but also the temperature<br />
of the physical surroundings in its field of view, <strong>and</strong> average the two readings.<br />
How inaccurate would the measurement be? If the motor’s operating temperature is<br />
200°F <strong>and</strong> the background temperature is 75°F, <strong>and</strong> the motor’s area is half the<br />
target area at the measurement distance, the following equation gives the average<br />
temperature of the target area:<br />
Tavg = (Tmotor + Tbackground) ÷ 2<br />
Solving for Tavg, we get (200 + 75) ÷ 2 or 137.5°F., which is what the CIH20DL would<br />
display. In other words, trying to measure the temperature of the motor from 24 ft.<br />
away introduced an error of (200-137.5) ÷ 200, or 31% into the measurement. In this<br />
case, the measured temperature was 31% below the motor’s actual temperature<br />
because the background is cooler than the motor.
To eliminate measurement error, the CIH20DL must be moved close enough so the<br />
motor is the only object in the target area of its IRT (see below figure). For a motor<br />
<strong>with</strong> an area of 1 ft 2 <strong>and</strong> using an IRT <strong>with</strong> a D:S ratio of 8:1, the optimum<br />
measurement distance would be 8 ft.<br />
For best results, the targeted area (spot) should fall <strong>with</strong>in the target’s boundaries<br />
Measuring a motor’s temperature from the wrong (top) <strong>and</strong> right (bottom) distance<br />
wall<br />
25
NOTES<br />
__________________________________________________________________________<br />
26<br />
__________________________________________________________________________<br />
__________________________________________________________________________<br />
__________________________________________________________________________<br />
__________________________________________________________________________<br />
__________________________________________________________________________<br />
__________________________________________________________________________<br />
__________________________________________________________________________<br />
__________________________________________________________________________<br />
__________________________________________________________________________<br />
__________________________________________________________________________<br />
__________________________________________________________________________<br />
__________________________________________________________________________<br />
__________________________________________________________________________<br />
__________________________________________________________________________<br />
__________________________________________________________________________<br />
__________________________________________________________________________<br />
__________________________________________________________________________<br />
__________________________________________________________________________<br />
__________________________________________________________________________<br />
__________________________________________________________________________
NOTES<br />
__________________________________________________________________________<br />
__________________________________________________________________________<br />
__________________________________________________________________________<br />
__________________________________________________________________________<br />
__________________________________________________________________________<br />
__________________________________________________________________________<br />
__________________________________________________________________________<br />
__________________________________________________________________________<br />
__________________________________________________________________________<br />
__________________________________________________________________________<br />
__________________________________________________________________________<br />
__________________________________________________________________________<br />
__________________________________________________________________________<br />
__________________________________________________________________________<br />
__________________________________________________________________________<br />
__________________________________________________________________________<br />
__________________________________________________________________________<br />
__________________________________________________________________________<br />
__________________________________________________________________________<br />
__________________________________________________________________________<br />
__________________________________________________________________________<br />
27
GENERAL TOOLS & INSTRUMENTS<br />
80 White Street<br />
New York, NY 10013-3567<br />
PHONE (212) 431-6100<br />
FAX (212) 431-6499<br />
TOLL FREE (800) 697-8665<br />
e-mail: sales@generaltools.com<br />
www.generaltools.com<br />
CIH20DL User’s Manual<br />
Specifications subject to change <strong>with</strong>out notice<br />
©2011 GENERAL TOOLS & INSTRUMENTS<br />
NOTICE - WE ARE NOT RESPONSIBLE FOR TYPOGRAPHICAL ERRORS.<br />
MAN#CIH20DL 12/21/11