CHP Feasibility Study - Houston Advanced Research Center
CHP Feasibility Study - Houston Advanced Research Center
CHP Feasibility Study - Houston Advanced Research Center
Create successful ePaper yourself
Turn your PDF publications into a flip-book with our unique Google optimized e-Paper software.
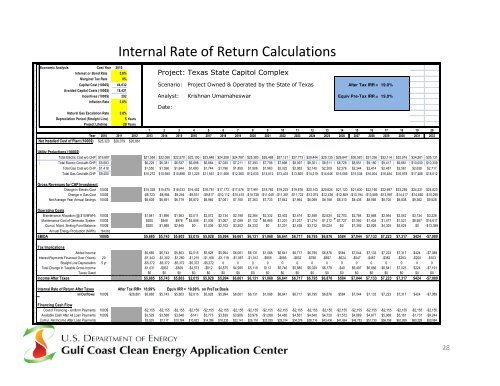
Economic Analysis Cost Year 2010<br />
Interest or Bond Rate 5.0%<br />
Marginal Tax Rate 0%<br />
Internal Rate of Return Calculations<br />
Capital Cost (1000$) 44,032 Scenario: Project Owned & Operated by the State of Texas After Tax IRR = 19.0%<br />
Avoided Capital Costs (1000$) 18,421<br />
Incentives (1000$) 292 Analyst: Krishnan Umamaheswar Equiv Pre-Tax IRR = 19.0%<br />
Inflation Rate 3.0%<br />
Natural Gas Escalation Rate 3.0%<br />
Depreciation Period (Straight Line) 5 Years<br />
Project Lifetime 20 Years<br />
Project: Texas State Capitol Complex<br />
Date:<br />
1 2 3 4 5 6 7 8 9 10 11 12 13 14 15 16 17 18 19 20<br />
Year 2010 2011 2012 2013 2014 2015 2016 2017 2018 2019 2020 2021 2022 2023 2024 2025 2026 2027 2028 2029 2030 2031 2032<br />
Net Installed Cost of Plant (1000$) $25,320 $26,079 $26,861<br />
Utility Projections (1000$)<br />
Total Electric Cost w/o <strong>CHP</strong> $19,697 $21,556 $22,056 $22,570 $23,100 $23,646 $24,208 $24,787 $25,383 $26,488 $27,121 $27,773 $28,444 $29,135 $29,847 $30,581 $31,336 $32,114 $32,916 $34,281 $35,131<br />
Total Electric Cost with <strong>CHP</strong> $5,683 $6,229 $6,381 $6,537 $6,698 $6,864 $7,035 $7,211 $7,393 $7,706 $7,898 $8,097 $8,301 $8,511 $8,728 $8,951 $9,180 $9,417 $9,661 $10,050 $10,309<br />
Total Gas Cost w/o <strong>CHP</strong> $1,418 $1,550 $1,596 $1,644 $1,693 $1,744 $1,796 $1,850 $1,906 $1,963 $2,022 $2,083 $2,145 $2,209 $2,276 $2,344 $2,414 $2,487 $2,561 $2,638 $2,717<br />
Total Gas Cost with <strong>CHP</strong> $9,400 $10,272 $10,580 $10,898 $11,225 $11,561 $11,908 $12,265 $12,633 $13,012 $13,403 $13,805 $14,219 $14,646 $15,085 $15,538 $16,004 $16,484 $16,978 $17,488 $18,012<br />
Gross Revenues for <strong>CHP</strong> Investment<br />
Change in Electric Cost 1000$ $15,328 $15,675 $16,033 $16,402 $16,781 $17,173 $17,576 $17,991 $18,782 $19,223 $19,676 $20,143 $20,624 $21,120 $21,630 $22,156 $22,697 $23,255 $24,231 $24,823<br />
Change in Gas Cost 1000$ -$8,723 -$8,984 -$9,254 -$9,531 -$9,817 -$10,112 -$10,415 -$10,728 -$11,049 -$11,381 -$11,722 -$12,074 -$12,436 -$12,809 -$13,194 -$13,589 -$13,997 -$14,417 -$14,850 -$15,295<br />
Net Average Year Annual Savings 1000$ $6,605 $6,691 $6,779 $6,870 $6,964 $7,061 $7,160 $7,263 $7,733 $7,842 $7,954 $8,069 $8,188 $8,310 $8,436 $8,566 $8,700 $8,838 $9,382 $9,528<br />
Operating Costs<br />
Maintenance Allocation (@ $10/MWH) 1000$ $1,841 $1,896 $1,953 $2,011 $2,072 $2,134 $2,198 $2,264 $2,332 $2,402 $2,474 $2,548 $2,624 $2,703 $2,784 $2,868 $2,954 $3,042 $3,134 $3,228<br />
Maintenance Cost of Generator System 1000$ $920 $948 $976 $4,856 $1,036 $1,067 $1,099 $1,132 $6,665 $1,201 $1,237 $1,274 $1,312 $7,727 $1,392 $1,434 $1,477 $1,521 $8,957 $16,617<br />
Cumul. Maint. Sinking Fund Balance 1000$ $920 $1,868 $2,845 $0 $1,036 $2,103 $3,202 $4,333 $0 $1,201 $2,438 $3,712 $5,024 $0 $1,392 $2,826 $4,303 $5,824 $0 -$13,389<br />
Annual Energy Production (MWh) 184,062<br />
EBIDA 1000$ $5,685 $5,743 $5,803 $2,015 $5,928 $5,994 $6,061 $6,131 $1,068 $6,641 $6,717 $6,795 $6,876 $584 $7,044 $7,133 $7,223 $7,317 $424 -$7,089<br />
Tax Implications<br />
Added Income $5,685 $5,743 $5,803 $2,015 $5,928 $5,994 $6,061 $6,131 $1,068 $6,641 $6,717 $6,795 $6,876 $584 $7,044 $7,133 $7,223 $7,317 $424 -$7,089<br />
Interest Payments Financed Over (Years) 20 -$1,343 -$1,302 -$1,260 -$1,215 -$1,168 -$1,119 -$1,067 -$1,012 -$955 -$895 -$832 -$766 -$697 -$624 -$547 -$467 -$382 -$293 -$200 -$103<br />
Straight Line Depreciation 5 yr -$5,372 -$5,372 -$5,372 -$5,372 -$5,372 0 0 0 0 0 0 0 0 0 0 0 0 0 0 0<br />
Total Change in Taxable Gross Income -$1,031 -$932 -$829 -$4,573 -$612 $4,875 $4,995 $5,119 $113 $5,746 $5,885 $6,029 $6,179 -$40 $6,497 $6,666 $6,841 $7,023 $224 -$7,191<br />
Taxes Owed $0 $0 $0 $0 $0 $0 $0 $0 $0 $0 $0 $0 $0 $0 $0 $0 $0 $0 $0 $0<br />
Income After Taxes $5,685 $5,743 $5,803 $2,015 $5,928 $5,994 $6,061 $6,131 $1,068 $6,641 $6,717 $6,795 $6,876 $584 $7,044 $7,133 $7,223 $7,317 $424 -$7,089<br />
Internal Rate of Return After Taxes After Tax IRR= 18.99% Equiv IRR = 18.99% on PreTax Basis<br />
In/Outflows 1000$ -$26,861 $5,685 $5,743 $5,803 $2,015 $5,928 $5,994 $6,061 $6,131 $1,068 $6,641 $6,717 $6,795 $6,876 $584 $7,044 $7,133 $7,223 $7,317 $424 -$7,089<br />
Financing Cash Flow<br />
Cost of Financing - Uniform Payments 1000$ -$2,155 -$2,155 -$2,155 -$2,155 -$2,155 -$2,155 -$2,155 -$2,155 -$2,155 -$2,155 -$2,155 -$2,155 -$2,155 -$2,155 -$2,155 -$2,155 -$2,155 -$2,155 -$2,155 -$2,155<br />
Available Cash After All Loan Payments 1000$ $3,529 $3,588 $3,648 -$141 $3,773 $3,839 $3,906 $3,976 -$1,088 $4,485 $4,561 $4,640 $4,720 -$1,572 $4,889 $4,977 $5,068 $5,161 -$1,731 -$9,244<br />
Cumul. Net Income After Loan Payments $3,529 $7,117 $10,764 $10,623 $14,396 $18,235 $22,141 $26,116 $25,029 $29,514 $34,076 $38,716 $43,436 $41,864 $46,753 $51,730 $56,798 $61,959 $60,228 $50,984<br />
28


