Since Inception IRR (%) - Venture funds (purely ... - BVCA admin
Since Inception IRR (%) - Venture funds (purely ... - BVCA admin
Since Inception IRR (%) - Venture funds (purely ... - BVCA admin

Create successful ePaper yourself
Turn your PDF publications into a flip-book with our unique Google optimized e-Paper software.
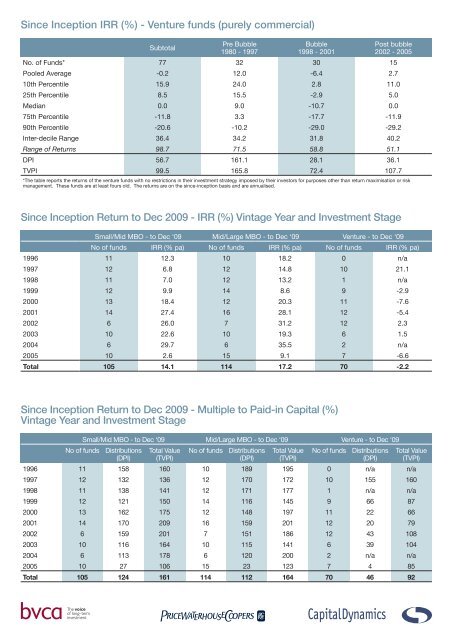
<strong>Since</strong> <strong>Inception</strong> <strong>IRR</strong> (%) - <strong>Venture</strong> <strong>funds</strong> (<strong>purely</strong> commercial)<br />
Subtotal<br />
Pre Bubble<br />
1980 - 1997<br />
Bubble<br />
1998 - 2001<br />
Post bubble<br />
2002 - 2005<br />
No. of Funds* 77 32 30 15<br />
Pooled Average -0.2 12.0 -6.4 2.7<br />
10th Percentile 15.9 24.0 2.8 11.0<br />
25th Percentile 8.5 15.5 -2.9 5.0<br />
Median 0.0 9.0 -10.7 0.0<br />
75th Percentile -11.8 3.3 -17.7 -11.9<br />
90th Percentile -20.6 -10.2 -29.0 -29.2<br />
Inter-decile Range 36.4 34.2 31.8 40.2<br />
Range of Returns 98.7 71.5 58.8 51.1<br />
DPI 56.7 161.1 28.1 36.1<br />
TVPI 99.5 165.8 72.4 107.7<br />
*The table reports the returns of the venture <strong>funds</strong> with no restrictions in their investment strategy imposed by their investors for purposes other than return maximisation or risk<br />
management. These <strong>funds</strong> are at least fours old. The returns are on the since-inception basis and are annualised.<br />
<strong>Since</strong> <strong>Inception</strong> Return to Dec 2009 - <strong>IRR</strong> (%) Vintage Year and Investment Stage<br />
Small/Mid MBO - to Dec ‘09 Mid/Large MBO - to Dec ‘09 <strong>Venture</strong> - to Dec ‘09<br />
No of <strong>funds</strong> <strong>IRR</strong> (% pa) No of <strong>funds</strong> <strong>IRR</strong> (% pa) No of <strong>funds</strong> <strong>IRR</strong> (% pa)<br />
1996 11 12.3 10 18.2 0 n/a<br />
1997 12 6.8 12 14.8 10 21.1<br />
1998 11 7.0 12 13.2 1 n/a<br />
1999 12 9.9 14 8.6 9 -2.9<br />
2000 13 18.4 12 20.3 11 -7.6<br />
2001 14 27.4 16 28.1 12 -5.4<br />
2002 6 26.0 7 31.2 12 2.3<br />
2003 10 22.6 10 19.3 6 1.5<br />
2004 6 29.7 6 35.5 2 n/a<br />
2005 10 2.6 15 9.1 7 -6.6<br />
Total 105 14.1 114 17.2 70 -2.2<br />
<strong>Since</strong> <strong>Inception</strong> Return to Dec 2009 - Multiple to Paid-in Capital (%)<br />
Vintage Year and Investment Stage<br />
Small/Mid MBO - to Dec ‘09 Mid/Large MBO - to Dec ‘09 <strong>Venture</strong> - to Dec ‘09<br />
No of <strong>funds</strong> Distributions<br />
(DPI)<br />
Total Value<br />
(TVPI)<br />
No of <strong>funds</strong> Distributions<br />
(DPI)<br />
Total Value<br />
(TVPI)<br />
No of <strong>funds</strong> Distributions<br />
(DPI)<br />
Total Value<br />
(TVPI)<br />
1996 11 158 160 10 189 195 0 n/a n/a<br />
1997 12 132 136 12 170 172 10 155 160<br />
1998 11 138 141 12 171 177 1 n/a n/a<br />
1999 12 121 150 14 116 145 9 66 87<br />
2000 13 162 175 12 148 197 11 22 66<br />
2001 14 170 209 16 159 201 12 20 79<br />
2002 6 159 201 7 151 186 12 43 108<br />
2003 10 116 164 10 115 141 6 39 104<br />
2004 6 113 178 6 120 200 2 n/a n/a<br />
2005 10 27 106 15 23 123 7 4 85<br />
Total 105 124 161 114 112 164 70 46 92
Range of Returns - <strong>IRR</strong> (%) by Investment Stage and Subcategories<br />
<strong>Since</strong> <strong>Inception</strong> to Dec 2009<br />
Pre-1996 Vintage Funds<br />
Subtotal Early Stage Development Mid MBO Large MBO Generalist<br />
No. of Funds 153 24 35 33 26 35<br />
Pooled Average 15.6 9.2 10.2 15.7 18.2 15.8<br />
10th Percentile 27.0 19.5 16.9 33.2 44.5 24.3<br />
25th Percentile 17.6 15.5 12.0 22.0 26.3 15.3<br />
Median 9.6 9.0 5.1 13.8 18.0 8.7<br />
75th Percentile 3.8 3.3 -7.0 5.5 9.4 2.5<br />
90th Percentile -5.5 -6.0 -9.2 1.5 0.8 -1.5<br />
Inter-decile Range 32.4 25.5 26.1 31.7 43.7 25.7<br />
Range of Returns 111.6 52.9 60.0 47.6 67.9 111.6<br />
1996 Vintage Funds Onwards<br />
Subtotal <strong>Venture</strong><br />
<strong>Venture</strong><br />
pre-2002<br />
<strong>Venture</strong> 2002<br />
onwards<br />
Small MBO Mid MBO Large MBO<br />
No. of Funds 202 70 43 27 18 87 27<br />
Pooled Average 16.1 -2.2 -3.1 0.2 17.3 14.0 19.2<br />
10th Percentile 36.0 7.7 9.3 7.8 58.0 45.4 38.2<br />
25th Percentile 18.0 1.5 1.5 1.5 20.5 23.6 29.5<br />
Median 3.9 -7.8 -6.4 -8.7 -4.2 10.4 17.9<br />
75th Percentile -8.0 -13.8 -13.8 -13.7 -16.6 -1.7 12.8<br />
90th Percentile -17.7 -22.2 -23.6 -22.6 -39.5 -9.0 2.3<br />
Inter-decile Range 53.7 29.9 32.8 30.4 97.6 54.4 35.9<br />
Range of Returns 176.2 98.7 98.7 51.1 168.5 99.1 98.0
Range of Returns - Multiple (%) by Investment Stage and Subcategories<br />
Distributions (DPI) - <strong>Since</strong> <strong>Inception</strong> to Dec 2009<br />
Pre-1996 Vintage Funds<br />
Total Early Stage Development Mid MBO Large MBO Generalist<br />
No. of Funds 153 24 35 33 26 35<br />
Pooled Average 197 165 171 175 192 242<br />
10th Percentile 270 326 266 250 255 315<br />
Inter-decile Range 208 301 223 143 155 251<br />
Range of Returns 539 511 492 265 400 522<br />
1996 Vintage Funds Onwards<br />
Subtotal <strong>Venture</strong><br />
<strong>Venture</strong><br />
pre-2002<br />
<strong>Venture</strong> 2002<br />
onwards<br />
Small MBO Mid MBO Large MBO<br />
No. of Funds 202 70 43 27 18 87 27<br />
Pooled Average 108 46 52 32 135 123 107<br />
10th Percentile 209 118 137 65 464 230 248<br />
25th Percentile 152 46 55 32 193 168 195<br />
Median 78 18 31 6 62 126 134<br />
75th Percentile 17 1 12 0 33 69 63<br />
90th Percentile 0 0 0 0 0 13 8<br />
Inter-decile Range 209 118 137 65 464 217 240<br />
Range of Returns 553 198 198 96 553 381 282
Range of Returns - Multiple (%) by Investment Stage and Subcategories<br />
Total Value (TVPI) <strong>Since</strong> <strong>Inception</strong> to Dec 2009<br />
Pre-1996 Vintage Funds<br />
Subtotal Early Stage Development Mid MBO Large MBO Generalist<br />
No. of Funds 153 24 35 33 26 35<br />
Pooled Average 197 171 171 176 192 243<br />
10th Percentile 270 326 266 250 255 315<br />
25th Percentile 218 228 171 208 207 246<br />
Median 160 176 126 160 185 175<br />
75th Percentile 119 115 68 125 140 125<br />
90th Percentile 67 65 43 107 100 65<br />
Inter-decile Range 204 261 223 143 155 250<br />
Range of Returns 532 505 492 265 399 522<br />
1996 Vintage Funds Onwards<br />
Subtotal <strong>Venture</strong><br />
<strong>Venture</strong><br />
pre-2002<br />
<strong>Venture</strong><br />
2002 onwards<br />
Small MBO Mid MBO Large MBO<br />
No. of Funds 202 70 43 27 18 87 27<br />
Pooled Average 159 92 89 101 162 161 165<br />
10th Percentile 242 129 150 121 464 269 256<br />
25th Percentile 174 106 107 106 199 199 242<br />
Median 115 71 74 65 87 153 179<br />
75th Percentile 69 48 47 49 47 95 134<br />
90th Percentile 42 26 24 22 4 71 108<br />
Inter-decile Range 200 103 126 99 461 198 148<br />
Range of Returns 553 200 195 145 551 405 220
Range of Returns - <strong>IRR</strong> (%) by Vintage Year <strong>Since</strong> <strong>Inception</strong> to Dec 2009<br />
Total 1980-84 1985-89 1990 1991 1992 1993 1994 1995<br />
No. of Funds 355 13 68 13 14 7 10 19 9<br />
Pooled Average 15.9 9.5 13.7 11.3 23.4 20.3 15.0 34.3 23.1<br />
10th Percentile 32.4 19.9 21.9 35.5 38.2 n/a 27.2 51.6 n/a<br />
25th Percentile 17.9 14.7 15.7 24.2 27.8 22.0 15.4 33.7 12.4<br />
Median 8.1 8.1 8.8 8.9 16.8 20.2 5.3 13.8 1.9<br />
75th Percentile -3.1 4.1 4.2 2.8 4.3 11.0 -3.0 8.1 -0.7<br />
90th Percentile -13.4 -21.1 -7.0 -2.2 -9.3 n/a -12.6 2.0 n/a<br />
Inter-decile Range 45.9 41.0 29.0 37.7 47.5 n/a 39.8 49.6 n/a<br />
Range of Returns 176.2 56.8 67.6 39.4 50.5 31.2 41.1 51.6 91.0<br />
Continued<br />
1996 1997 1998 1999 2000 2001 2002 2003 2004 2005<br />
No. of Funds 13 24 16 24 26 30 19 18 9 23<br />
Pooled Average 17.8 15.1 12.9 8.0 16.2 26.6 25.5 17.5 34.1 8.4<br />
10th Percentile 41.1 57.5 25.8 19.0 26.3 40.9 35.9 47.2 n/a 37.7<br />
25th Percentile 21.2 12.8 16.8 13.7 14.0 32.5 17.7 19.5 49.1 17.9<br />
Median 10.0 7.1 3.8 4.4 -1.4 15.4 1.5 6.6 12.9 -3.6<br />
75th Percentile -6.8 -4.0 -8.4 -10.7 -10.3 -6.5 -13.5 -4.3 -1.8 -13.1<br />
90th Percentile -66.0 -13.0 -21.0 -13.6 -22.6 -17.4 -21.5 -14.3 n/a -32.8<br />
Inter-decile Range 107.1 70.5 46.7 32.6 48.9 58.3 57.4 61.5 n/a 70.5<br />
Range of Returns 150.7 98.1 67.1 60.7 101.4 94.1 73.2 81.7 74.3 87.6
Range of Returns - Multiple (%) by Vintage Year Distributions (DPI)<br />
<strong>Since</strong> <strong>Inception</strong> to Dec 2009<br />
Total 1980-84 1985-89 1990 1991 1992 1993 1994 1995<br />
No. of Funds 355 13 68 13 14 7 10 19 9<br />
Pooled Average 116 206 184 157 186 193 189 265 192<br />
10th Percentile 250 441 287 281 276 n/a 250 321 n/a<br />
25th Percentile 181 251 216 205 203 224 176 227 203<br />
Median 127 193 174 161 159 189 123 154 107<br />
75th Percentile 47 134 119 109 124 140 74 134 78<br />
90th Percentile 8 48 46 86 55 n/a 36 106 n/a<br />
Inter-decile Range 242 393 240 196 221 n/a 214 215 n/a<br />
Range of Returns 553 492 511 208 273 178 220 354 500<br />
Continued<br />
1996 1997 1998 1999 2000 2001 2002 2003 2004 2005<br />
No. of Funds 13 24 16 24 26 30 19 18 9 23<br />
Pooled Average 186 166 168 113 128 153 131 108 117 22<br />
10th Percentile 283 228 308 177 179 334 171 176 n/a 77<br />
25th Percentile 196 175 190 157 142 171 123 137 206 13<br />
Median 136 121 117 90 54 124 32 68 45 8<br />
75th Percentile 52 83 63 43 23 24 0 31 6 0<br />
90th Percentile 20 47 32 6 5 0 0 9 n/a 0<br />
Inter-decile Range 263 181 276 171 174 334 171 167 n/a 77<br />
Range of Returns 306 276 441 282 339 553 352 199 288 218
Range of Returns - Multiple (%) by Vintage Year Total Value (TVPI)<br />
<strong>Since</strong> <strong>Inception</strong> to Dec 2009<br />
Total 1980-84 1985-89 1990 1991 1992 1993 1994 1995<br />
No. of Funds 355 13 68 13 14 7 10 19 9<br />
Pooled Average 162 206 185 157 186 193 189 265 192<br />
10th Percentile 256 441 287 281 276 n/a 250 321 n/a<br />
25th Percentile 192 251 216 205 203 224 176 227 204<br />
Median 140 193 177 161 159 189 123 159 107<br />
75th Percentile 85 134 120 109 124 140 84 135 78<br />
90th Percentile 48 48 59 86 58 n/a 44 119 n/a<br />
Inter-decile Range 208 393 227 195 218 n/a 206 202 n/a<br />
Range of Returns 553 492 505 208 268 178 211 354 501<br />
Continued<br />
1996 1997 1998 1999 2000 2001 2002 2003 2004 2005<br />
No. of Funds 13 24 16 24 26 30 19 18 9 23<br />
Pooled Average 192 168 174 141 175 196 171 138 196 121<br />
10th Percentile 288 228 308 211 231 354 227 220 n/a 203<br />
25th Percentile 200 178 199 167 153 208 162 154 266 150<br />
Median 143 124 122 121 94 158 106 120 145 82<br />
75th Percentile 57 83 66 57 60 76 52 90 81 62<br />
90th Percentile 20 53 35 30 26 47 31 56 n/a 31<br />
Inter-decile Range 268 175 273 181 205 307 197 165 n/a 172<br />
Range of Returns 306 244 441 271 344 547 352 192 369 267