Cisco Visual Networking Index: Forecast and Methodology, 2010 ...
Cisco Visual Networking Index: Forecast and Methodology, 2010 ...
Cisco Visual Networking Index: Forecast and Methodology, 2010 ...

Create successful ePaper yourself
Turn your PDF publications into a flip-book with our unique Google optimized e-Paper software.
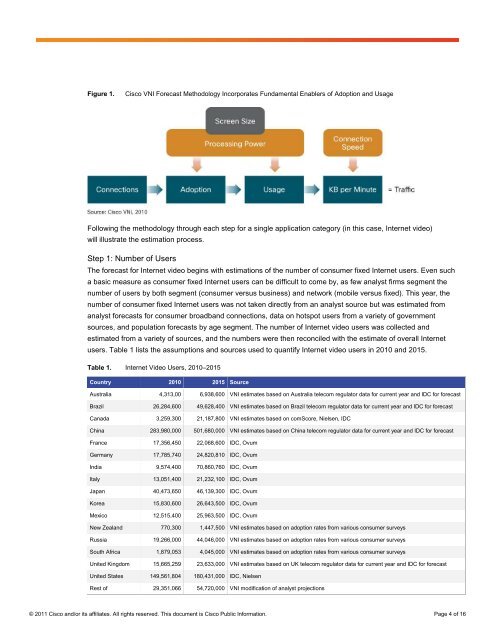
Figure 1. <strong>Cisco</strong> VNI <strong>Forecast</strong> <strong>Methodology</strong> Incorporates Fundamental Enablers of Adoption <strong>and</strong> Usage<br />
Following the methodology through each step for a single application category (in this case, Internet video)<br />
will illustrate the estimation process.<br />
Step 1: Number of Users<br />
The forecast for Internet video begins with estimations of the number of consumer fixed Internet users. Even such<br />
a basic measure as consumer fixed Internet users can be difficult to come by, as few analyst firms segment the<br />
number of users by both segment (consumer versus business) <strong>and</strong> network (mobile versus fixed). This year, the<br />
number of consumer fixed Internet users was not taken directly from an analyst source but was estimated from<br />
analyst forecasts for consumer broadb<strong>and</strong> connections, data on hotspot users from a variety of government<br />
sources, <strong>and</strong> population forecasts by age segment. The number of Internet video users was collected <strong>and</strong><br />
estimated from a variety of sources, <strong>and</strong> the numbers were then reconciled with the estimate of overall Internet<br />
users. Table 1 lists the assumptions <strong>and</strong> sources used to quantify Internet video users in <strong>2010</strong> <strong>and</strong> 2015.<br />
Table 1. Internet Video Users, <strong>2010</strong>–2015<br />
Country <strong>2010</strong> 2015 Source<br />
Australia 4,313,00 6,938,600 VNI estimates based on Australia telecom regulator data for current year <strong>and</strong> IDC for forecast<br />
Brazil 26,284,600 49,628,400 VNI estimates based on Brazil telecom regulator data for current year <strong>and</strong> IDC for forecast<br />
Canada 3,259,300 21,187,800 VNI estimates based on comScore, Nielsen, IDC<br />
China 283,980,000 501,680,000 VNI estimates based on China telecom regulator data for current year <strong>and</strong> IDC for forecast<br />
France 17,356,450 22,068,600 IDC, Ovum<br />
Germany 17,785,740 24,820,810 IDC, Ovum<br />
India 9,574,400 70,860,760 IDC, Ovum<br />
Italy 13,051,400 21,232,100 IDC, Ovum<br />
Japan 40,473,650 46,139,300 IDC, Ovum<br />
Korea 15,830,600 26,643,500 IDC, Ovum<br />
Mexico 12,515,400 25,963,500 IDC, Ovum<br />
New Zeal<strong>and</strong> 770,300 1,447,500 VNI estimates based on adoption rates from various consumer surveys<br />
Russia 19,266,000 44,046,000 VNI estimates based on adoption rates from various consumer surveys<br />
South Africa 1,879,053 4,045,000 VNI estimates based on adoption rates from various consumer surveys<br />
United Kingdom 15,665,259 23,633,000 VNI estimates based on UK telecom regulator data for current year <strong>and</strong> IDC for forecast<br />
United States 149,561,804 180,431,000 IDC, Nielsen<br />
Rest of 29,351,066 54,720,000 VNI modification of analyst projections<br />
© 2011 <strong>Cisco</strong> <strong>and</strong>/or its affiliates. All rights reserved. This document is <strong>Cisco</strong> Public Information. Page 4 of 16