Cisco Visual Networking Index: Forecast and Methodology, 2010 ...
Cisco Visual Networking Index: Forecast and Methodology, 2010 ...
Cisco Visual Networking Index: Forecast and Methodology, 2010 ...

You also want an ePaper? Increase the reach of your titles
YUMPU automatically turns print PDFs into web optimized ePapers that Google loves.
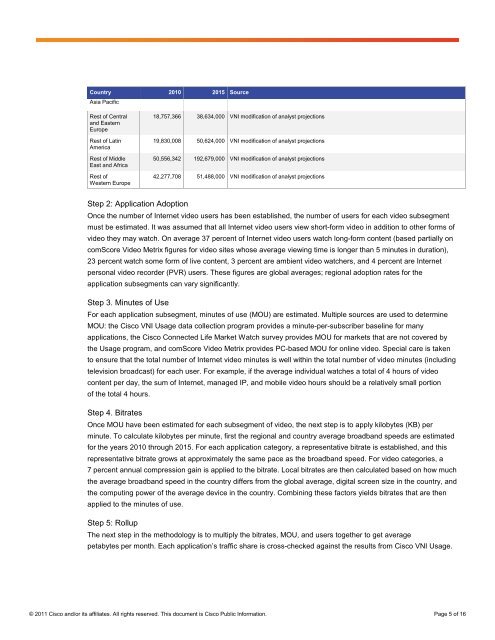
Country <strong>2010</strong> 2015 Source<br />
Asia Pacific<br />
Rest of Central<br />
<strong>and</strong> Eastern<br />
Europe<br />
Rest of Latin<br />
America<br />
Rest of Middle<br />
East <strong>and</strong> Africa<br />
Rest of<br />
Western Europe<br />
Step 2: Application Adoption<br />
18,757,366 38,634,000 VNI modification of analyst projections<br />
19,830,008 50,624,000 VNI modification of analyst projections<br />
50,556,342 192,679,000 VNI modification of analyst projections<br />
42,277,708 51,488,000 VNI modification of analyst projections<br />
Once the number of Internet video users has been established, the number of users for each video subsegment<br />
must be estimated. It was assumed that all Internet video users view short-form video in addition to other forms of<br />
video they may watch. On average 37 percent of Internet video users watch long-form content (based partially on<br />
comScore Video Metrix figures for video sites whose average viewing time is longer than 5 minutes in duration),<br />
23 percent watch some form of live content, 3 percent are ambient video watchers, <strong>and</strong> 4 percent are Internet<br />
personal video recorder (PVR) users. These figures are global averages; regional adoption rates for the<br />
application subsegments can vary significantly.<br />
Step 3. Minutes of Use<br />
For each application subsegment, minutes of use (MOU) are estimated. Multiple sources are used to determine<br />
MOU: the <strong>Cisco</strong> VNI Usage data collection program provides a minute-per-subscriber baseline for many<br />
applications, the <strong>Cisco</strong> Connected Life Market Watch survey provides MOU for markets that are not covered by<br />
the Usage program, <strong>and</strong> comScore Video Metrix provides PC-based MOU for online video. Special care is taken<br />
to ensure that the total number of Internet video minutes is well within the total number of video minutes (including<br />
television broadcast) for each user. For example, if the average individual watches a total of 4 hours of video<br />
content per day, the sum of Internet, managed IP, <strong>and</strong> mobile video hours should be a relatively small portion<br />
of the total 4 hours.<br />
Step 4. Bitrates<br />
Once MOU have been estimated for each subsegment of video, the next step is to apply kilobytes (KB) per<br />
minute. To calculate kilobytes per minute, first the regional <strong>and</strong> country average broadb<strong>and</strong> speeds are estimated<br />
for the years <strong>2010</strong> through 2015. For each application category, a representative bitrate is established, <strong>and</strong> this<br />
representative bitrate grows at approximately the same pace as the broadb<strong>and</strong> speed. For video categories, a<br />
7 percent annual compression gain is applied to the bitrate. Local bitrates are then calculated based on how much<br />
the average broadb<strong>and</strong> speed in the country differs from the global average, digital screen size in the country, <strong>and</strong><br />
the computing power of the average device in the country. Combining these factors yields bitrates that are then<br />
applied to the minutes of use.<br />
Step 5: Rollup<br />
The next step in the methodology is to multiply the bitrates, MOU, <strong>and</strong> users together to get average<br />
petabytes per month. Each application’s traffic share is cross-checked against the results from <strong>Cisco</strong> VNI Usage.<br />
© 2011 <strong>Cisco</strong> <strong>and</strong>/or its affiliates. All rights reserved. This document is <strong>Cisco</strong> Public Information. Page 5 of 16