Pulsating Variable Stars and The Hertzsprung- Russell Diagram
Pulsating Variable Stars and The Hertzsprung- Russell Diagram
Pulsating Variable Stars and The Hertzsprung- Russell Diagram

You also want an ePaper? Increase the reach of your titles
YUMPU automatically turns print PDFs into web optimized ePapers that Google loves.
Page 22 <strong>The</strong> Earth Scientist<br />
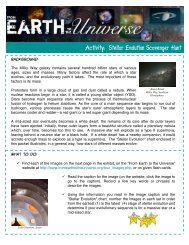
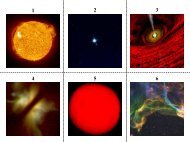
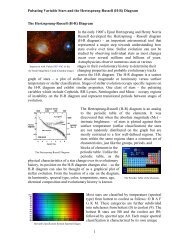
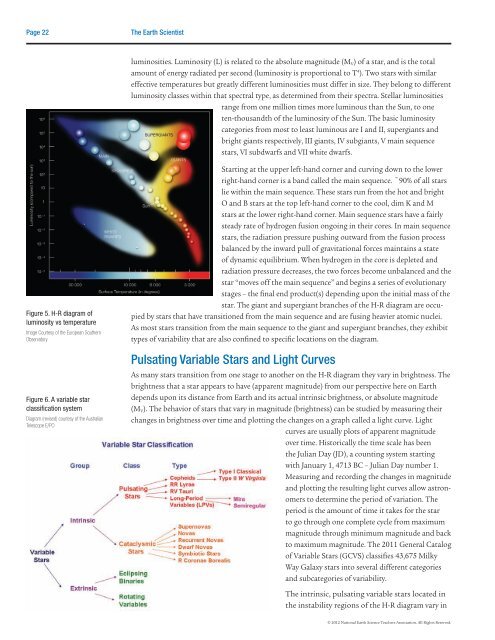
Figure 5. H-R diagram of<br />
luminosity vs temperature<br />
Image Courtesy of the European Southern<br />
Observatory<br />
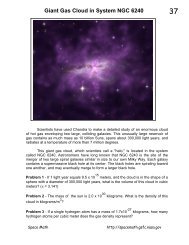
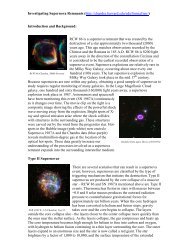
Figure 6. A variable star<br />
classification system<br />
<strong>Diagram</strong> (revised) courtesy of the Australian<br />
Telescope E/PO<br />
luminosities. Luminosity (L) is related to the absolute magnitude (M V) of a star, <strong>and</strong> is the total<br />
amount of energy radiated per second (luminosity is proportional to T 4 ). Two stars with similar<br />
effective temperatures but greatly different luminosities must differ in size. <strong>The</strong>y belong to different<br />
luminosity classes within that spectral type, as determined from their spectra. Stellar luminosities<br />
range from one million times more luminous than the Sun, to one<br />
ten-thous<strong>and</strong>th of the luminosity of the Sun. <strong>The</strong> basic luminosity<br />
categories from most to least luminous are I <strong>and</strong> II, supergiants <strong>and</strong><br />
bright giants respectively, III giants, IV subgiants, V main sequence<br />
stars, VI subdwarfs <strong>and</strong> VII white dwarfs.<br />
Starting at the upper left-h<strong>and</strong> corner <strong>and</strong> curving down to the lower<br />
right-h<strong>and</strong> corner is a b<strong>and</strong> called the main sequence. ~90% of all stars<br />
lie within the main sequence. <strong>The</strong>se stars run from the hot <strong>and</strong> bright<br />
O <strong>and</strong> B stars at the top left-h<strong>and</strong> corner to the cool, dim K <strong>and</strong> M<br />
stars at the lower right-h<strong>and</strong> corner. Main sequence stars have a fairly<br />
steady rate of hydrogen fusion ongoing in their cores. In main sequence<br />
stars, the radiation pressure pushing outward from the fusion process<br />
balanced by the inward pull of gravitational forces maintains a state<br />
of dynamic equilibrium. When hydrogen in the core is depleted <strong>and</strong><br />
radiation pressure decreases, the two forces become unbalanced <strong>and</strong> the<br />
star “moves off the main sequence” <strong>and</strong> begins a series of evolutionary<br />
stages – the final end product(s) depending upon the initial mass of the<br />
star. <strong>The</strong> giant <strong>and</strong> supergiant branches of the H-R diagram are occupied<br />
by stars that have transitioned from the main sequence <strong>and</strong> are fusing heavier atomic nuclei.<br />
As most stars transition from the main sequence to the giant <strong>and</strong> supergiant branches, they exhibit<br />
types of variability that are also confined to specific locations on the diagram.<br />
<strong>Pulsating</strong> <strong>Variable</strong> <strong>Stars</strong> <strong>and</strong> Light Curves<br />
As many stars transition from one stage to another on the H-R diagram they vary in brightness. <strong>The</strong><br />
brightness that a star appears to have (apparent magnitude) from our perspective here on Earth<br />
depends upon its distance from Earth <strong>and</strong> its actual intrinsic brightness, or absolute magnitude<br />
(M V). <strong>The</strong> behavior of stars that vary in magnitude (brightness) can be studied by measuring their<br />
changes in brightness over time <strong>and</strong> plotting the changes on a graph called a light curve. Light<br />
curves are usually plots of apparent magnitude<br />
over time. Historically the time scale has been<br />
the Julian Day (JD), a counting system starting<br />
with January 1, 4713 BC – Julian Day number 1.<br />
Measuring <strong>and</strong> recording the changes in magnitude<br />
<strong>and</strong> plotting the resulting light curves allow astronomers<br />
to determine the period of variation. <strong>The</strong><br />
period is the amount of time it takes for the star<br />
to go through one complete cycle from maximum<br />
magnitude through minimum magnitude <strong>and</strong> back<br />
to maximum magnitude. <strong>The</strong> 2011 General Catalog<br />
of <strong>Variable</strong> <strong>Stars</strong> (GCVS) classifies 43,675 Milky<br />
Way Galaxy stars into several different categories<br />
<strong>and</strong> subcategories of variability.<br />
<strong>The</strong> intrinsic, pulsating variable stars located in<br />
the instability regions of the H-R diagram vary in<br />
© 2012 National Earth Science Teachers Association. All Rights Reserved.